0307
Cerebral Blood Volume Mapping using Fourier-Transform based Velocity-Selective Saturation Pulse Trains1Johns Hopkins University, Baltimore, MD, United States, 2F.M. Kirby Research Center for Functional Brain Imaging, Kennedy Krieger Institute, Baltimore, MD, United States, 3Department of Radiology, Zhujiang Hospital, Southern Medical University, Guangzhou, China, 4Ewha Womans University, Seoul, Republic of Korea, 5Case Western Reserve University, Cleveland, OH, United States
Synopsis
A new non-contrast cerebral blood volume (CBV) quantification technique is proposed using Fourier-transform based velocity-selective saturation (FT-VSS) pulse trains. Its utility is assessed for healthy subjects at 3T and compared to a method using conventional flow-dephasing VS pulse trains. FT-VSS showed greater immunity to gradient imperfections and up to 40% higher SNR. The better performance of FT-VSS pulse trains in CBV measurements can be explained by the effective background suppression related to its velocity-selective profile: static tissue signal in the saturation band and flowing spins in the passband, which is opposite from the velocity response of the conventional method.
Introduction:
The ability to quantify cerebral blood volume (CBV) without contrast agents provides a preferred alternative to dynamic susceptibility contrast (DSC)-MRI. Arterial spin labeling (ASL) methods typically apply spatially-selective labeling modules at supplying arteries under imaging volumes for assessment of cerebral blood flow (CBF) or arterial CBV (CBVa) 1-5. To reduce the sensitivity to transit time, conventional velocity-selective (VS) labeling modules, which insert flow-dephasing gradients in a 90ºx-refocus-90º-x pulse train, have been employed for measuring CBF 6-8 and CBV 9. Recently, Fourier-transform (FT) based VS pulse trains, which saturate or invert static tissue while preserving moving spins, were introduced for quantitative CBF mapping 10. Here we demonstrate the utility of a FT based VS saturation (FT-VSS) pulse train for CBV quantification.Methods:
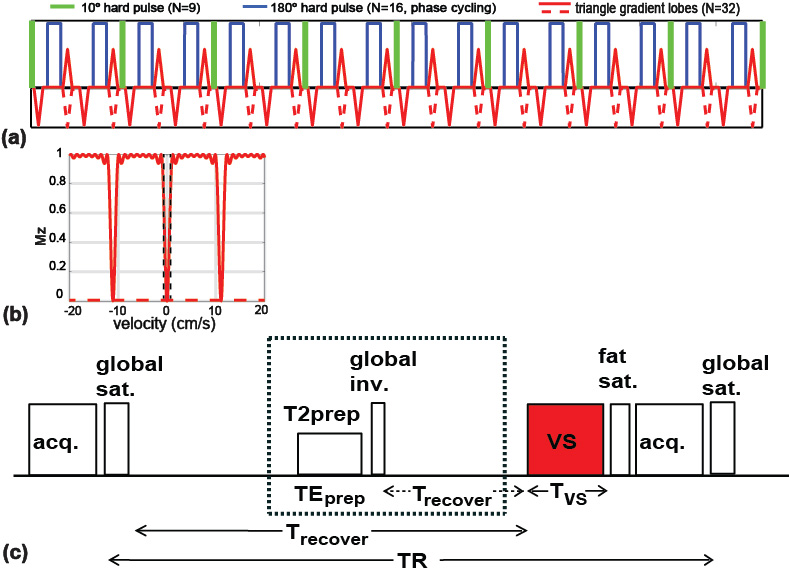
The FT-VSS pulse train 10 is composed of nine excitation pulses (10° each), interleaved with pairs of refocusing pulses and gradients, for eight velocity-encoding steps (16ms each; total duration TVS=128ms, Fig. 1a). The velocity-sensitive labeling module with triangular gradient lobes (maximum amplitude=22mT/m; slope=0.6ms) of alternating polarity yields a saturation band within the cut-off velocity (Vc) of 0.35cm/s (Fig. 1b); The velocity-compensated control module applies unipolar gradient lobes for saturation of all the spins regardless of velocities (red dashed lines in Figs. 1a,b). For comparison, the conventional VS pulse train consists of ±90° pulses enclosing double refocused hyperbolic tangent (DRHT) pulses with surrounding gradients (TVS=40ms, Vc=0.35cm/s) 9. The pulse sequence for measuring CBV 9 includes a saturation module, a CSF-suppression module and a VS labeling/control module immediately before an acquisition module (Fig. 1c).
Studies were performed on a 3T Philips scanner using a 32-channel head coil for reception. A total of six CBV protocols were compared using DRHT and FT-VSS modules with velocity-encoding gradients along the left-right (L-R), anterior-posterior (A-P) or superior-inferior (S-I) directions respectively. Experiments were conducted on an oil phantom for evaluation of eddy current effect 9 as well as 6 healthy volunteers (25~53yrs) after written informed consent. A proton density-weighted image (SIPD) was acquired for quantification and a double inversion recovery (DIR) image was acquired to visualize gray matter. The 2D EPI acquisition was applied with 10 continuous slices and an acquisition resolution of 3.3×3.3×4.4mm3. The TR was 5.9ms and the six protocols for CBV mapping were 5min each (Nave=24).
CBV was computed using a formula developed previously 9:
CBV=100·λ·(SIlabel - SIcontrol) / (SIPD·∑(χi·αi·M(T1,i)·M(T2,i)))
where λ=0.9 mL blood/g tissue, χi, αi, M(T1,i) and M(T2,i) are the fraction of CBV, the labeling efficiency, T1 and T2 effects of the applied VS pulse trains within each microvessel compartment (i=arteriolar, capillary and venular) 9. For each subject, a binary gray matter (GM) mask was obtained from the DIR image by thresholding. When voxels with large vessels were excluded, averaged CBV and temporal SNR values from the GM mask were calculated for each experiment.
Results:
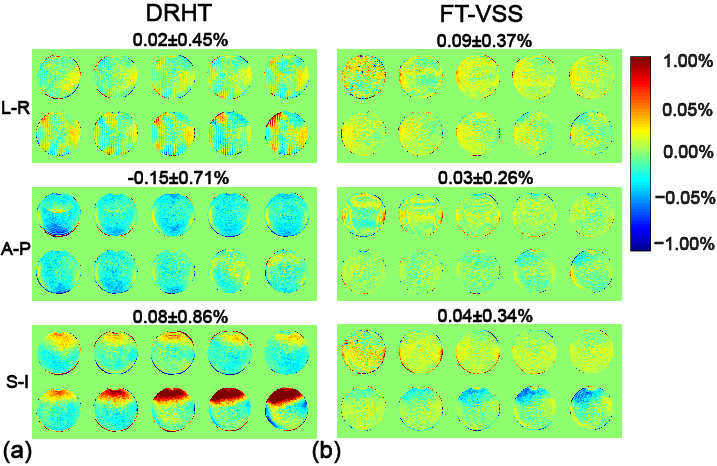
Fig. 2 displays the effects of gradient imperfections across the phantom. The normalized subtraction errors along A-P, L-R and S-I directions are 0.02±0.45%, -0.15±0.71% and 0.08±0.86% for DRHT, vs. 0.09±0.37%, 0.03±0.26% and 0.04±0.34% for FT-VSS, respectively. Compared to DRHT, the FT-VSS results showed less variation both spatially and among different encoding directions, thus more resistance to eddy currents and other gradient imperfections.
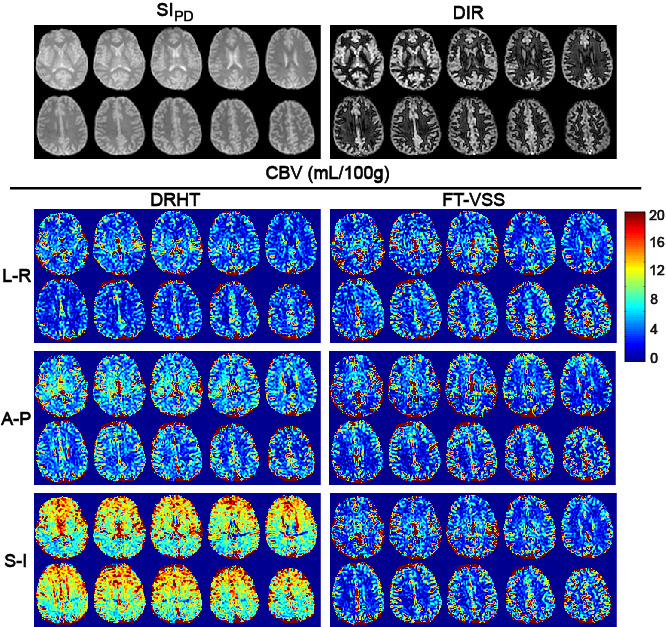
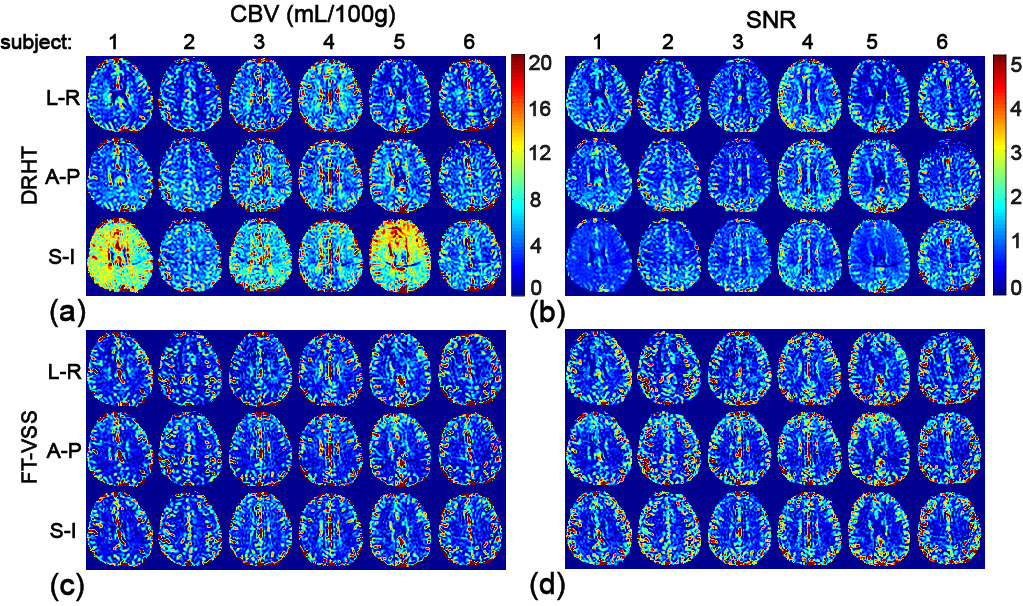
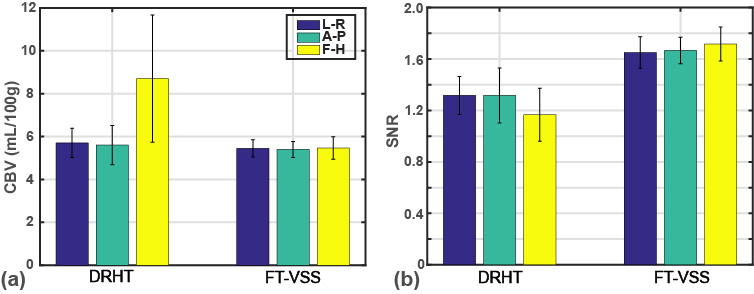
Representative data from all 10 slices for one subject (#5) are shown in Fig. 3 with SIPD, DIR, and CBV maps acquired using DRHT and FT-VSS along A-P, L-R and S-I directions. The CBV maps and corresponding SNR images of different directions of only the 5th slice of all 6 subjects are displayed in Figs 4a,b for DRHT and Figs 4c,d for FT-VSS, respectively. DRHT shows visible and sometimes substantial artifacts in A-P and F-H directions (Figs. 3, 4), most likely related to the eddy-current effect observed in Fig. 2. In contrast, FT-VSS produced CBV maps that were more consistent across all three directions with a higher SNR. FT-VSS yielded similar averaged GM CBV values among different velocity-encoding directions, 5.4±0.4, 5.4±0.4 and 5.5±0.5mL/100g (Fig. 5a), in line with literature values 11-13, and 31-42% increase of SNR relative to DRHT results (Fig. 5b).
Discussion and Conclusion:
Absolute CBV quantification using FT-VSS pulse trains was compared to a conventional approach for healthy subjects at 3T. FT-VSS showed greater immunity to gradient imperfections and higher SNR over the method based on DRHT pulse trains. The better performance of FT-VSS pulse trains in CBV measurement can be explained by the effective background suppression related to its velocity-selective profile: static tissue signal in the saturation band and flowing spins in the passband, which is opposite from the velocity response of flow-dephasing DRHT pulse trains.Acknowledgements
No acknowledgement found.References
1. Alsop DC, Detre JA, Golay X, Gunther M, Hendrikse J, Hernandez-Garcia L, Lu H, Macintosh BJ, Parkes LM, Smits M, van Osch MJ, Wang DJ, Wong EC, Zaharchuk G. Recommended implementation of arterial spin-labeled perfusion MRI for clinical applications: A consensus of the ISMRM perfusion study group and the European consortium for ASL in dementia. Magn Reson Med 2015;73:102-116.
2. Petersen ET, Lim T, Golay X. Model-free arterial spin labeling quantification approach for perfusion MRI. Magnetic Resonance in Medicine 2006;55(2):219-232.
3. Yan L, Li C, Kilroy E, Wehrli FW, Wang DJ. Quantification of arterial cerebral blood volume using multiphase-balanced SSFP-based ASL. Magn Reson Med 2012;68(1):130-139.
4. Hua J, Qin Q, Donahue MJ, Zhou J, Pekar JJ, van Zijl PC. Inflow-based vascular-space-occupancy (iVASO) MRI. Magn Reson Med 2011;66(1):40-56.
5. Hua J, Qin Q, Pekar JJ, van Zijl PC. Measurement of absolute arterial cerebral blood volume in human brain without using a contrast agent. NMR in biomedicine 2011;24(10):1313-1325.
6. Duhamel G, de Bazelaire C, Alsop DC. Evaluation of systematic quantification errors in velocity-selective arterial spin labeling of the brain. Magn Reson Med 2003;50(1):145-153.
7. Wong EC, Cronin M, Wu WC, Inglis B, Frank LR, Liu TT. Velocity-selective arterial spin labeling. Magn Reson Med 2006;55(6):1334-1341.
8. Meakin JA, Jezzard P. An optimized velocity selective arterial spin labeling module with reduced eddy current sensitivity for improved perfusion quantification. Magn Reson Med 2013;69(3):832-838.
9. Dexiang Liu, Feng Xu, Doris D. Lin, Peter C.M. van Zijl, Qin Qin, Quantitative Measurement of Cerebral Blood Volume using Velocity-Selective Pulse Trains, Magn Reson Med, 77, 92-101. (2017)
10. Qin Qin, Peter C. M. van Zijl, Velocity-Selective-Inversion Prepared Arterial Spin Labeling, Magn. Reson. Med. 76, 1136-1148, (2016)
11. Bjornerud A, Emblem KE. A fully automated method for quantitative cerebral hemodynamic analysis using DSC-MRI. Journal of cerebral blood flow and metabolism : official journal of the International Society of Cerebral Blood Flow and Metabolism 2010;30(5):1066-1078.
12. Knutsson L, Lindgren E, Ahlgren A, van Osch MJ, Bloch KM, Surova Y, Stahlberg F, van Westen D, Wirestam R. Dynamic susceptibility contrast MRI with a prebolus contrast agent administration design for improved absolute quantification of perfusion. Magn Reson Med 2014;72(4):996-1006.
13. Uh J, Lewis-Amezcua K, Varghese R, Lu H. On the measurement of absolute cerebral blood volume (CBV) using vascular-space-occupancy (VASO) MRI. Magn Reson Med 2009;61(3):659-667.
Figures