0304
Investigation into water transport mechanisms in the brain using a combination of T2 measurements and crusher gradients with ASL1C.J. Gorter Center for High Field MRI, Radiology, Leiden University Medical Center, Leiden, Netherlands, 2Leiden Institute of Brain and Cognition, Leiden, Netherlands
Synopsis
TRUST and crusher gradients were combined with time-encoded pCASL to examine the transport of water from the vasculature to the tissue in the brain. At early time points, where the intravascular portion of the ASL signal is high, the crusher gradients resulted in a large reduction in the average signal. By comparing the intravascular fraction obtained from crushed signal to T2 measurements, it was observed that the change in T2 is greater in later time points than the change in intravascular fraction. This suggests that T2 methods are more sensitive to alterations in the blood-brain barrier than crusher gradient techniques.
Introduction
The integrity of the blood-brain barrier (BBB) can be assessed by measuring water transport from the vascular to the tissue compartment1. This can be achieved with arterial spin labeling (ASL), provided there is a way to separate the intravascular from the extravascular contributions to the signal. Two methods have been proposed to achieve this goal: 1) T2-relaxation-under-spin-tagging (TRUST) and 2) the use of bipolar gradients. TRUST is based on differences in T2 between the intravascular (IV) and extravascular compartments, which are used as a means to separate the contributions to the total signal2. Alternatively, bipolar gradients can be added to the ASL sequence to crush intravascular signal3. A combination of both methods could improve our understanding of these, as well as offer new information to be gained about the transport of water across the BBB. This study aims to incorporate TRUST and crusher gradients into one ASL sequence, and to assess whether these techniques offer complementary or similar information.Methods
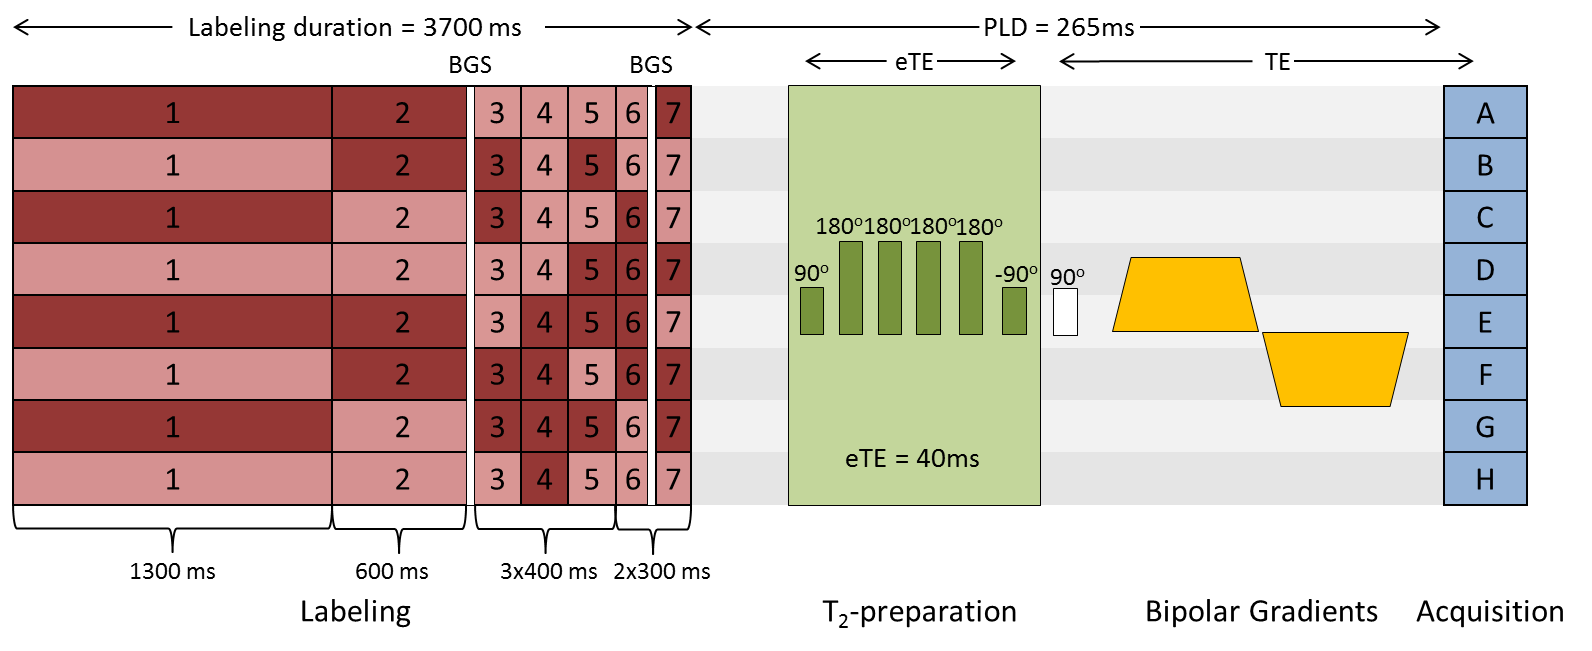
A total of 8 healthy volunteers (6 males, ages 21-36) were examined. Written informed consent was obtained from all participants. All images in this study were acquired on a 3 T Achieva (Philips, Best, the Netherlands) system with a 32-channel head-coil. The sequence consisted of time-encoded pseudo-continuous ASL (pCASL) labeling followed by an echo-planar imaging readout (Figure 1). TRUST-preparation was performed using three effective echo times (eTE) of 0 ms, 40 ms and 80 ms, with 0, 4 and 8 refocusing pulses, respectively, arranged in a MLEV composite-pulse decoupling sequence pattern. Three crusher gradient settings were added. The maximum gradient strength corresponded to the lowest encoding velocity (Venc) at 2 cm/s, applied in three directions simultaneously. For the two other settings, gradient strength was either halved or set to zero. To counteract the loss in SNR accompanied by using longer eTEs, for every gradient setting, one image was acquired with eTE = 0 ms, two with eTE = 40 ms and three with eTE = 80 ms; in total, 72 acquisitions were made.
Analysis was performed in MATLAB (The Mathworks, MA). Perfusion maps at different post-labeling delays (PLD) were obtained by decoding the time-encoded images. Average gray matter (GM) signal was then measured using a mask obtained from thresholding the perfusion-weighted images. T2 was calculated from fitting the average population signal without the application of crusher gradients to a monoexponential decay model. The fraction of IV signal was calculated by subtracting the perfusion images with crusher gradients from the ones without gradients and dividing by the non-crushed signal.
Results
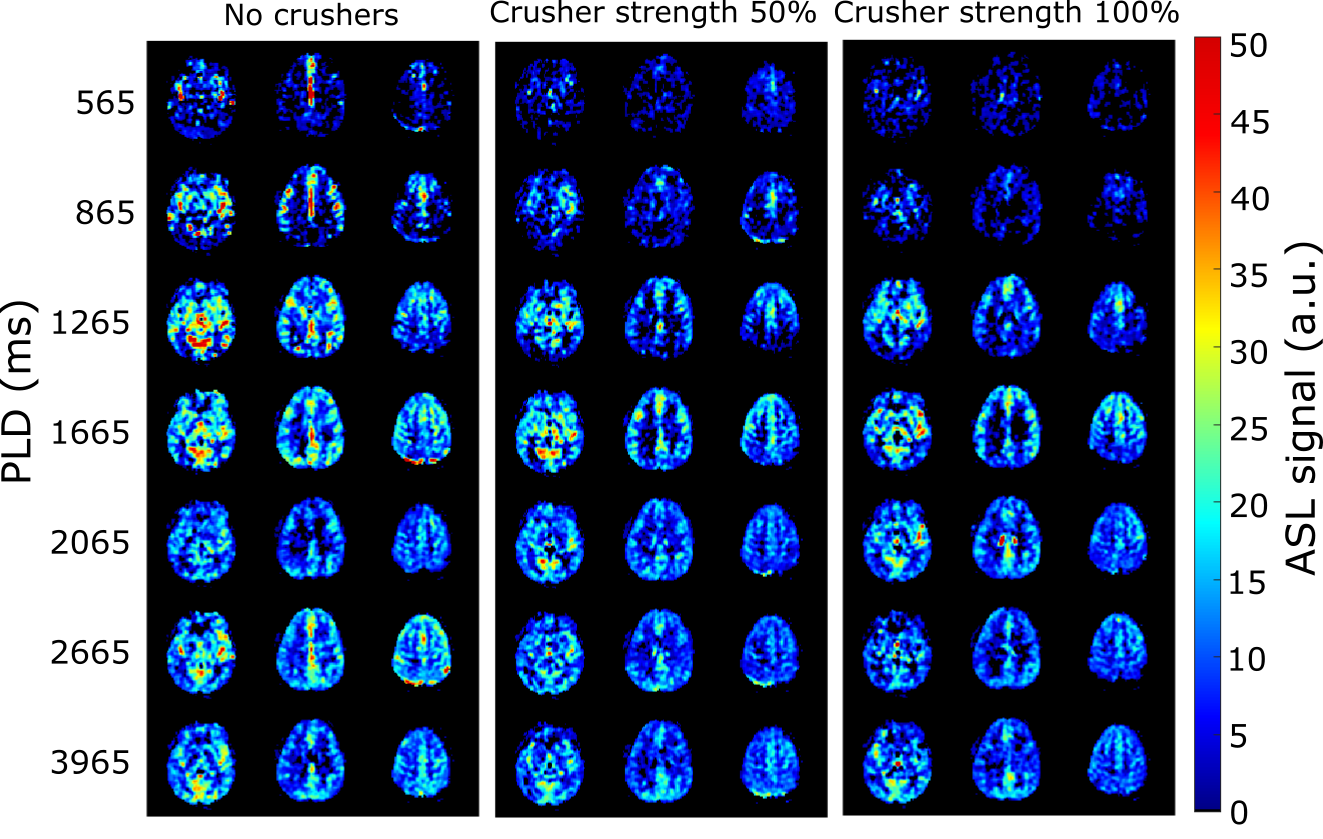
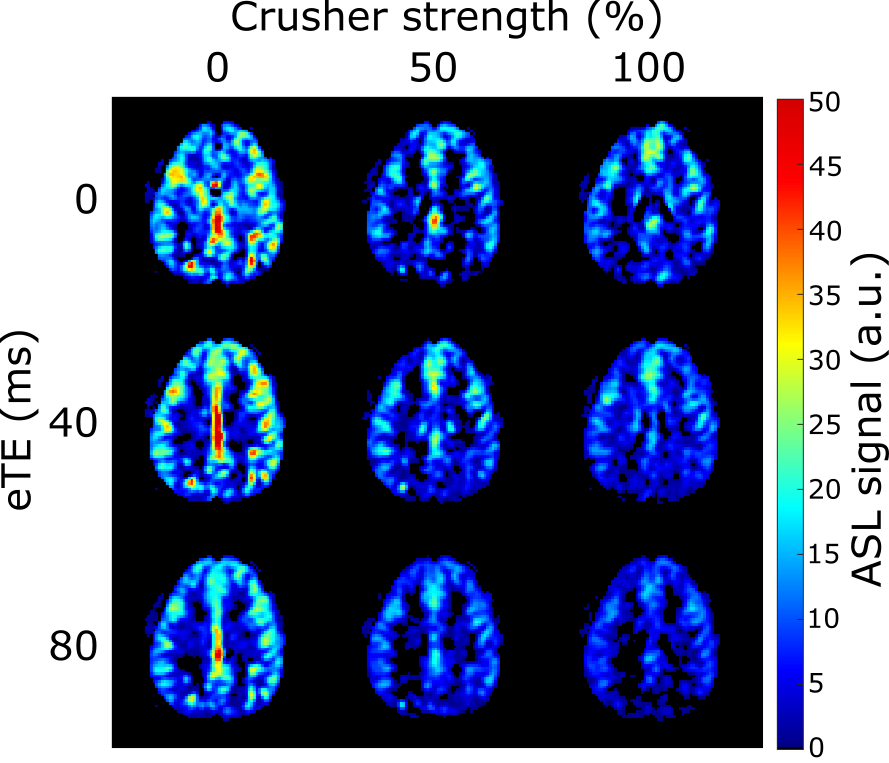
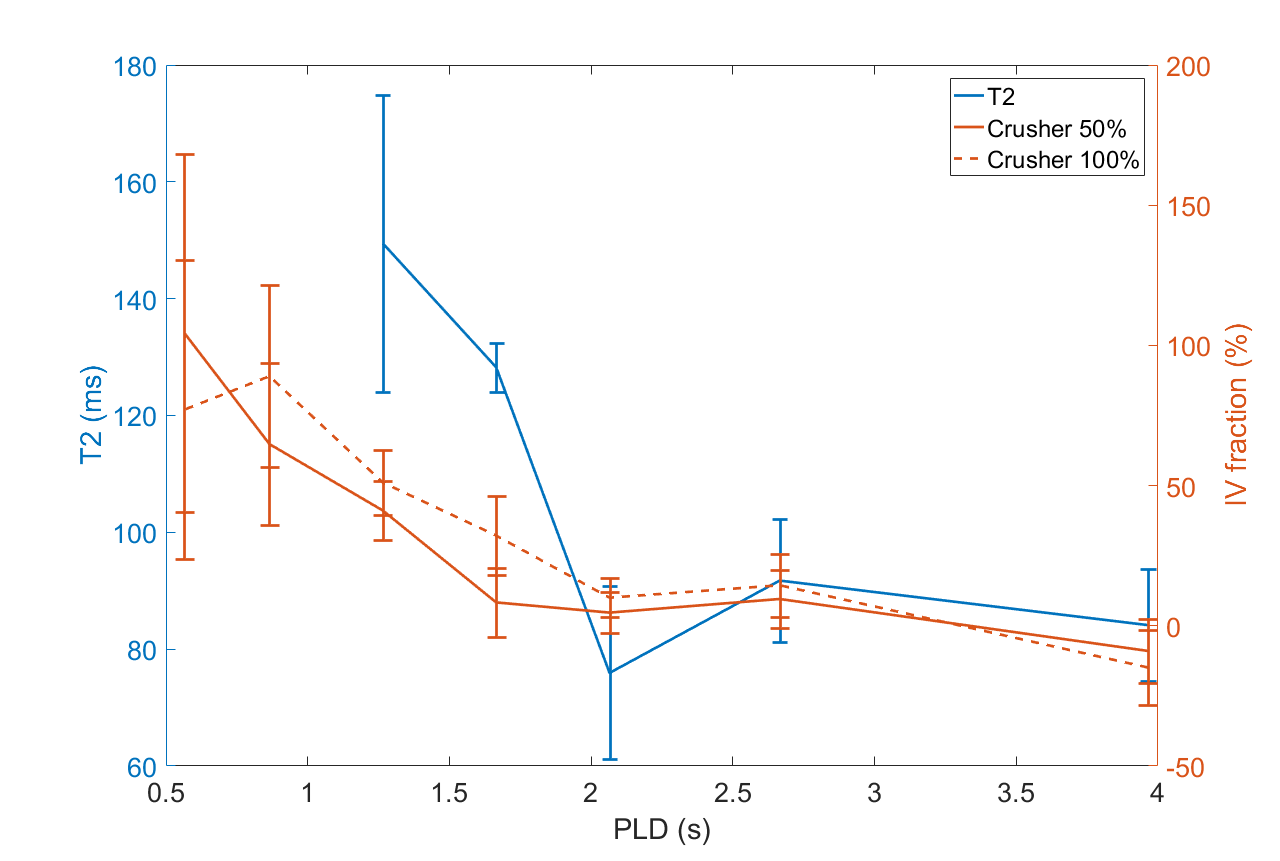
Figure 2 shows the ASL signal for three slices in one subject, at all PLDs and crusher settings. In early time points, much of the ASL-signal disappeared with increasing crusher strength while at later times the ASL-signal remained unchanged. Figure 3 shows one slice of the perfusion maps for three echo times and three gradient strengths. Figure 4a represents the GM signal, averaged over all subjects, without crusher gradients, at three eTEs. The signal is seen to decrease with an increasing eTE, while leaving the shape of the curve unchanged. In figure 4b, this signal is plotted for eTE=0 ms and three crusher strengths. At early PLDs, signal decreases with increasing crusher strength, while the signal at later PLDs is independent of crusher strength. Peak signal is reached later with increasing crusher strength. Figure 5 shows the intravascular signal fraction as well as measured T2.Discussion and Conclusion
From Figure 4b, it is clear that the ASL-signal for short PLDs was more affected by the crushers than at later PLDs, likely because the label was still in larger arteries. Higher gradient strength resulted in a higher estimated IV fraction (Figure 5), which can be explained by the fact that gradients only dephase IV signal down to a certain velocity. With higher gradient strength, more signal is crushed, resulting in higher IV estimates.
T2 values for the IV and tissue compartments were previously estimated to be 175 ms4 and 100 ms5, respectively. Figure 5 reveals that the T2 values trail the crushing effect, i.e. crushing has the largest effect for PLDs ≤ 1665 ms, whereas the T2 drops for PLDs ≥ 1665 ms. This is another indication that gradients do not crush ASL-signal up to the level of the microvasculature. Since damage to the BBB is expected to mainly affect arterioles and capillaries, this implies that crusher-based methods are less suitable to detect subtle BBB changes than T2-based methods, because crushing mainly affects the labeled blood proximally from where the water transport across the BBB takes place.
Acknowledgements
M.J.P. van Osch and L. Petitclerc were supported by NWO, under research program VICI, project number 016.160.351.References
1. St. Lawrence, K. S., Owen, D., & Wang, D. J. J. (2012). A two-stage approach for measuring vascular water exchange and arterial transit time by diffusion-weighted perfusion MRI. Magnetic Resonance in Medicine, 67(5), 1275–1284.
2. Lu, H., & Ge, Y. (2008). Quantitative evaluation of oxygenation in venous vessels using T2-relaxation-under-spin-tagging MRI. Magnetic Resonance in Medicine, 60(2), 357–363.
3. Ye, F. Q., Mattay, V. S., Jezzard, P., Frank, J. A., Weinberger, D. R., & McLaughlin, A. C. (1997). Correction for vascular artifacts in cerebral blood flow values measured by using arterial spin tagging techniques. Magnetic Resonance in Medicine, 37(2), 226–235.
4. Chen, J. J., & Pike, G. B. (2009). Human whole blood T2 relaxometry at 3 tesla. Magnetic Resonance in Medicine, 61(2), 249–254.
5. Stanisz, G. J., Odrobina, E. E., Pun, J., Escaravage, M., Graham, S. J., Bronskill, M. J., & Henkelman, R. M. (2005). T1, T2 relaxation and magnetization transfer in tissue at 3T. Magnetic Resonance in Medicine, 54(3), 507–512.
Figures