0303
Non-contrast assessment of blood-brain-barrier permeability with water-extraction-with-phase-contrast-arterial-spin-tagging (WEPCAST) MRI1Department of Radiology, Johns Hopkins University, Baltimore, MD, United States, 2Department of Neurology, Johns Hopkins University, Baltimore, MD, United States, 3Department of Radiology, Leiden University Medical Center, Leiden, Netherlands, 4Department of Radiology, New York University Langone Medical Center, New York, NY, United States
Synopsis
A new method for non-contrast assessment of blood-brain-barrier (BBB) permeability to water has been proposed: water-extraction-with-phase-contrast-arterial-spin-tagging (WEPCAST) MRI, which allows selective imaging of venous ASL signal. Studies were performed to show proof-of-principle and Look-Locker readout were applied to expedite data acquisition. The results were consistent with previous literature. Mild hypercapnia was also shown to enhance the sensitivity of the technique significantly.
Purpose
Disruption of Blood-brain barrier (BBB) permeability has been associated with many neurological diseases. Current methods using contrast-agent are primarily sensitive to major leakage of BBB to macromolecules, but may not detect subtle changes of BBB at early stage of diseases1. In this study, we aimed to measure global BBB permeability to water, without using any exogenous agent. We first developed a new sequence, water-extraction-with-phase-contrast-arterial-spin-tagging (WEPCAST) MRI, to selectively measure venous ASL signals, from which water permeability of BBB can be quantified. Next, to accelerate the acquisition, we developed a background-suppressed Look-Locker version of WEPCAST, and the results were compared to conventional WEPCAST. Finally, the benefit of hypercapnia and hyperoxia in enhancing the sensitivity of the technique was evaluated.Theory
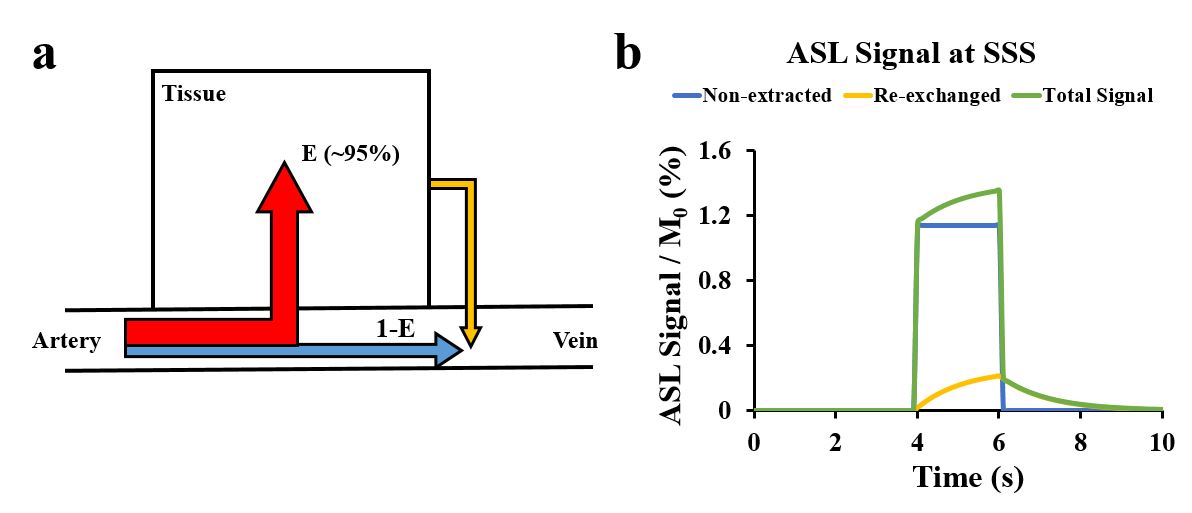
BBB permeability can be characterized by permeability-surface-area product (PS): $$$PS=-ln(1-E)·f$$$, where $$$E$$$ is the extraction fraction of water in its first-pass and $$$f$$$ is cerebral-blood-flow (CBF)2. To measure E, we can use pCASL to label the water molecules in arterial blood. At capillary-tissue interface, most labeled spins are extracted to tissue (Fig.1a, red), whereas non-extracted spins are drained directly to venous system (blue). Additionally, a small amount of labeled spins that are extracted to tissue will re-exchange back into venous system (yellow). Then ASL signal at superior-sagittal-sinus (SSS) can be written as $$$ΔM = ΔM_{1}+ΔM_{2}$$$, where $$$ΔM_{1}=2α(1-E)M_{0,blood}e^{-\frac{δ_{v}}{T_{1,blood}}}c(t)$$$ represents non-extracted spins and $$$ΔM_{2}=2αf/λEM_{0,blood}e^{-\frac{δ_{v}}{T_{1,blood}}}c(t)\bigotimes [r(t)m(t)]$$$ represents extracted spins that were re-exchanged into vessel. $$$λ$$$ is blood-brain partition coefficient, $$$α$$$ is labeling efficiency, $$$δ_{v}$$$ is bolus arrival time (BAT) to SSS, $$$\bigotimes $$$ denotes convolution, $$$c(t)=\left\{\begin{matrix}1, & if δ_{t}<t<δ_{t}\\ 0, & otherwise\end{matrix}\right.$$$ is arterial input function, $$$r(t)=e^{-ft/λ}$$$ is residue function and $$$m(t)=e^{-t/T_{1,tissue} }$$$ represents T1 relaxation3. Numerical simulation of SSS signal is shown in Fig.1b.Method
Study I – Selective imaging of venous ASL signal by WEPCAST MRI
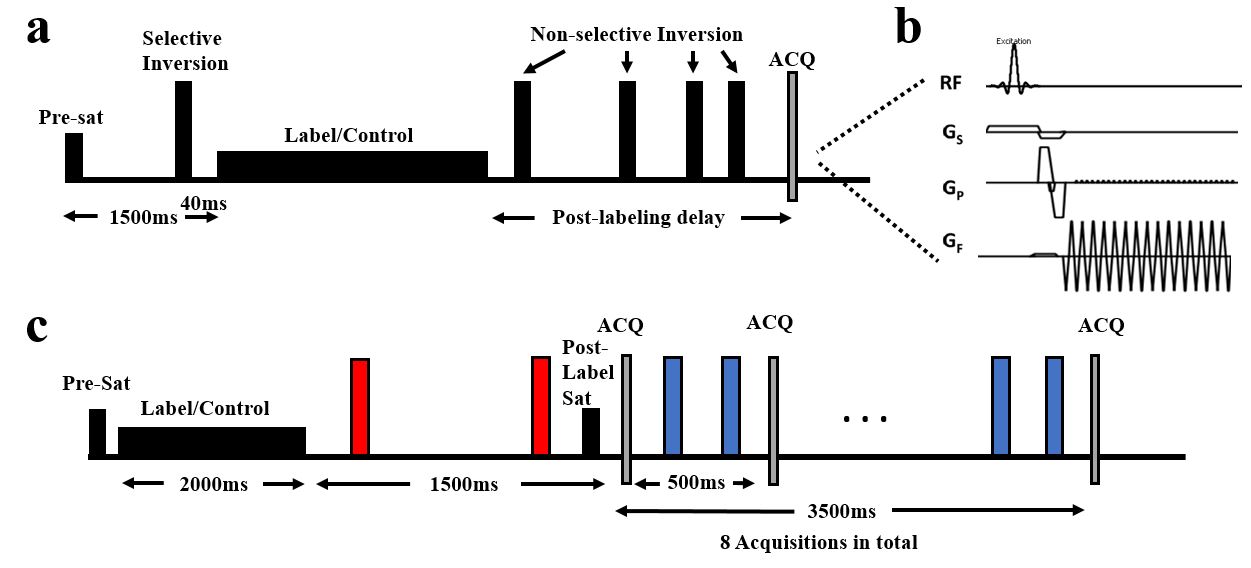
To reduce the confounding contribution of tissue perfusion signal, we devised a new sequence, WEPCAST MRI, by adding a phase-contrast velocity-encoding gradient during acquisition of pCASL sequence (Fig.2a-b). The velocity-encoding gradient modifies the venous signal as $$$ΔM=2(ΔM_{1}+ΔM_{2})|sin(\frac{πv}{2V_{enc}})|$$$, where $$$v$$$ is the velocity of blood and $$$V_{enc}$$$ is encoding velocity. Images were acquired in mid-sagittal plane (N=6, age:23±3 years, male/female:3/3) with four long post-labeling-delays (PLD): 3000, 3500, 4000, 4500ms and $$$V_{enc}$$$=15cm/s. Scan duration=19min47s.
Study II – Expediting data acquisition using a background-suppressed Look-Locker WEPCAST sequence
The purpose of this study was to expedite the acquisition by applying a background-suppressed Look-Locker readout (Fig.2c), which allows 8-PLD acquisitions in one TR. Coronal images were acquired (N=6, age:28±8 years, male/female:3/3). Scan duration=5min3s. Multiple single-PLD WEPCAST sequence in Study I were also conducted for comparison.
Study III – Enhancing sensitivity by CO2 inhalation
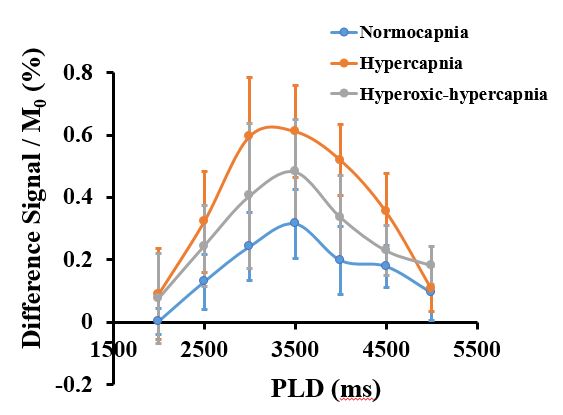
We examined the benefit of mild hypercapnia (2.5%CO2) on enhancing WEPCAST signal because we reasoned that 1) CO2 increases CBF, which decreases E; 2) CO2 reduces BAT; 3) CO2 increases T2* of blood, all of which should augment the targeted signal. We also tested the benefit of hyperoxia challenge (on top of hypercapnia), as an increase in venous oxygenation may further enhance the signal via an increase in T2*. Sequence in Study II were performed under normocapnia, hypercapnia and hyperoxic-hypercapnia periods (N=5, age:28±5 years, male/female:2/3).
Results and Discussion
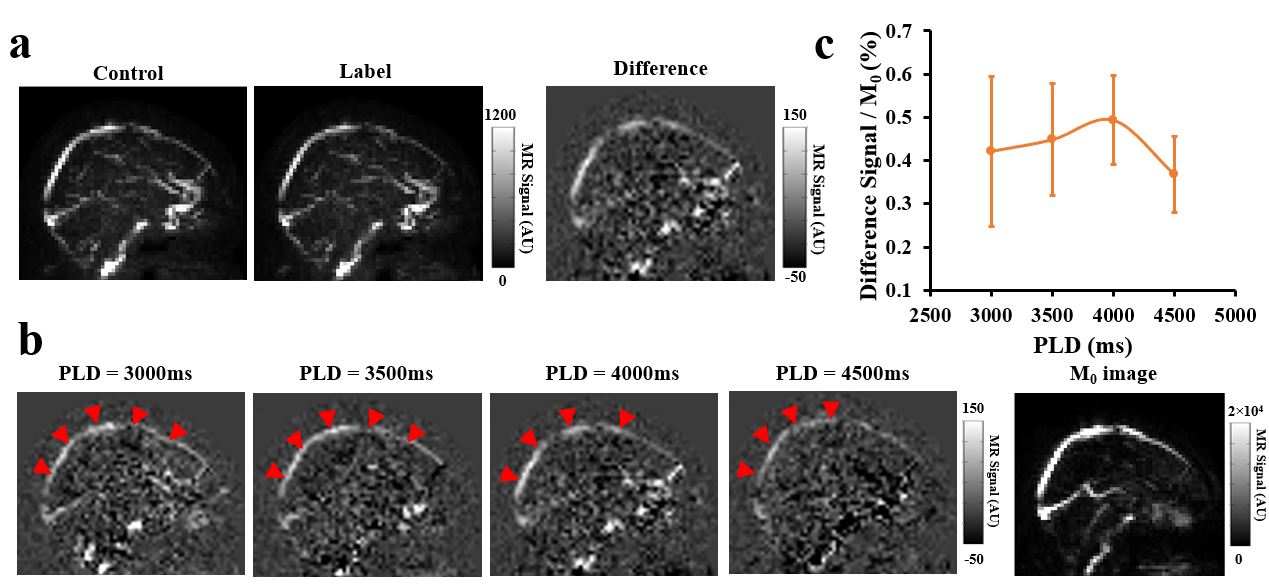
Study I: Fig.3a shows representative control, label, and difference images of WEPCAST MRI at PLD=4000ms. Venous signal can be seen at SSS and tissue signal is well suppressed. Fig.3b displays WEPCAST difference images for all PLD values. Quantitative analysis of posterior SSS revealed a signal curve shown in Fig.3c. Model fitting gave the average E of 95.5±1.1% and PS of 188.9±13.4mL/100g/min, which were consistent with previous literatures1,4-6.
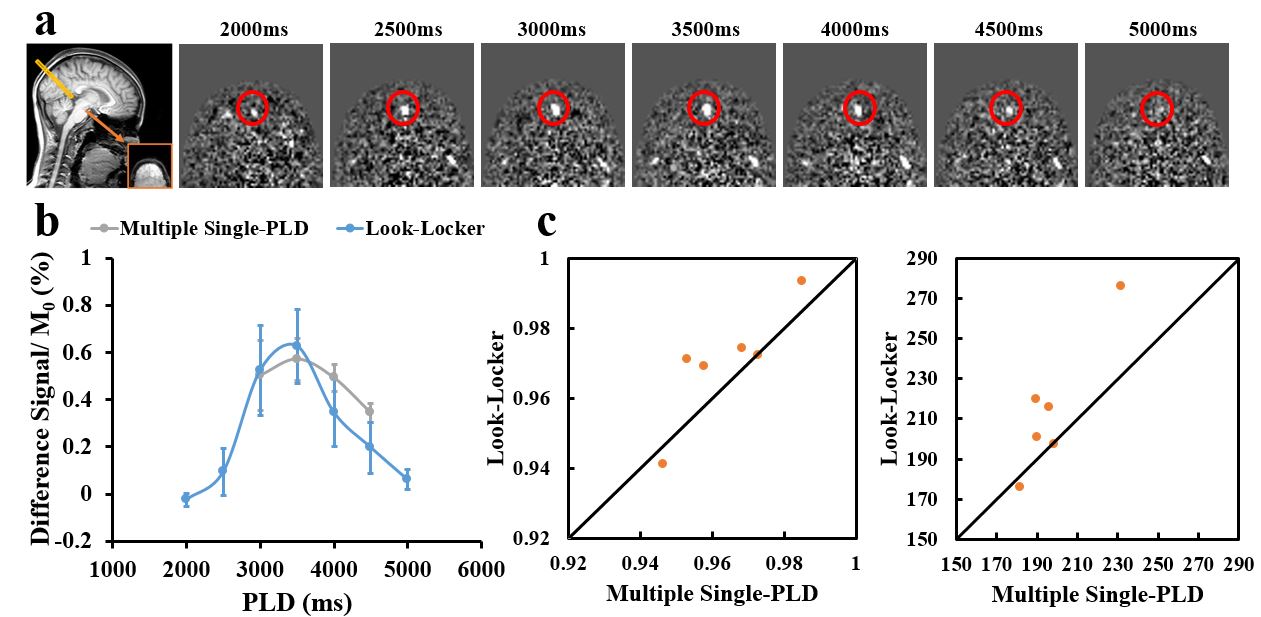
Study II: Fig.4a displays difference images acquired with LL-WEPCAST. Averaged signal curves acquired with the LL- and conventional WEPCAST sequences are shown in Fig.4b. The two curves manifest similar signal intensities and temporal characteristics. Scatter plots of E and PS obtained from two methods are shown in Fig.4c, suggesting a good agreement between them (correlation-coefficient E:0.87; PS:0.92). Average E calculated from multiple single-PLD sequence and LL sequence was 96.4±0.6% and 97.0±0.7%, respectively. The average PS was 198.0±7.2mL/100g/min and 214.2.6±13.9mL/100g/min, respectively. Paired t-test did not show a significant difference.
Study III: As shown in Fig.5, hypercapnia challenge induced a considerable increase in signal intensity. CoV was reduced (P=0.028). Hyperoxic-hypercapnia, however, did not further increase the signal.
Conclusion
In this study, we developed a new sequence, WEPCAST MRI, for assessment of BBB permeability of water without using any exogenous contrast agent. The estimated permeability was in good agreement with prior literature. We also demonstrated that mild hypercapnia can significantly enhance the sensitivity of this technique without causing discomfort.Acknowledgements
No acknowledgement found.References
1. St. Lawrence, K. S., Owen, D. and Wang, D. J. J., A two-stage approach for measuring vascular water exchange and arterial transit time by diffusion-weighted perfusion MRI. Magn. Reson. Med. 2012; 67: 1275–1284.
2. Crone, C., The permeability of capillaries in various organs as determined by use of the ‘indicator diffusion’ method. Acta Physiologica Scandinavica. 1963; 58: 292–305.
3. Buxton RB, Frank LR, Wong EC, Siewert B, Warach S, Edelman RR. A general kinetic model for quantitative perfusion imaging with arterial spin labeling. Magn Reson Med 1998;40:383-396.
4. Gregori, J., Schuff, N., Kern, R. and Günther, M., T2-based arterial spin labeling measurements of blood to tissue water transfer in human brain. J. Magn. Reson. Imaging. 2013; 37: 332–342.
5. Herscovitch, P., Raichle, M.E., Kilbourn, M.R. and Welch, M.J., Positron emission tomographic measurement of cerebral blood flow and permeability—surface area product of water using [15O]water and [11C]butanol. J Cereb Blood Flow Metab. 1987; 7: 527-542.
6. Paulson, O.B., Hertz, M.M., Bolwig, T.G. and Lassen, N.A., Filtration and diffusion of water across the blood-brain barrier in man. Microvasc Res. 1977; 13(1): 113-123.
Figures