0300
Reduction of the absorbed power around electrode tips in deep brain stimulation patients using pTx: Impact of number and arrangement of channelsBastien Guerin1,2, Darin Dougherty2,3, and Lawrence L. Wald1,2
1Radiology, Massachusetts General Hospital, Charlestown, MA, United States, 2Harvard Medical School, Boston, MA, United States, 3Psychiatry, Massachusetts General Hospital, Charlestown, MA, United States
Synopsis
We assess the potential of pTx for reduction of the absorbed power around electrode tips (APAET) in DBS patients using a realistic DBS patient model and electromagnetic field co-simulation. We simulate 5 coils, including a birdcage coil driven in quadrature and as a 2-channel pTx coil as well as four pTx coils with up to 16 channels arranged in up to two rows. We compare magnitude least square pulses with explicit constraints on the APAET and global SAR. We show that pTx, especially using head-only arrays, has the potential to alleviate the safety problem of DBS patients at 3 Tesla.
Introduction
Parallel transmission (pTx) has been proposed for flip-angle (FA) uniformity excitations at high fields while maintaining or decreasing the local specific absorption rate (SAR) [1,2]. PTx has been suggested as a possible strategy for SAR control at the electrode tip of deep brain stimulation (DBS) patients [3,4]. However, to our knowledge, no study has been performed exploring the SAR-reduction potential of pTx in realistic DBS patient models using multi-row pTx coil designs. In this work, we use a realistic DBD patient model in conjunction with a co-simulation strategy and constrained pTx pulse design to assess the potential of pTx to solve the RF-induced heating problem in DBS patients at 3 Tesla.Methods
DBS patient model: The DBS patient model used in this study was created as described in [5]. The model is a realistic representation of both the anatomy (bone, internal air and “average tissue” compartments) and the DBS implant (including extension cables, individual electrode cabling and the Implantable Pulse Generator). The model is based on head and neck CT scans of an actual DBS patient. FEM simulation: We simulated 5 coils, each of which were loaded with the DBS patient model: A 32-rungs high-pass body birdcage (BC) coil and four pTx coils with 8/16 channels distributed in 1/2 rows (Fig. 1). The BC coil was driven in two ways: As a quadrature coil or as a pTx coil with each quadrature port driven independently. The body pTx coils were designed on the same cylindrical former as the BC (diameter=711 mm, height=450 mm). The head pTx coils were designed on a former with a cylindrical base (diameter=320 mm) to which we added a partial circular arc curving toward the head (total height of coil=288 mm). We used a co-simulation strategy based on ADS (Agilent, Santa Clara CA) and HFSS (Ansys, Canonsburg PA) to compute the electromagnetic fields in the body model [2,6]. This allowed fast tuning and matching of the coil using a single multi-port simulation of each coil (simulation time was <24 hours per coil and was dominated by meshing of the DSB model). Pulse design: We arranged the electric field E in matrix form (E is Npixels×Nchannels), from which we computed the following Nchannels×Nchannels matrices: QP=dV×EH×diag(s)×E and QGS=EH×diag(s/(2r))×E), where dV is the voxel volume, s is the conductivity and r is the density vectors. QP is a matrix allowing fast computation of the absorbed power around the electrode tips (APAET) in Watts. The QP matrix was evaluated using high-resolution (0.1 mm) E-field maps within a small cylindrical volume (diam.=6 mm, length=15 mm) enclosing each electrode tip. The global SAR matrix QGS was computed using medium resolution (1.8 mm) E-field maps including the entire head but excluding a small spherical volume (rad.=15 mm) around each electrode tip. Using these matrices, we designed pTx pulses while constraining both the APAET and global SAR. We designed magnitude least-squares single-spoke slice-select pulses (transverse slice through the frontal lobe) with a target flip-angle (FA) of 10°. For each coil, L-curves where obtained by varying the APAET hard constraint.Results
The L-curves in Fig. 2 show the optimal tradeoff between the pulses FA error and associated APAET for each coil modeled. The pulses in Fig. 2 were designed by only constraining APAET (global SAR was not constrained). Although pTx coils are clearly able to dramatically decrease APAET while maintaining or improving the FA quality compared to BC-quad, this comes at the cost of unacceptably high global SAR if global SAR is not explicitly constrained in the pulse design process (Fig. 3). Figure 4 shows the more useful approach of constraining both the APAET and global SAR. In this case, the pTx coils were able to reduce the APAET by 35-91% compared to BC-quad while maintaining global SAR and improving the FA quality. The simplest pTx strategy consisting of driving the 2 channels of the BC coil independently reduced APAET by 17% at constant global SAR and FA error.Results
PTx coils with 8/16 channels arranged in 1/2 rows are able to greatly reduce the APAET in DBS patients imaged at 3 Tesla without increasing global SAR nor the FA excitation error. At constant number of channels, local pTx coils (=head only) greatly outperform body pTx coils in the APAET and FA error metric at constant global SAR.Acknowledgements
NIH grants K99/R00 EB019482, R01EB006847.References
[1] Lee, J., et al. (2012). "Local SAR in parallel transmission pulse design." Magnetic Resonance in Medicine 67(6): 1566-1578. [2] Guérin, B., et al. (2015). "Comparison of simulated parallel transmit body arrays at 3 T using excitation uniformity, global SAR, local SAR and power efficiency metrics." Magnetic resonance imaging 73(3): 1137-1150. [3] Eryaman, Y., et al. (2014). "Parallel transmit pulse design for patients with deep brain stimulation implants." Magnetic Resonance in Medicine 73(5): 1896-1903. [4] Gudino, M., et al. (2013). Parallel transmit excitation at 1.5 T based on the minimization of a driving function for device heating. Proceedings of the 21st Annual Meeting of ISMRM, Salt Lake City, Utah, USA. [5] Guerin et al (2018). “Generation of a “virtual population” of deep brain stimulation patient models for MRI safety studies”. Proceedings of the ISMRM, Paris France. [6] Kozlov, M. and R. Turner (2009). "Fast MRI coil analysis based on 3-D electromagnetic and RF circuit co-simulation." Journal of Magnetic Resonance 200(1): 147-152.Figures
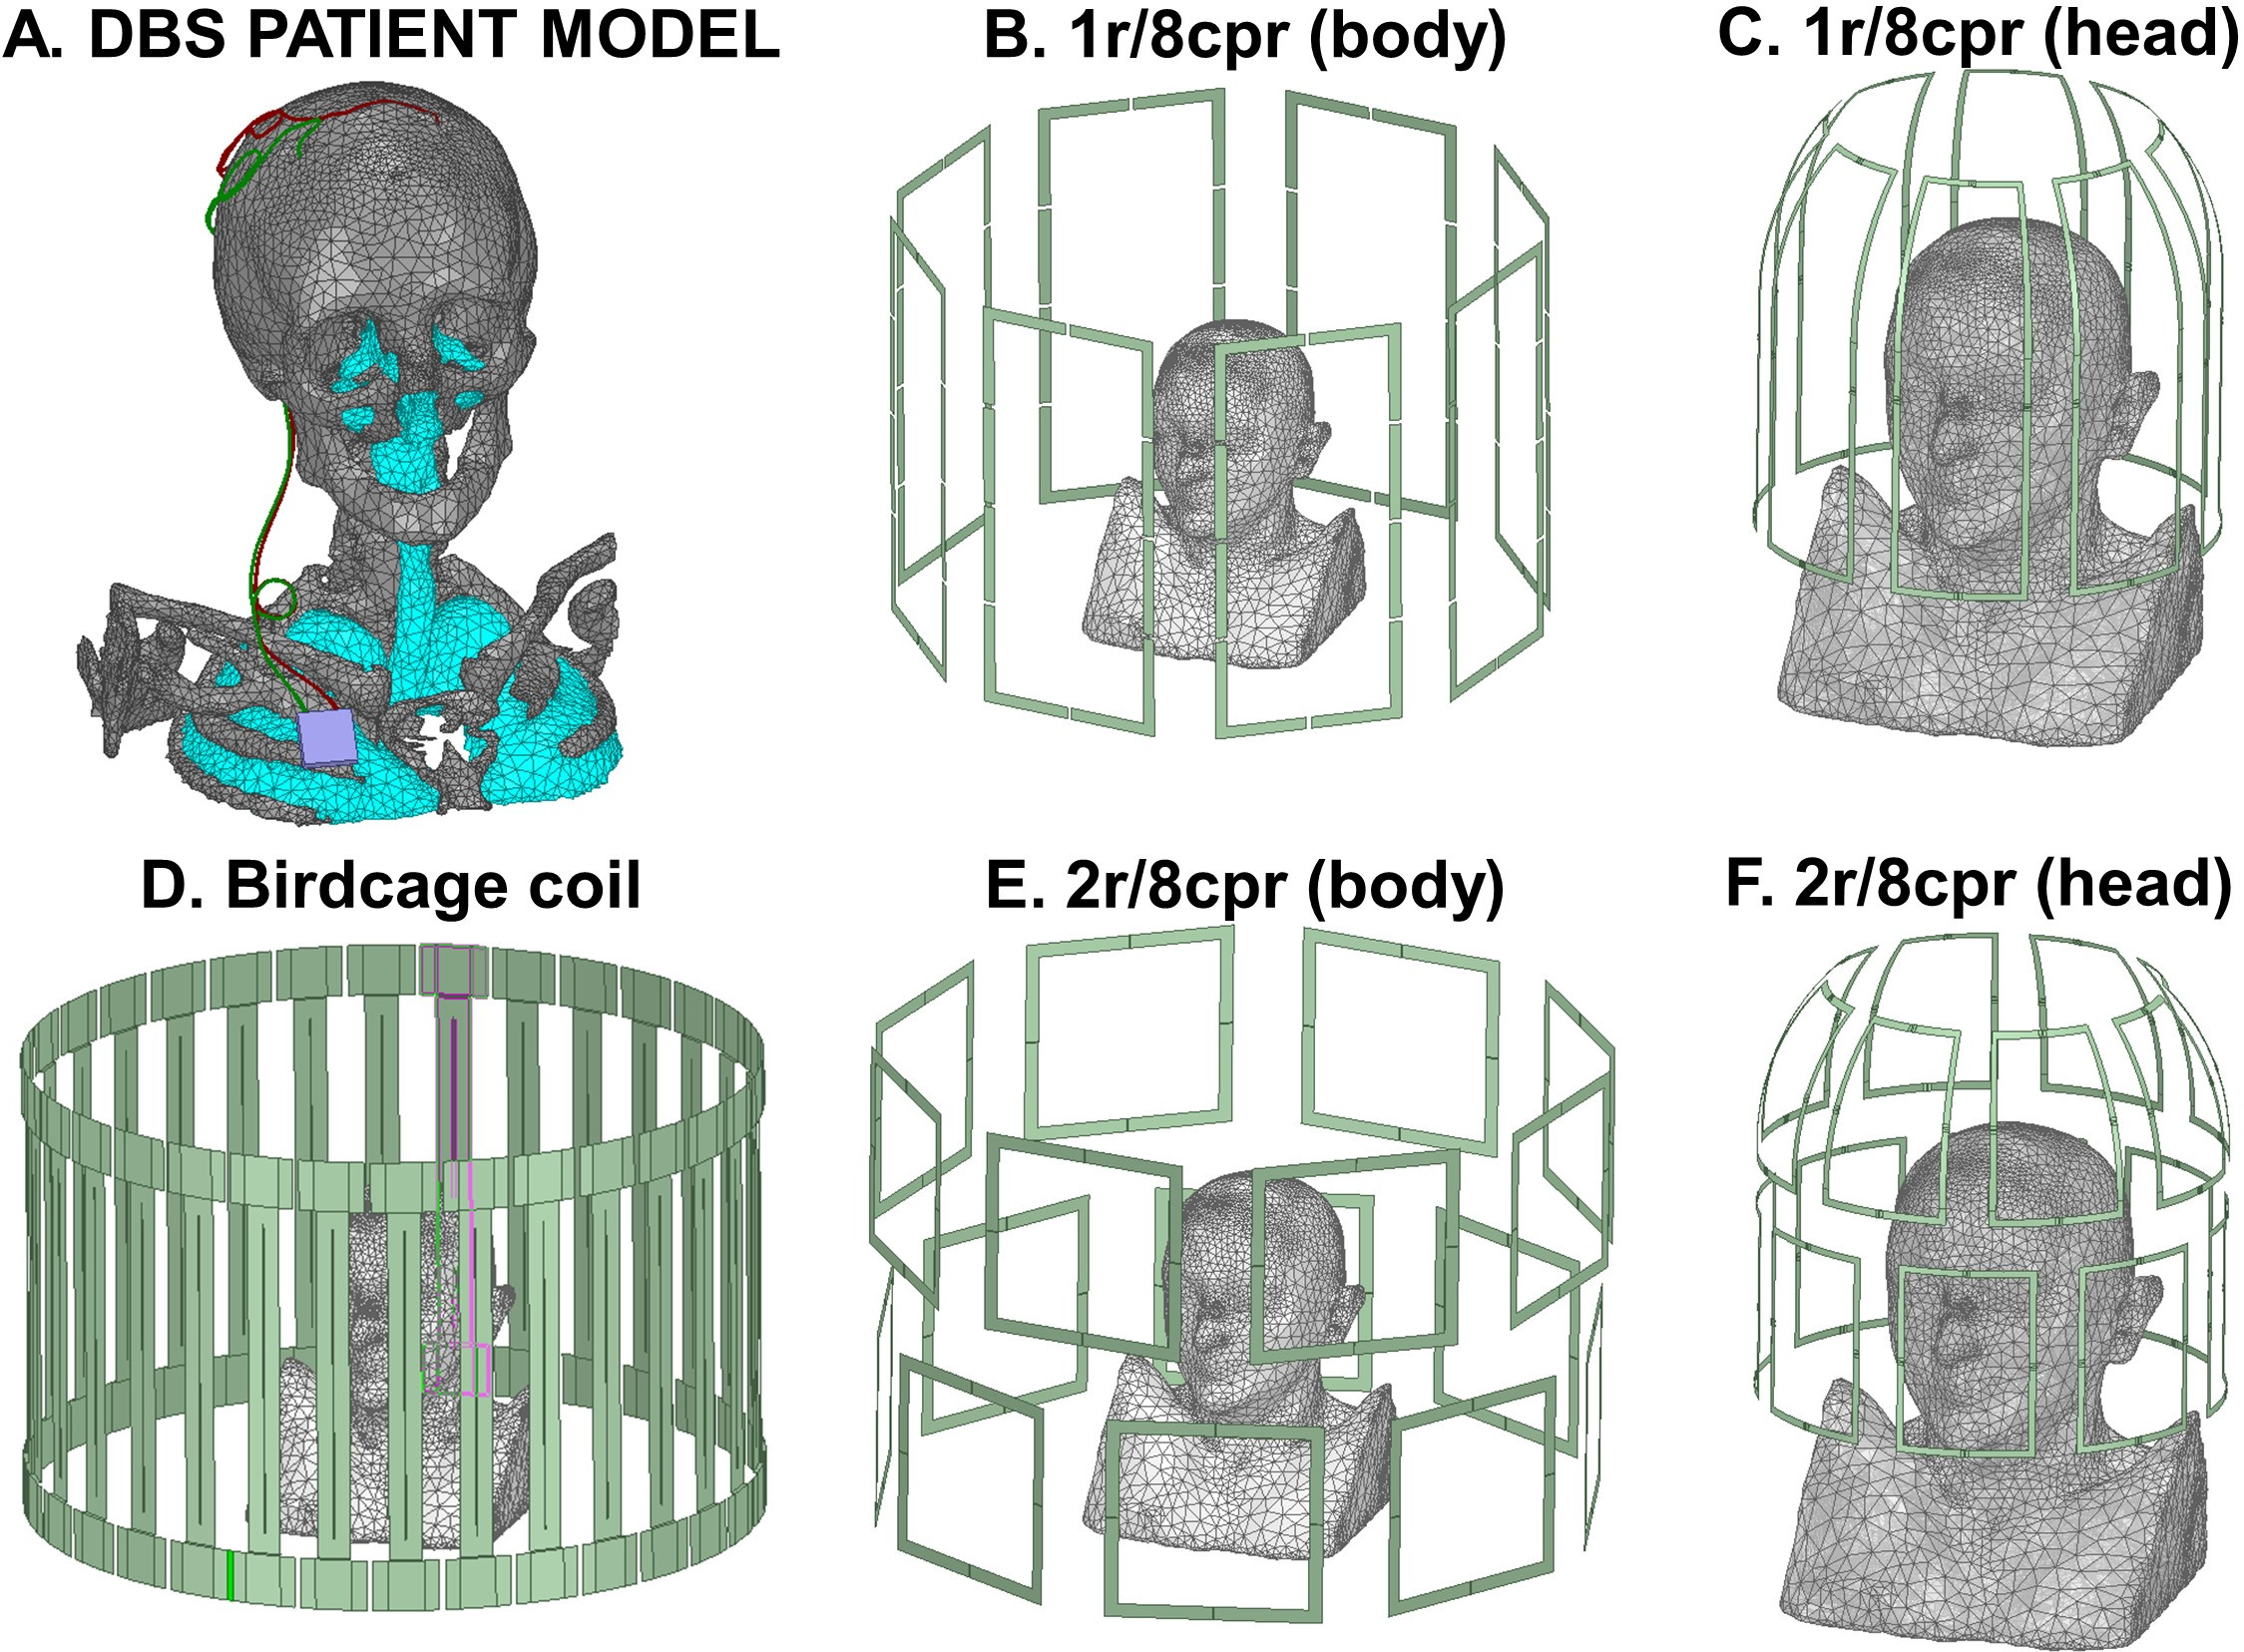
Fig. 1. A: Surface mesh model of the DBS
patient simulated. B-F: Coils modeled. The birdcage coil (BC) is driven in quadrature
and as a pTx coil with two channels, whereby the two quadrature ports are
driven independently. The notation Xr/Ycpr indicate a pTx coil with X rows and
Y coils per row.
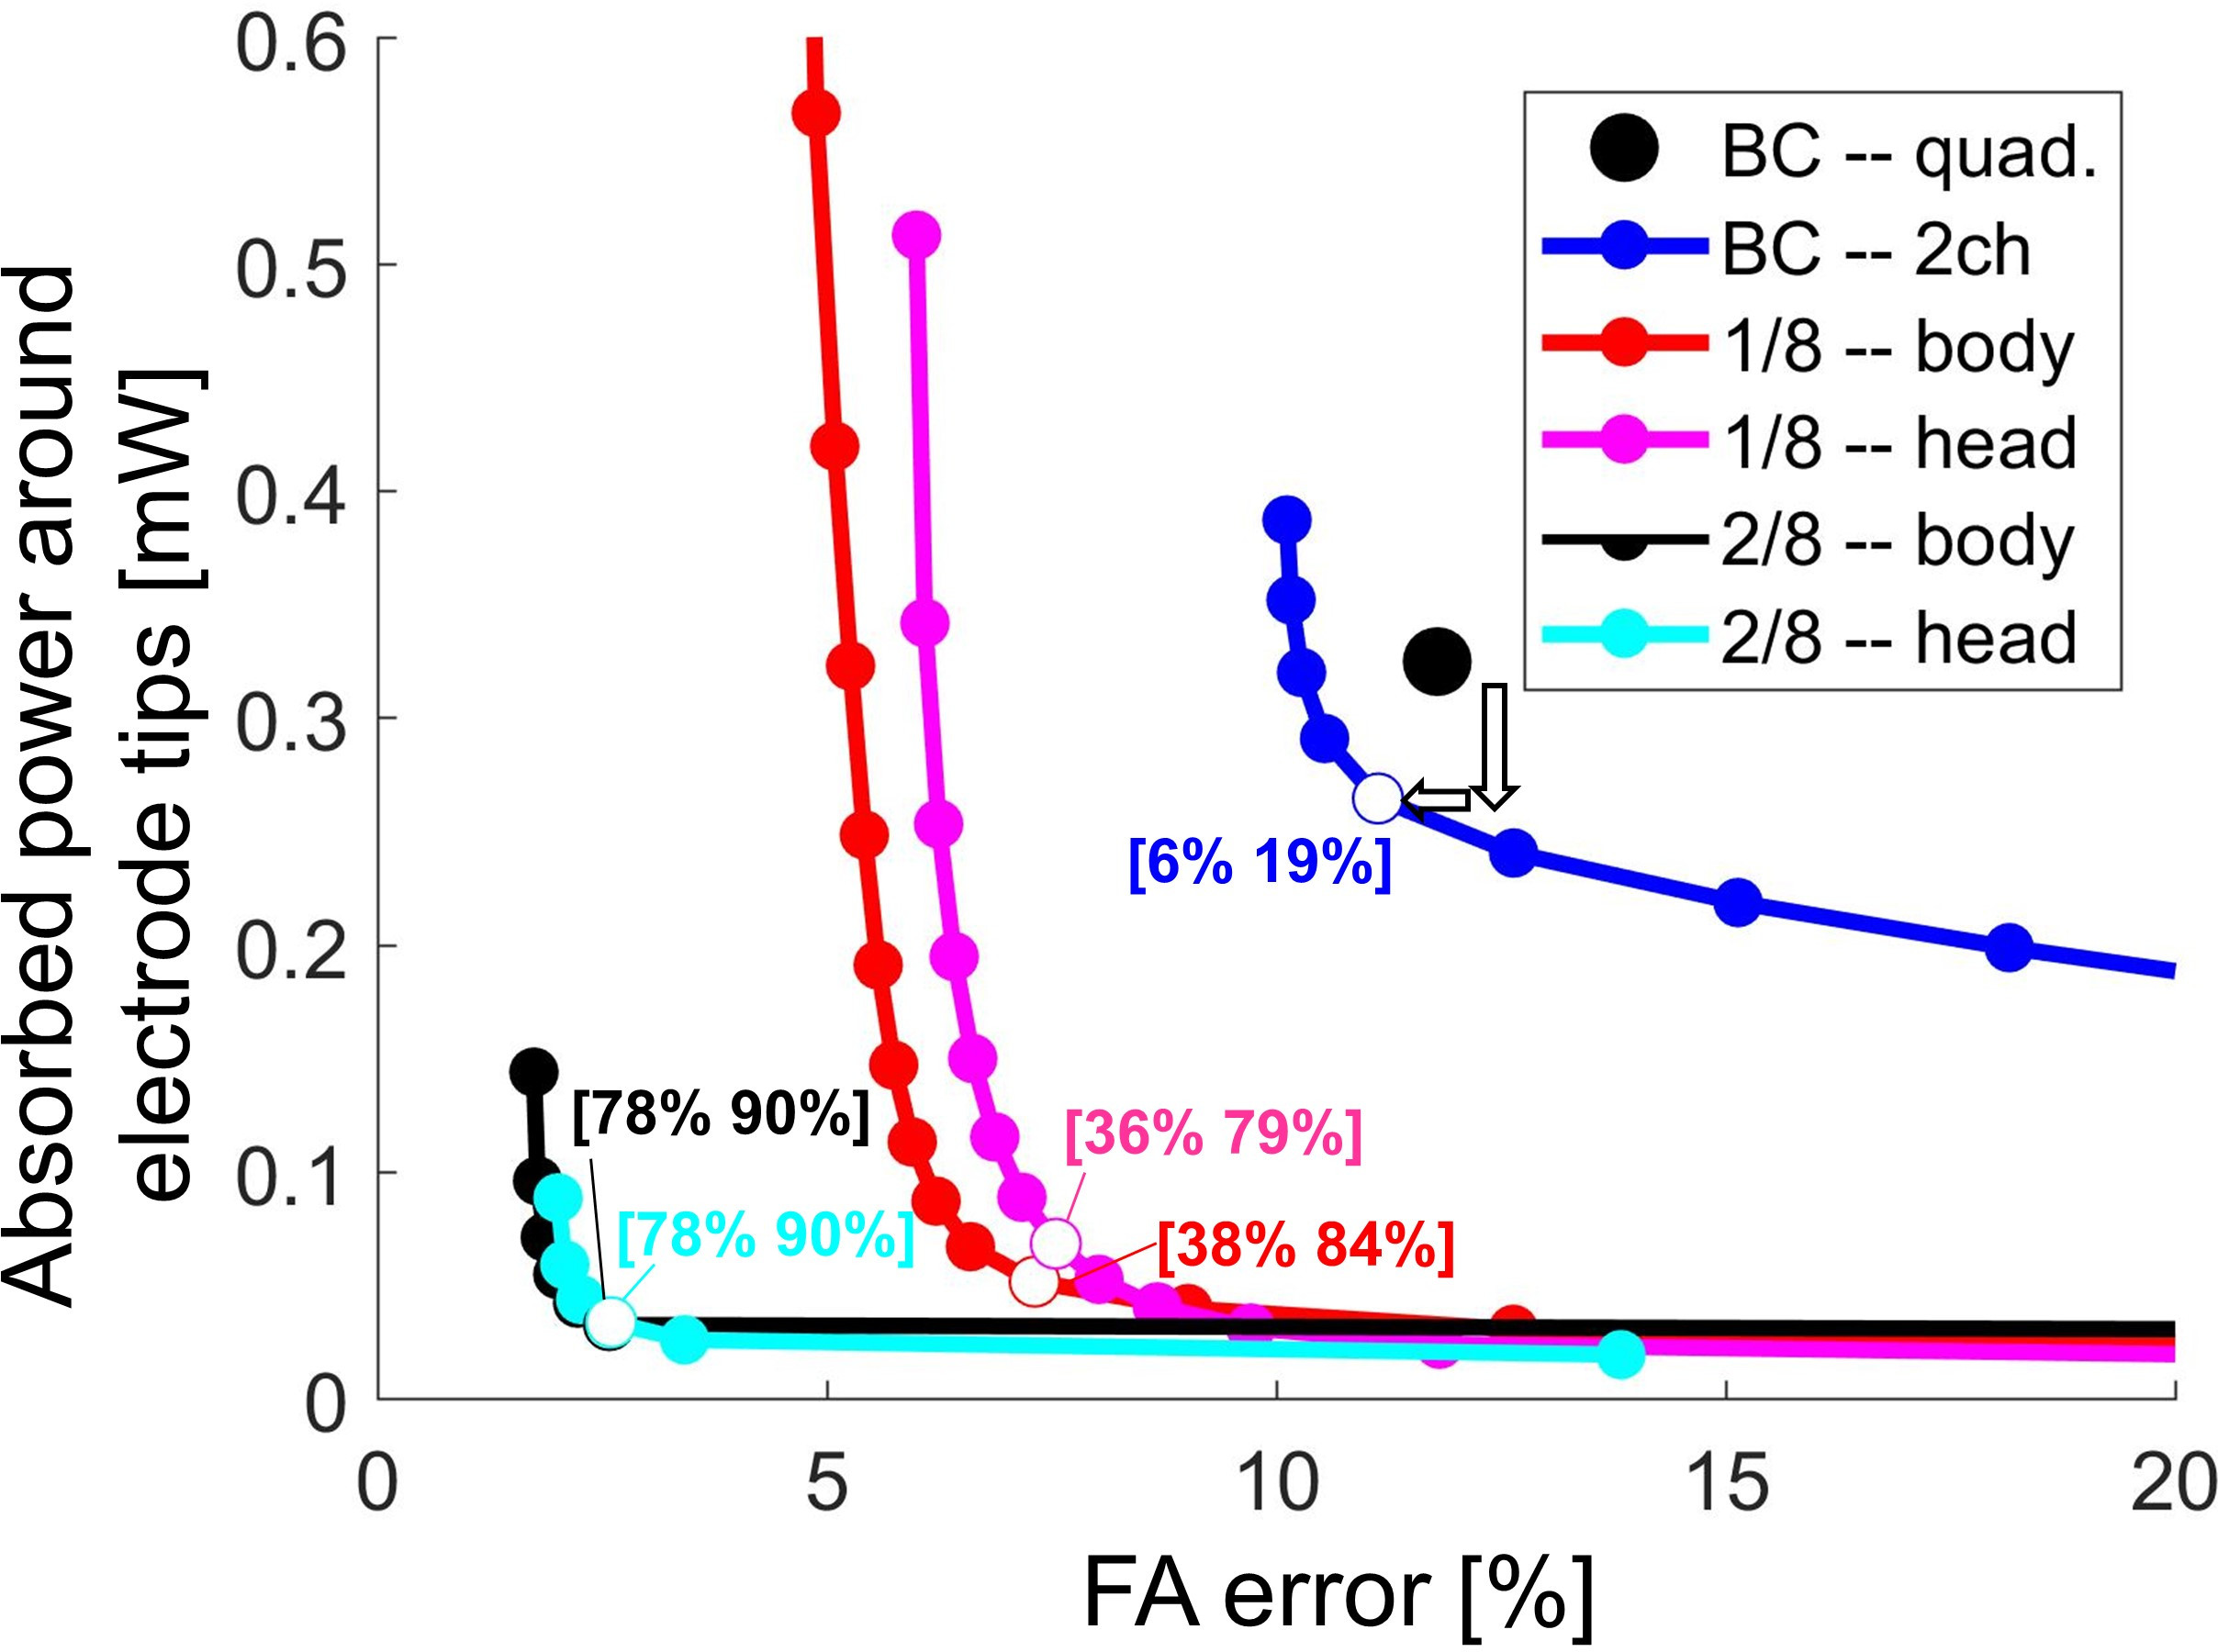
Fig. 2: Continuous tradeoff (L-curve) between the
flip-angle (FA) error and the power absorbed in tissues surrounding the DBS
electrode tips (in Watts). Open circle symbols indicate the operating points
corresponding to the best FA/power tradeoff for each coil. The numbers in
square brackets indicate, for each coil, the reduction of FA error and absorbed
power compared to the BC driven in quadrature mode. For example, the blue
numbers [6% 19%] mean that BC-2ch has a FA error and absorbed DBS-tip power 6% and
19% smaller than BC-quad, respectively.
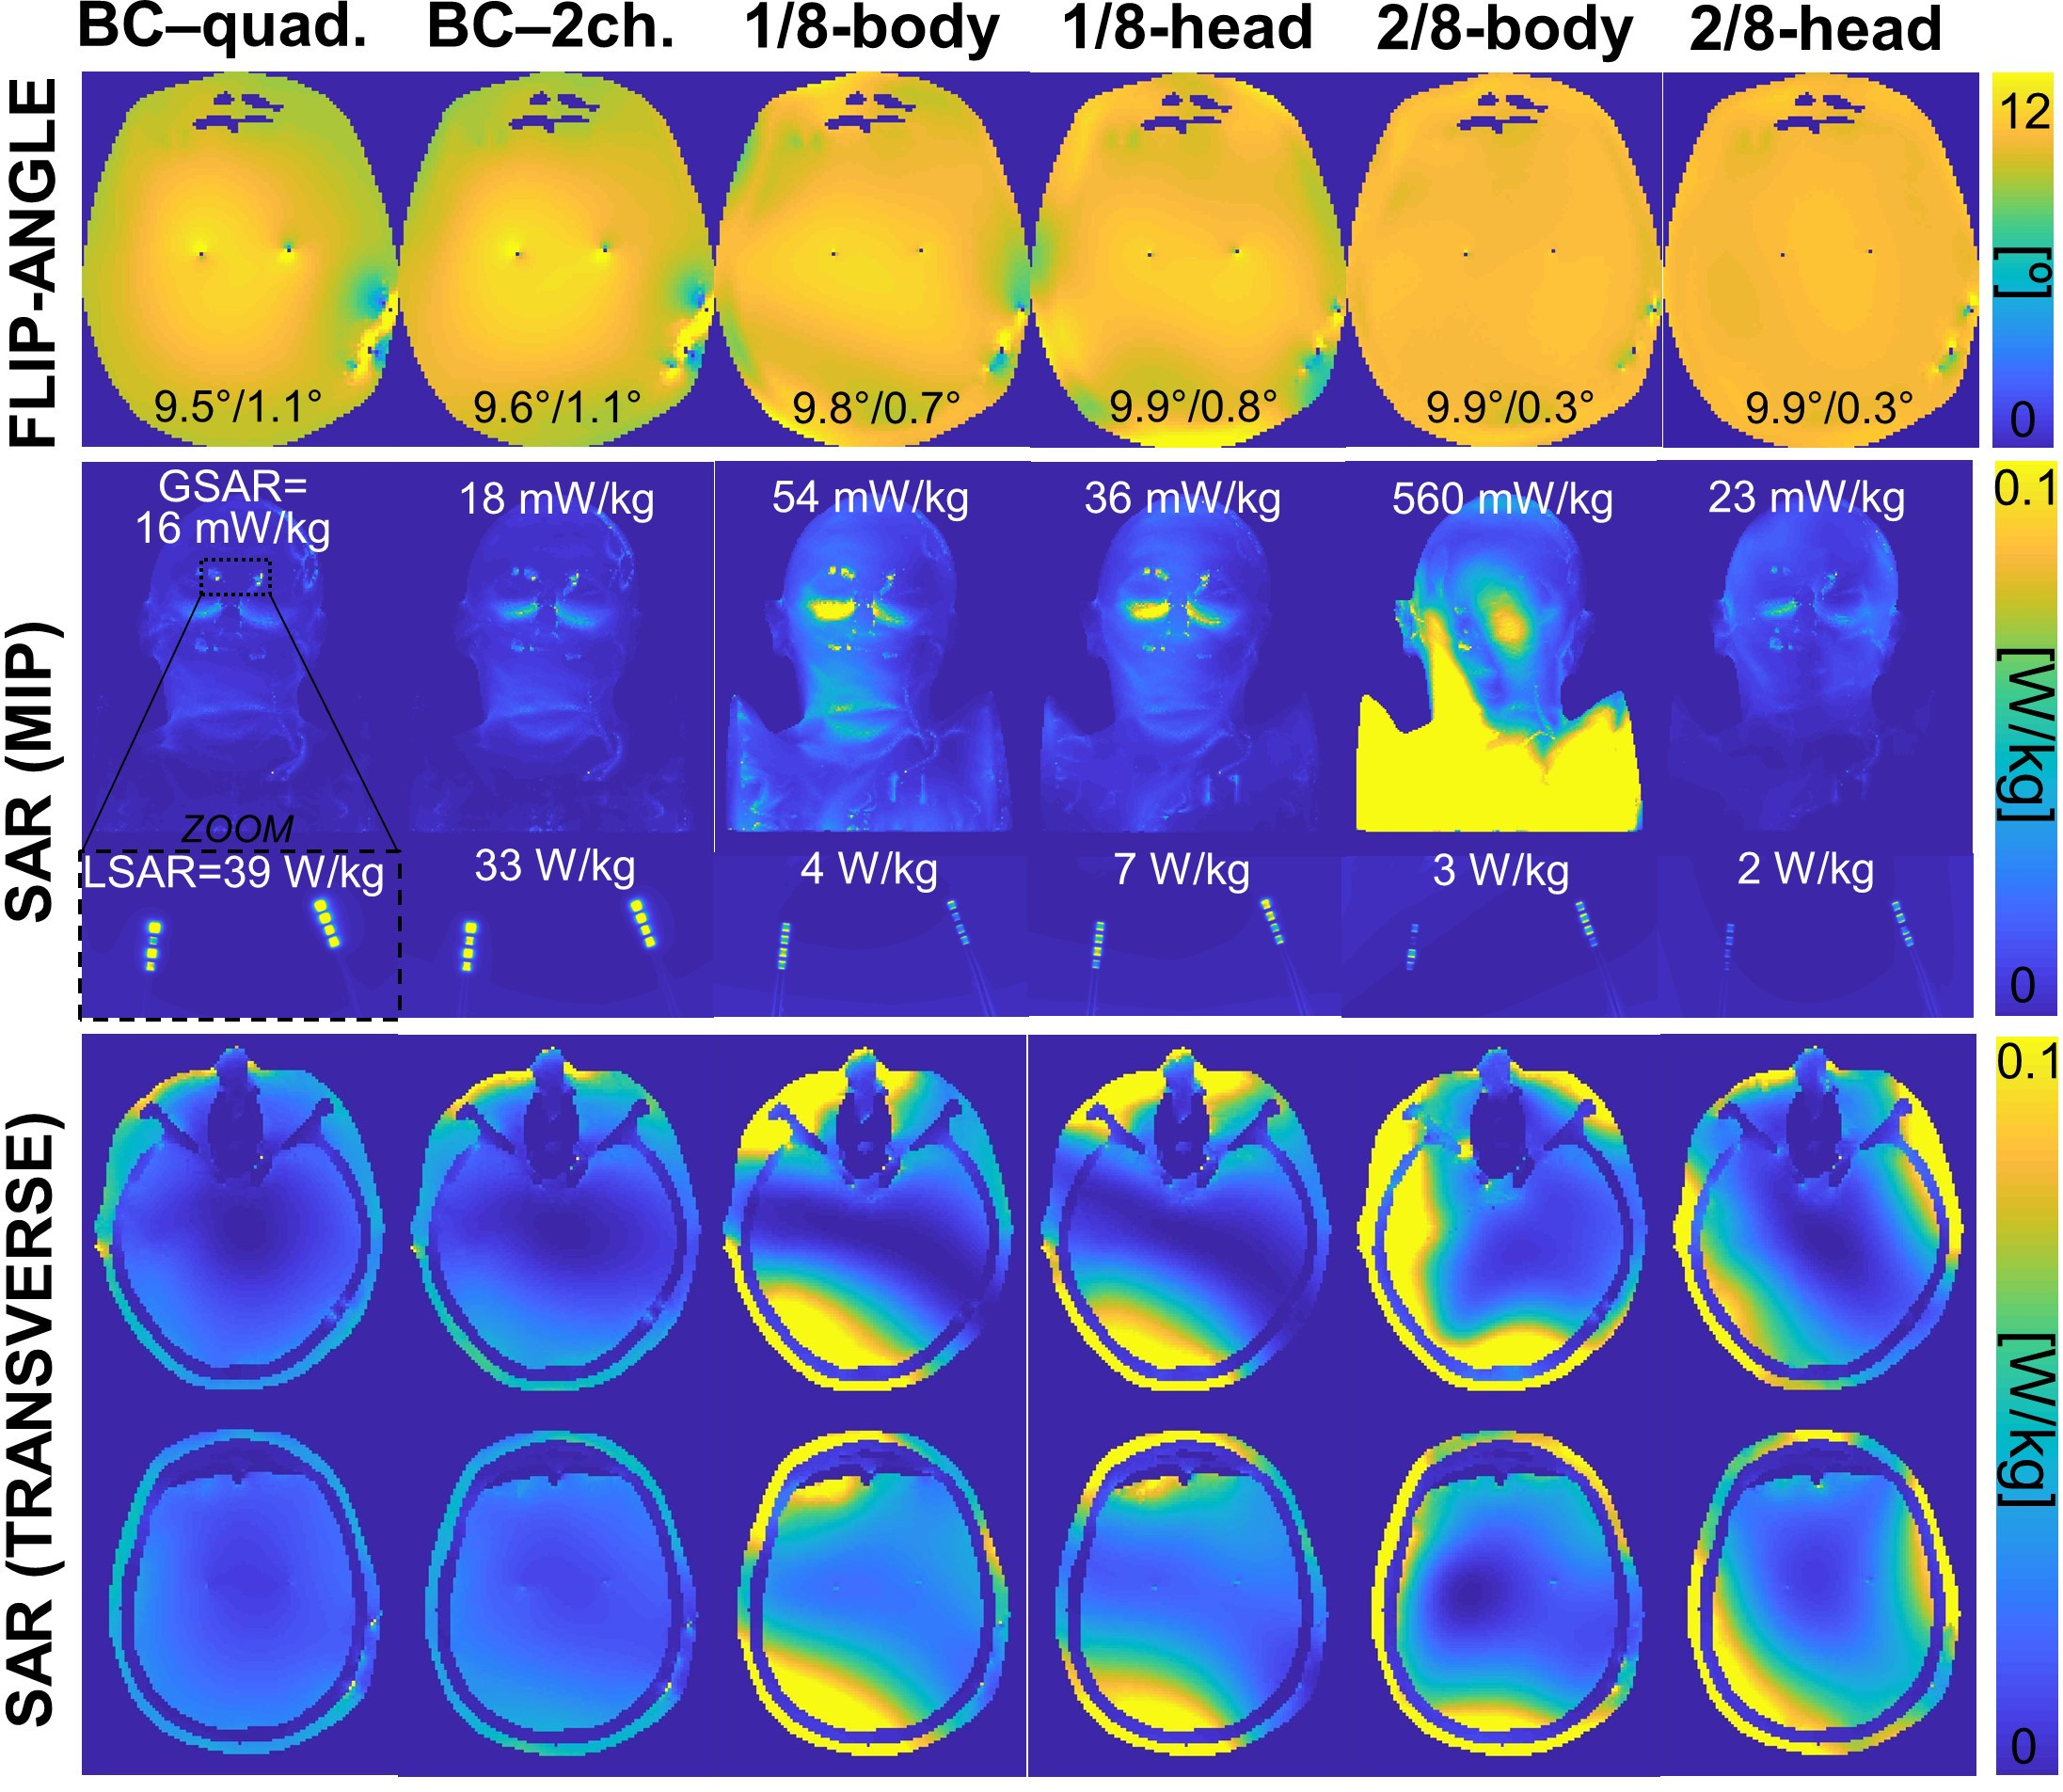
Fig. 3: TOP ROW: Flip-angle maps generated by
the different coils at the operating points shown in Fig. 2 (target is 10°). The
two numbers at the bottom of the FA maps indicate the FA mean and standard within
the mask. MIDDLE ROW: Maximum intensity projection of the un-averaged SAR maps in
the entire head (resolution 1.7 mm) as well as zoomed over the electrode tip
region (resolution 0.1 mm). GSAR and LSAR mean “global SAR” and “local SAR”.
BOTTOM ROW: Transverse slices of 1.7 mm, un-averaged SAR maps.
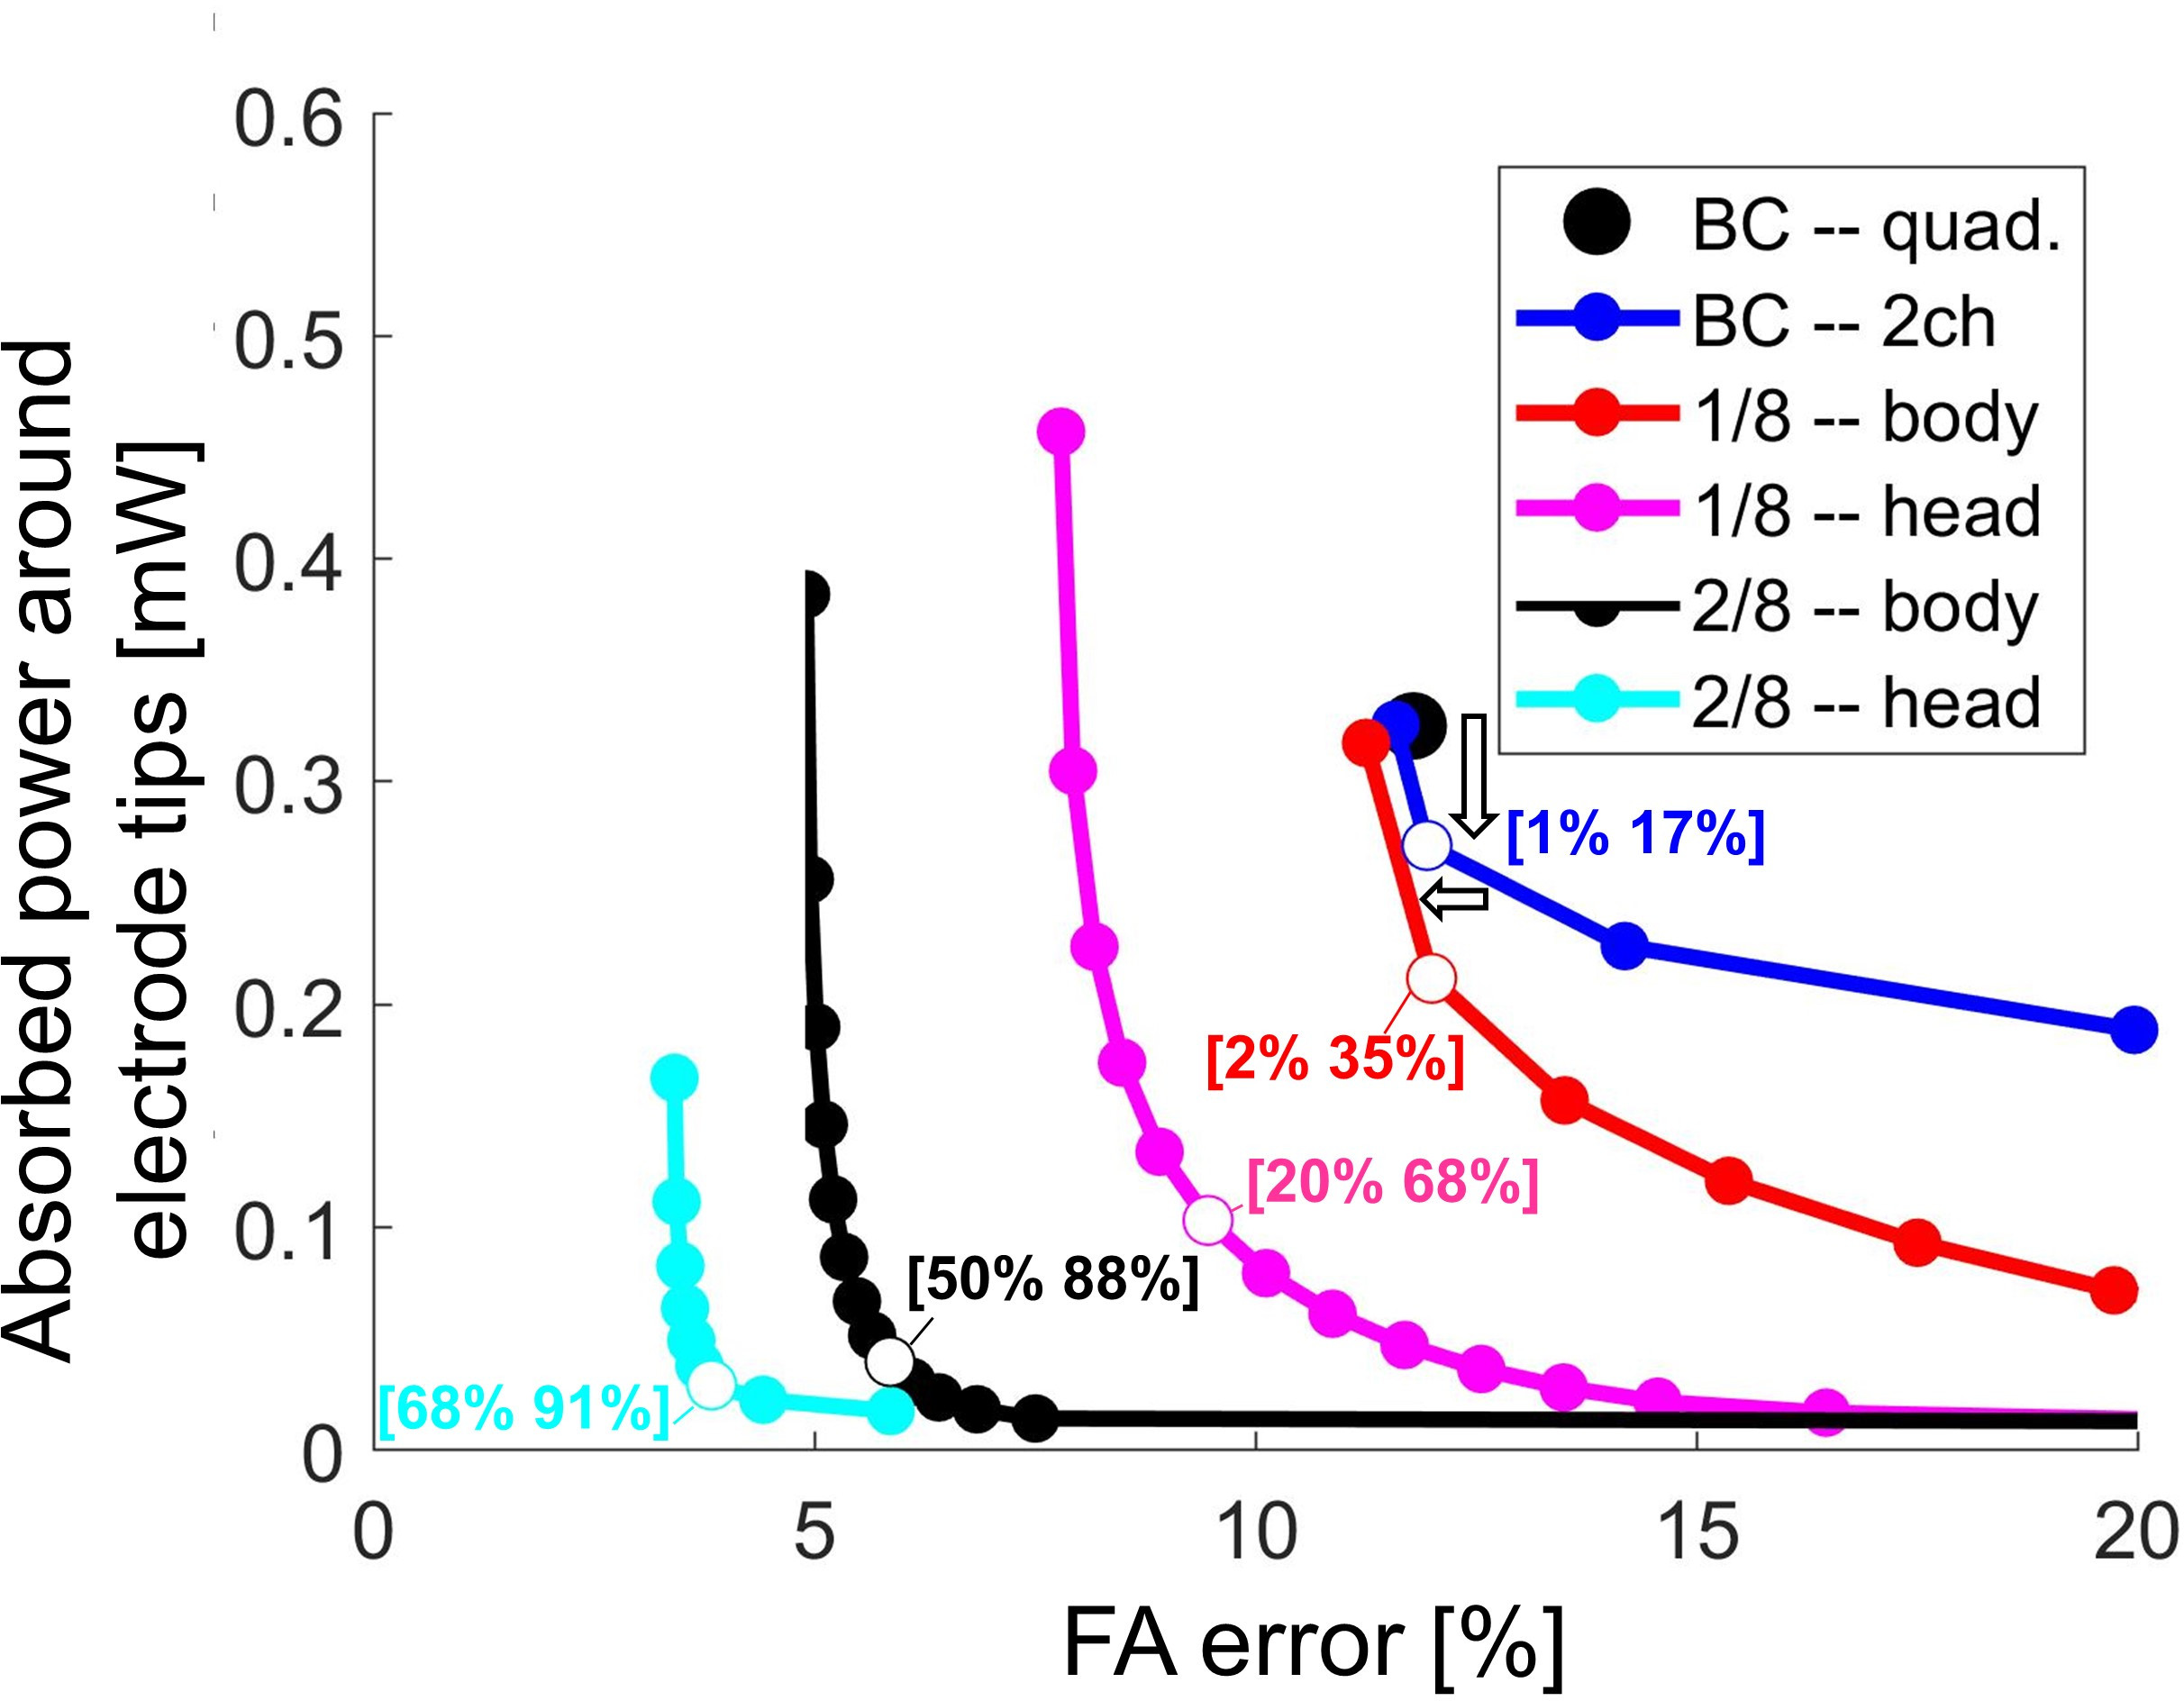
Fig. 4: Continuous tradeoff (L-curve) between
the flip-angle (FA) error and the power absorbed in tissues surrounding the DBS
electrode tips (in Watts). Open circle symbols indicate the operating points
corresponding to the best FA/power tradeoff for each coil. The numbers in
square brackets indicate, for each coil, the reduction of FA error and absorbed
power compared to the BC driven in quadrature mode. Pulses on this L-curve are
similar to those of Fig. 2 except that, in addition to APAET, global SAR was constrained
(to the value generated by BC-quad).
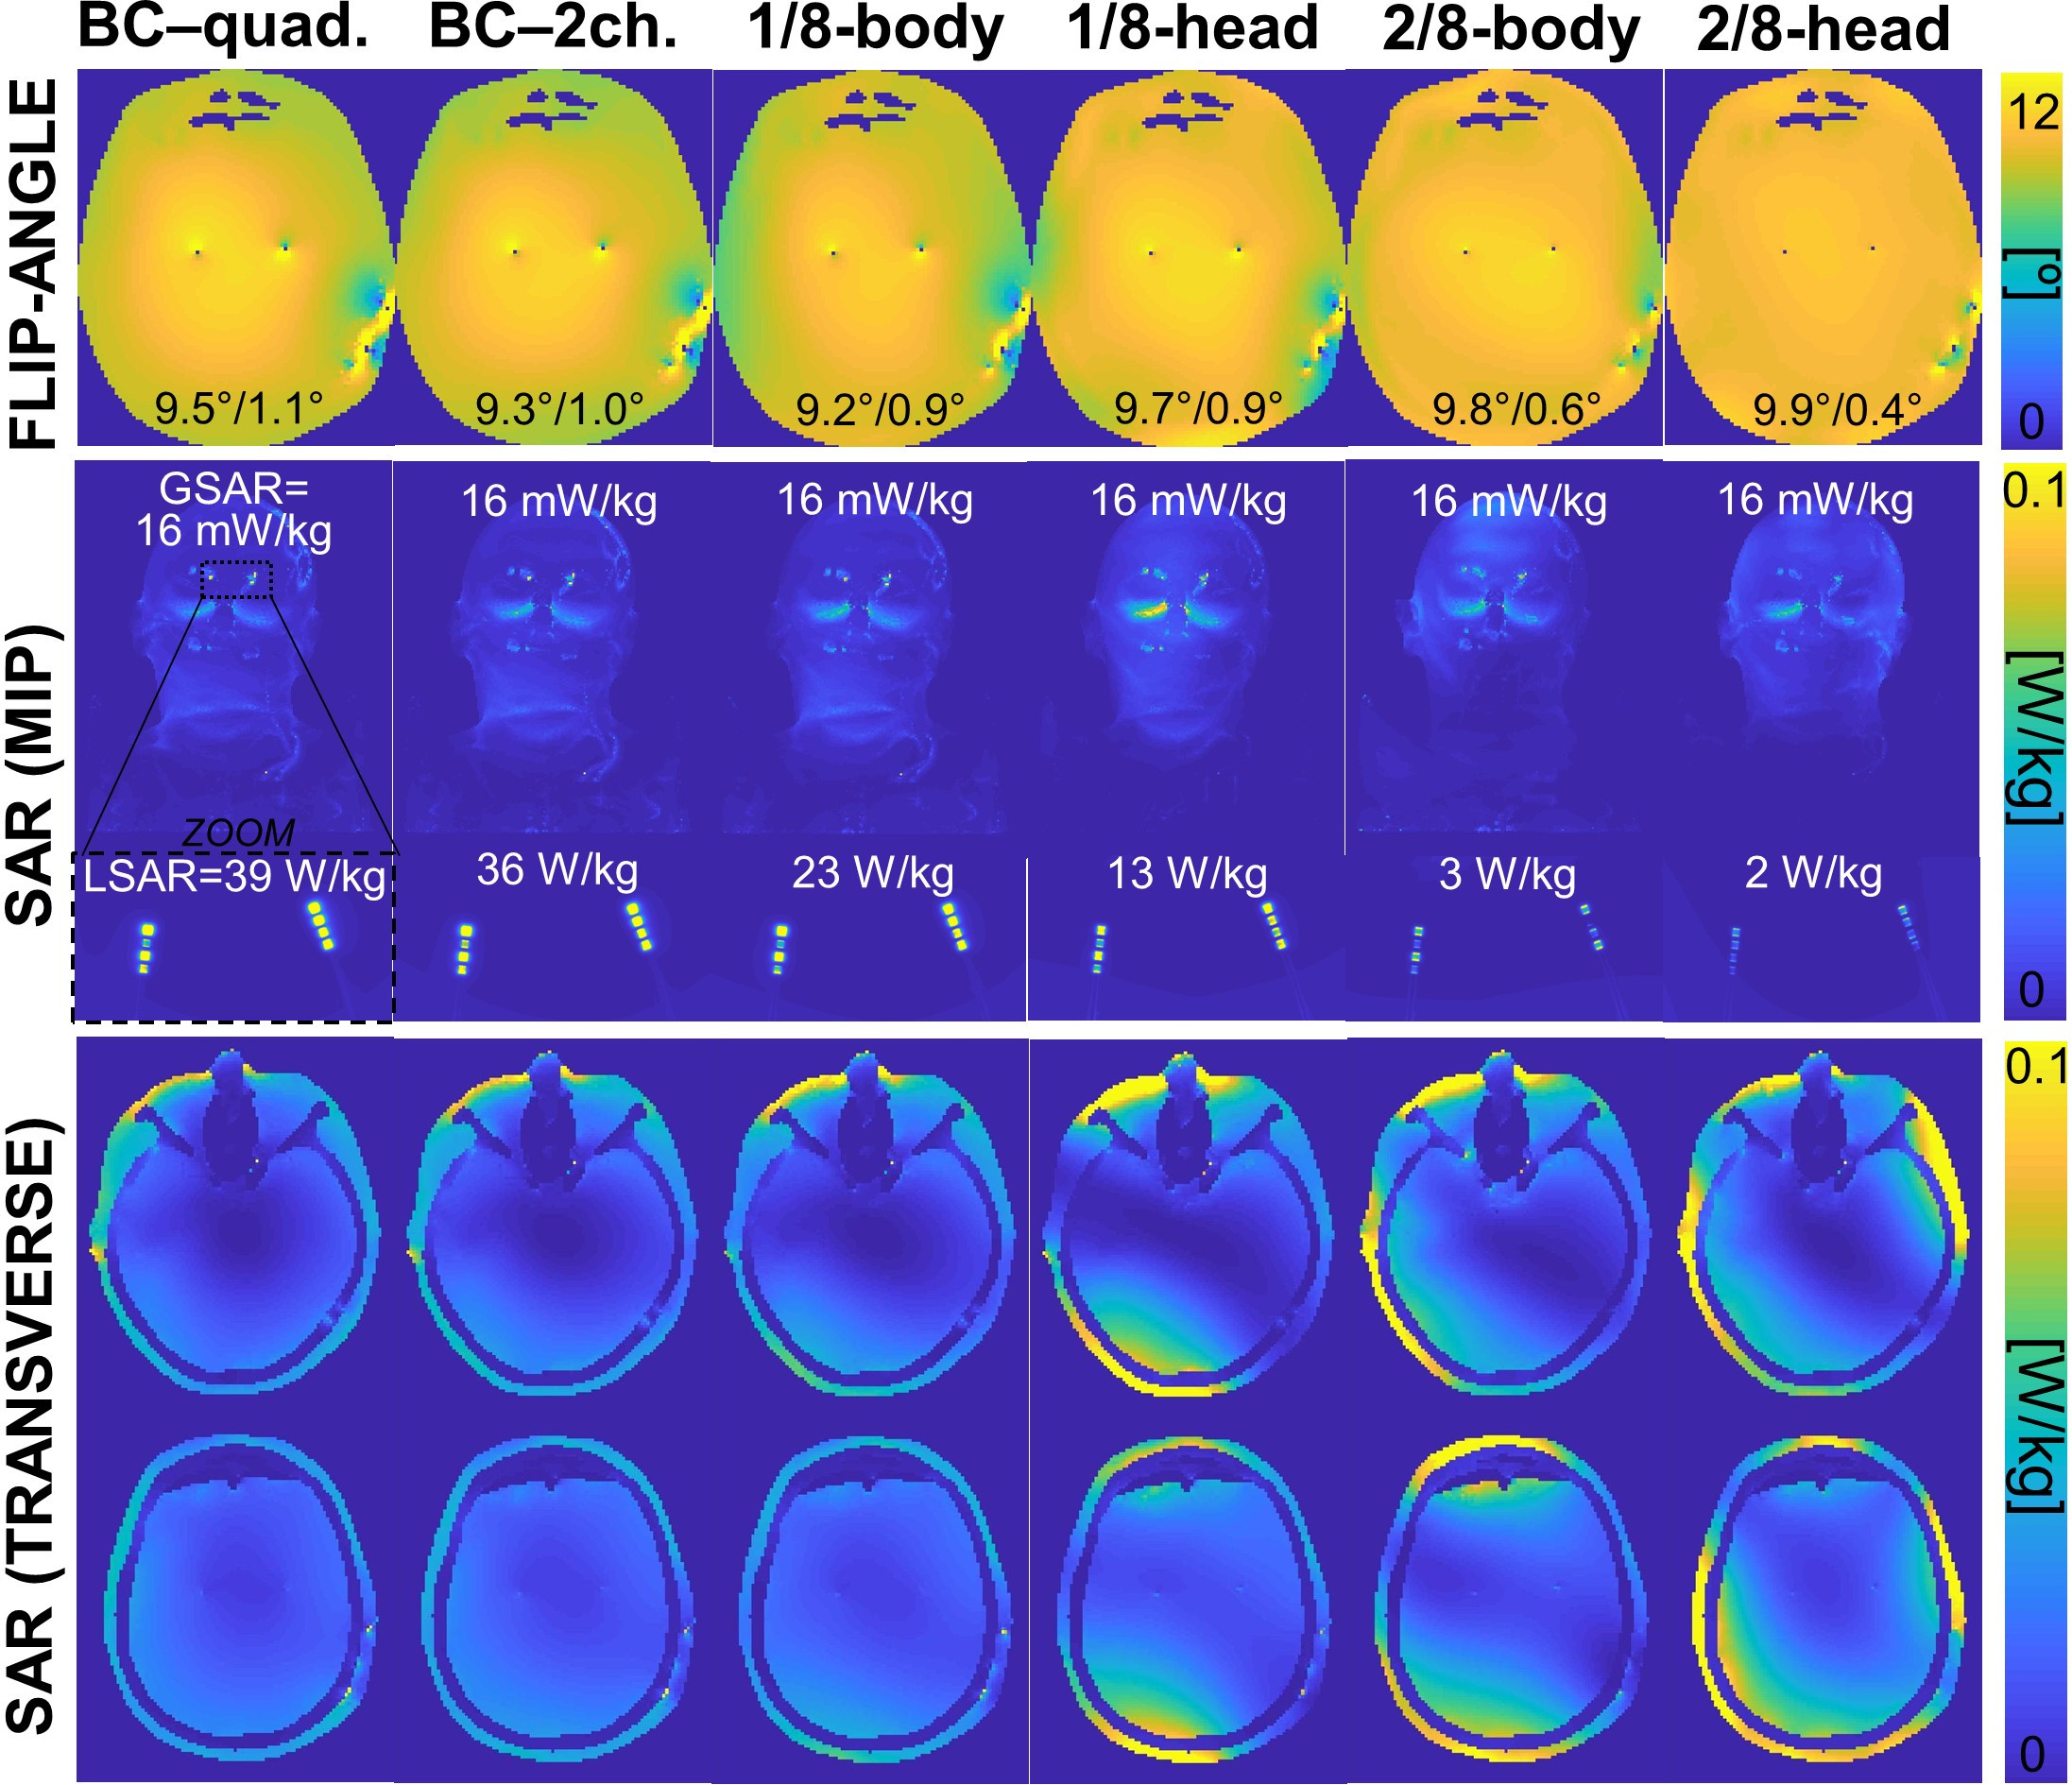
Fig. 5: TOP ROW: Flip-angle maps generated by
the different coils at the operating points shown in Fig. 2 (target is 10°).
The two numbers at the bottom of the FA maps indicate the FA mean and standard
within the mask. MIDDLE ROW: Maximum intensity projection of the un-averaged
SAR maps in the entire head (resolution 1.7 mm) as well as zoomed over the
electrode tip region (resolution 0.1 mm). GSAR and LSAR mean “global SAR” and
“local SAR”. Note that GSAR is constant for all pulses and coils. BOTTOM ROW:
Transverse slices of 1.7 mm, un-averaged SAR maps.