0293
On-line Subject-Specific Local SAR Assessment by Deep Learning1Center for Image Sciences, University Medical Center Utrecht, Utrecht, Netherlands, 2MR Code BV, Zaltbommel, Netherlands, 3Biomedical Image Analysis, Eindhoven University of Technology, Eindhoven, Netherlands
Synopsis
One of the most critical aspects that limits the application of ultra-high field MRI is the local Specific Absorption Rate (SAR) evaluation. The key aspect is that local SAR information could only be obtained by off-line simulation using generic body models, which hardly match with the patient's body and positioning. In this work we present a first deep learning approach for local SAR assessment. Results, show that the relation between local SAR on the one hand and MR Dixon images and B1-field maps on the other hand, can be accurately and instantaneously mapped by a Convolutional Neural Network (CNN).
Purpose
Determination of Local Specific Absorption Rate (SAR) is a critical aspect that limits use of (multi-transmit) UHF MRI. Local SAR is typically determined by off-line electromagnetic simulations and processed into Q-Matrices1 and Virtual Observation Points (VOPs)2 to allow on-line local SAR assessment. For simulations usually generic body models are used, which rarely match the body of the patient under examination. Typically, this uncertainty is mitigated by conservative safety factors constraining imaging parameters, e.g. lengthy scanning. Recently, methods based on deep learning techniques, which utilize convolutional neural networks (CNNs), were presented for biomedical applications3,4,5. To our knowledge, we present the first deep learning approach for fast subject-specific local SAR assessment. We show that it is possible to train CNNs to map the relation between local SAR and some quickly acquired MR data, allowing subject-specific local SAR estimation.Material and Methods
Setup and Dataset
By means of our database of 23 subject-specific models6 with a 8-fractionated dipole array for prostate imaging at 7T7, we have generated 5750 images sets (using 250x23 random phase settings with uniform amplitudes). These correspond to 5750 unique SAR and B1+ distributions. For each set, the corresponding Water-Fat image (Dixon reconstruction) and the simulated (Sim4Life,ZurichMedTech,Switzerland) B1+ distribution serve as an input to generate the local SAR distribution. The water-fat images were acquired in an earlier study6 and obtained at 1.5T. The B1+ phase of one channel is subtracted from the B1+ phase of the dataset to provide a relative phase distribution that can be realistically acquired. We have trained our CNN for the mid-plane 2D slice where the antenna feeds are located and the maximum local SAR is expected. The actual SAR distribution for each set is used for training or validation (ground-truth) given the input maps (i.e. Water-fat images, real and imaginary B1+ distributions)(Figure 1).
Network Architectures and Cost Functions
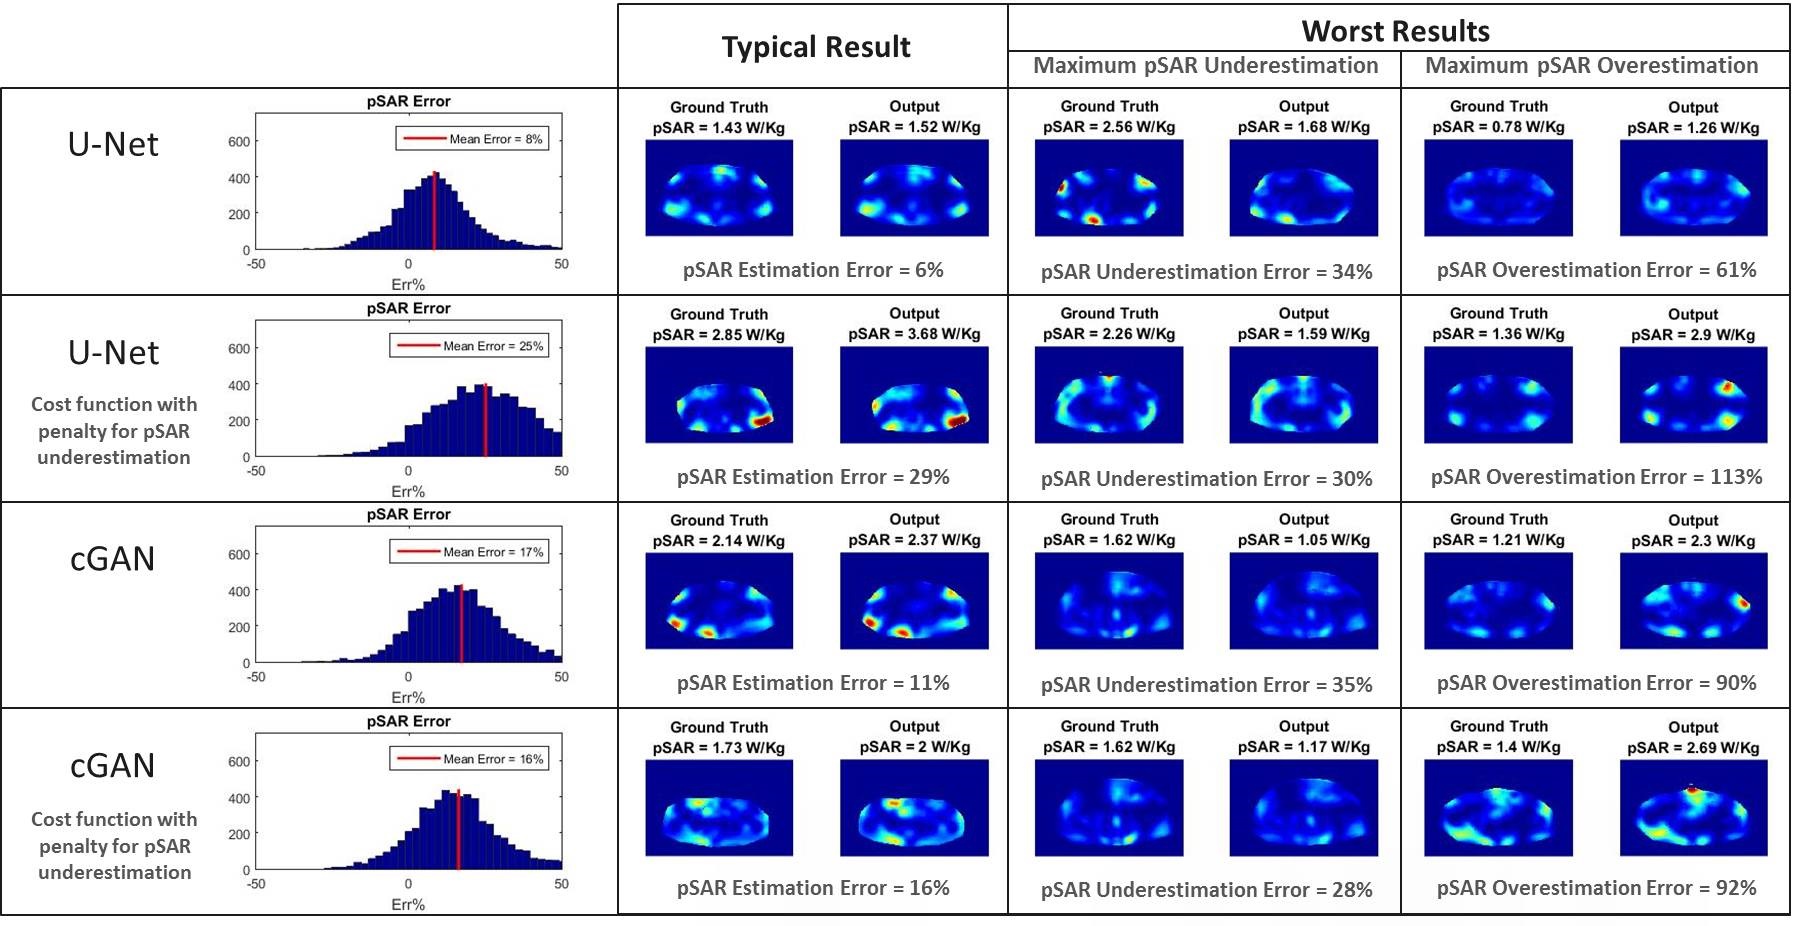
The best network architecture and most suitable cost function for training are still under investigation. We present results using two different CNN architectures:
- U-Net3.
- Conditional Generative Adversarial Networks (cGAN)8 with U-Net generator.
Voxels with high local SAR required higher accuracy. Accordingly, we have trained our U-Net to minimize a weighted L1 distance between the ground-truth and the output $$$\mathcal{L}_{WL1}$$$ (weights proportional to the ground-truth).
$$\mathcal{L}_{WL1}=\sum_{i=1}^{N_{\text{pixel}}}w_i\left|\text{ground-truth}_i-\text{output}_i\right|$$
Moreover, to reduce the peak local SAR (pSAR) underestimation, the optional use of an additional loss term $$$\mathcal{L}_{Peak}$$$ was evaluated.
$$\mathcal{L}_{\text{Peak}}=\max(0,\max(\text{ground-truth})-\max(\text{output}))$$
Likewise, the cGAN objective $$$\mathcal{L}_{cGAN}$$$ was mixed with the $$$\mathcal{L}_{WL1}$$$, and the optional use of $$$\mathcal{L}_{Peak}$$$ was evaluated.
$$\mathcal{L}=\arg\min_{G}\max_{D}\mathcal{L}_{\text{cGAN}}(G,D)+\lambda_{WL1}\mathcal{L}_{WL1}(G)+\lambda_{\text{Peak}}\mathcal{L}_{\text{Peak}}(G)$$
Training and Validation
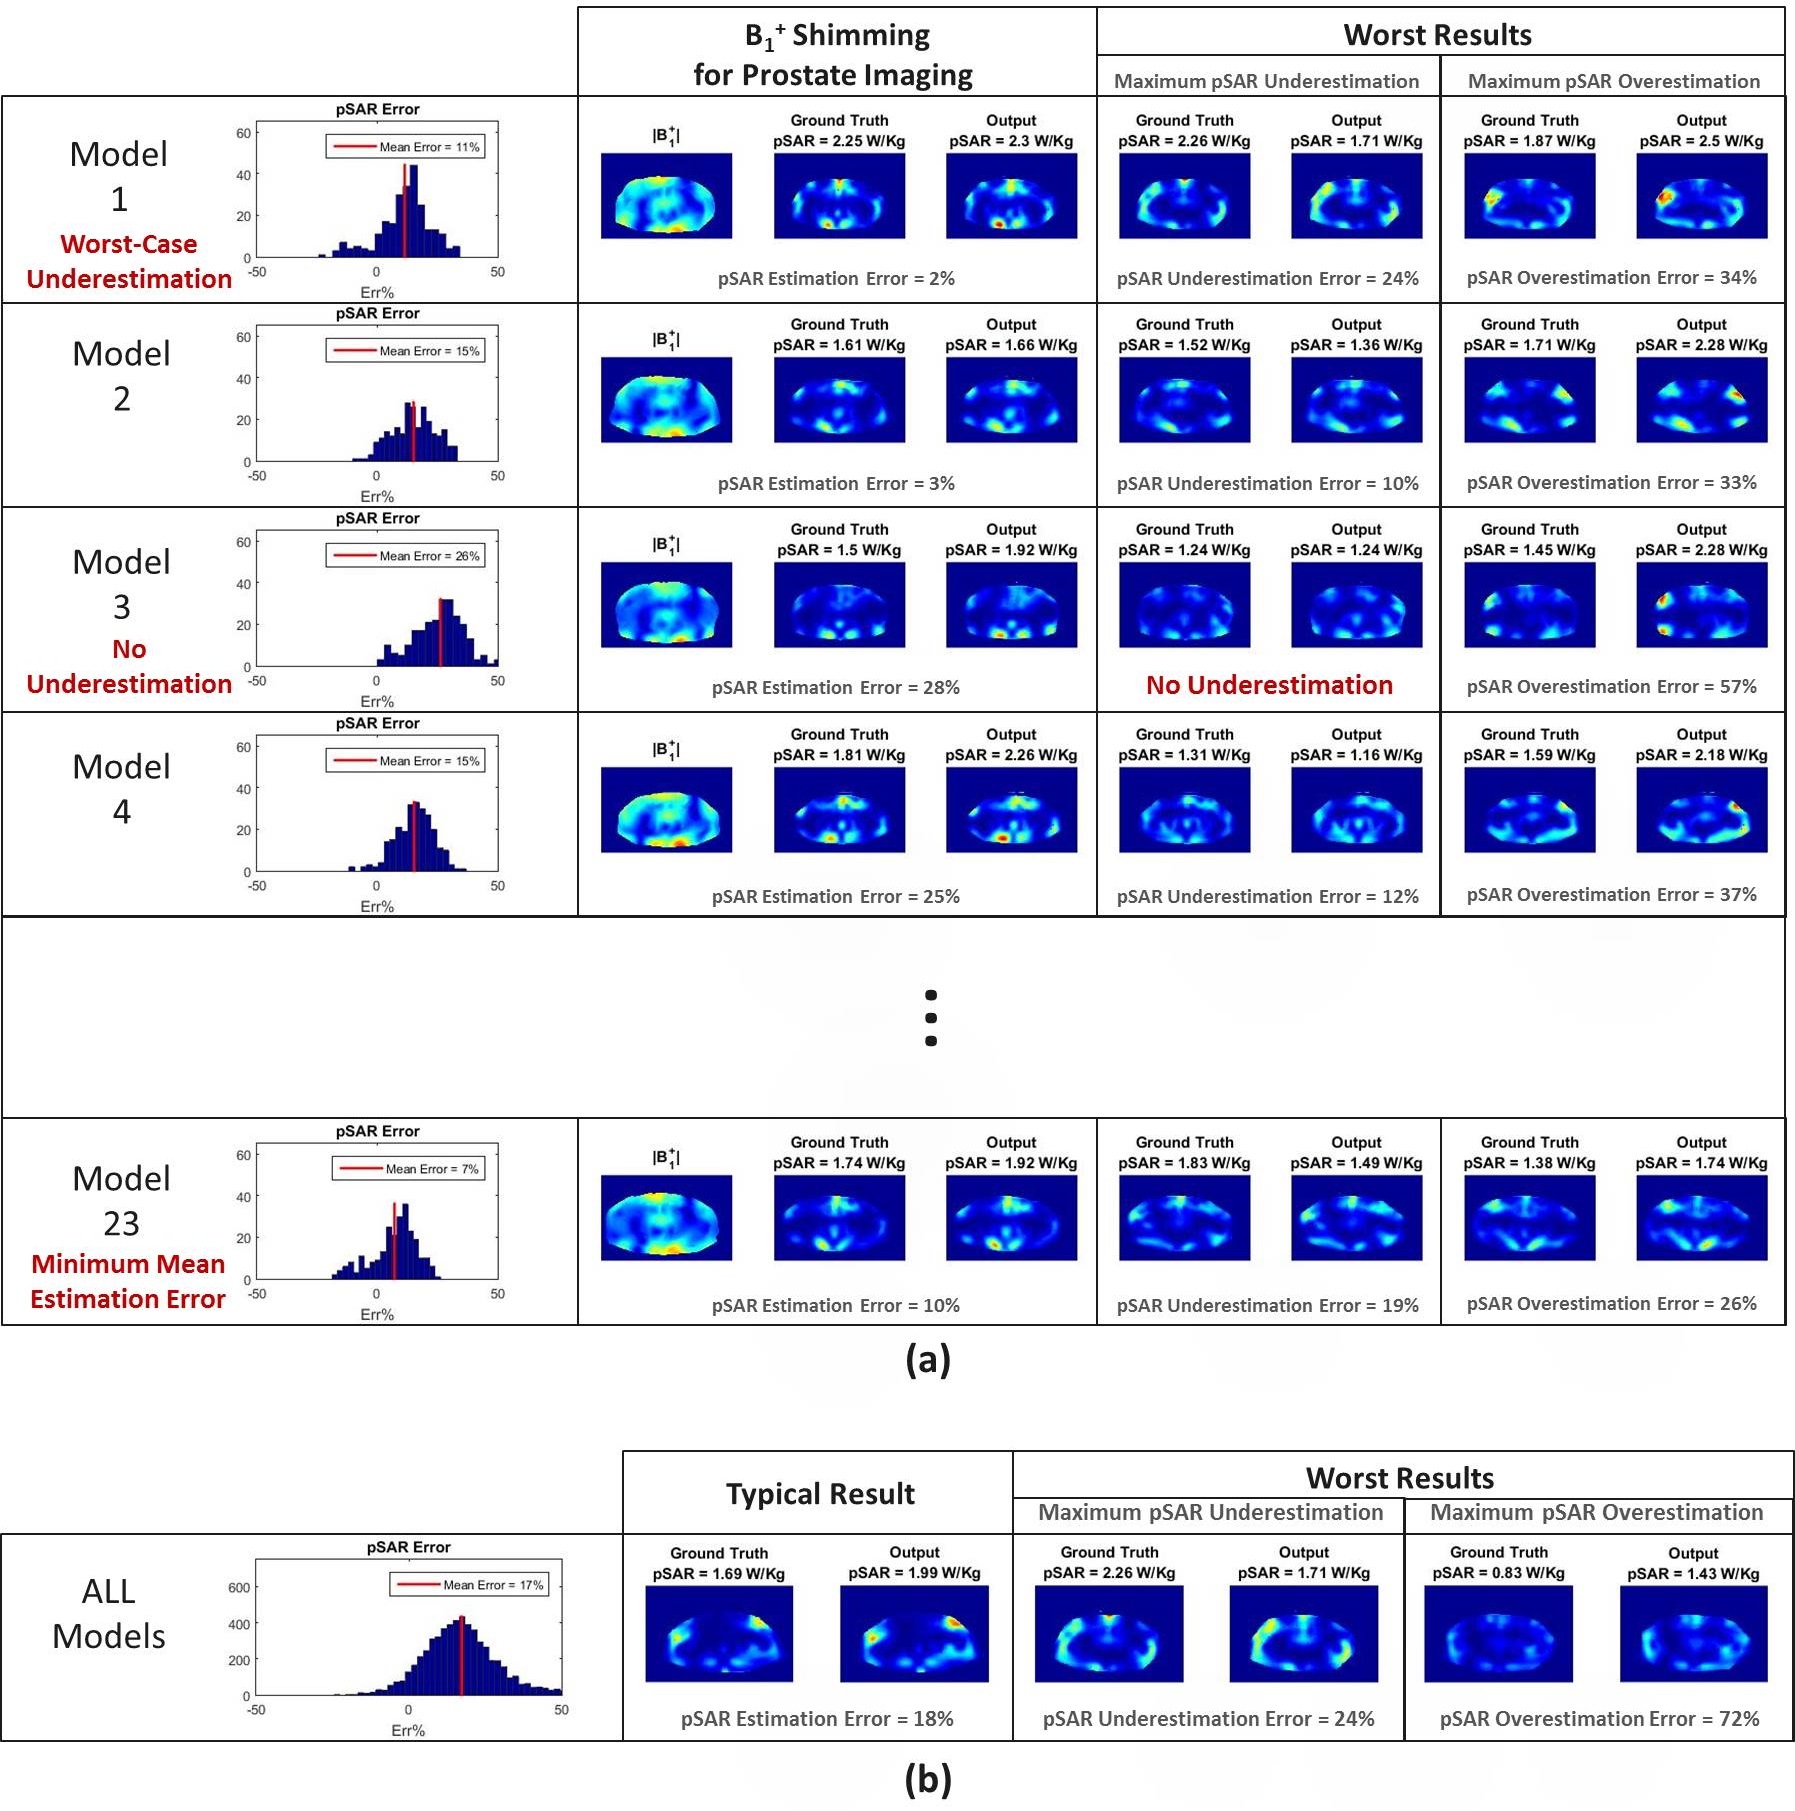
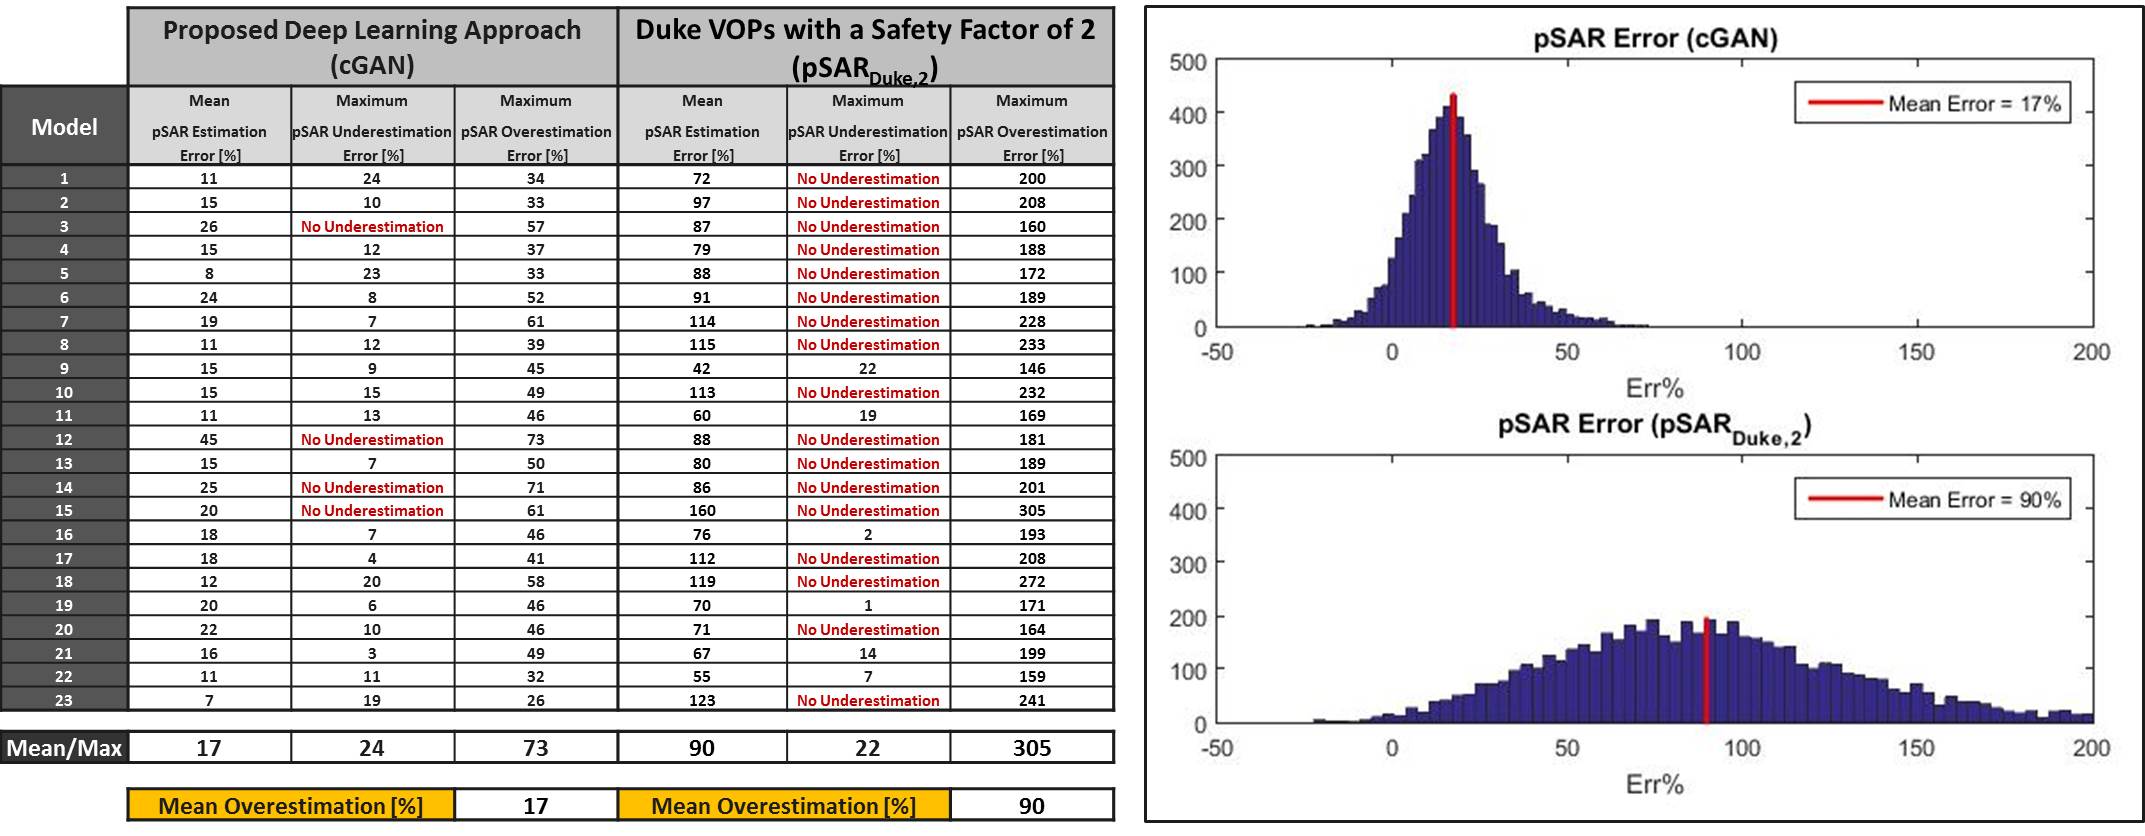
To evaluate the robustness of this approach and identify the best setting (CNN and cost function), the dataset was partitioned into 3 sub-datasets according to the models that have generated the images and a 3-Fold Cross-Validation was performed. Afterwards, the achievable performance using the best settings was assessed by a Leave-One-Out Cross-Validation and compared to SAR assessment using VOPs for one generic model (Duke)9 with a safety factor of 2 (pSARDuke,2).
The SAR assessment performance was evaluated by calculating the error in the value for pSAR with respect to the ground-truth.
Each network was implemented in TensorFlow and trained in less than three hours on a GPU (NVIDIA Tesla P100-PCIe-16GB).
Results and Discussion
In Figure 2, the 3-Fold Cross-Validation results are reported showing, for each proposed CNN, the histograms of the pSAR estimation error and the output local SAR distributions with: mean pSAR estimation error, the worst-case underestimation and the worst-case overestimation. The best mapping was achieved by the cGAN trained with $$$\mathcal{L}_{Peak}$$$ (mean error 16% - max underestimation 28%). The Leave-One-Out Cross-Validation results using this algorithm are shown in Figure 3. The mean error remains roughly the same (17%) but the distribution is less spread (max underestimation 24%). Figure 4 shows the pSAR estimation errors using cGAN in comparison to pSARDuke,2, highlighting a less spread error distribution and smaller mean overestimation error for the proposed approach.Conclusion and Future Work
The relation between local SAR and MR images (DIXON/B1) can be mapped by a CNN. This approach is robust, fast and requires relatively few models for training. This method allows for subject-specific local SAR prediction in a few milliseconds. It outperforms the traditional approach and allows to reduce the over-conservative safety factors currently used (by around 73%).
In this study, 3D prediction could be enabled by using multiple 2D transverse slices (and/or sagittal/coronal). Furthermore, as local SAR reflects 3D electromagnetic scattering, we are investigating the use of 3D input data and 3D CNNs. The robustness of this approach to noise and inhomogeneities (measured B1+ map), and extension to other coil geometries, anatomical sites and field strengths, are under investigation.
Acknowledgements
No acknowledgement found.References
- I. Graesslin, H. Homann, S. Biederer, P. Börnert, K. Nehrke, P. Vernickel, G. Mens, P. Harvey, U. Katscher, A specific absorption rate prediction concept for parallel transmission MR. Magn Reson Med. 2012 Nov;68(5):1664-74.
- G. Eichfelder and M. Gebhardt, Local Specific Absorption Rate Control for Parallel Transmission by Virtual Observation Points, Magn. Reson. Med. 2011, vol. 66, no. 5, pp. 1468-1476.
- O. Ronneberger, P. Fischer, T. Brox, U-Net: Convolutional Networks for Biomedical Image Segmentation, Medical Image Computing and Computer-Assisted Intervention – MICCAI 2015 pp 234-241.
- X. Han, MR-based synthetic CT generation using a deep convolutional neural network method, Med Phys. 2017 Apr;44(4):1408-1419. doi: 10.1002/mp.12155. Epub 2017 Mar 21.
-
J. Schlemper, J. Caballero, J.V. Hajnal, A. Price, D.
Rueckert, A Deep Cascade of Convolutional Neural Networks for MR Image
Reconstruction, Information Processing in Medical Imaging (IPMI), 2017.
- E.F.Meliado, A.J.E Raaijmakers, M.C. Restivo, M. Maspero, P.R. Luijten, C.A.T. van den Berg, Database Construction for Local SAR Prediction: Preliminary Assessment of the Intra and Inter Subject SAR Variability in Pelvic Region, Proceedings of the ISMRM 24th Annual Meeting, Singapore, 7-13 May 2016.
-
A.J.E. Raaijmakers, M.
Italiaander, I.J. Voogt, P.R. Luijten, J.M. Hoogduin, D.W.J. Klomp, C.A.T. van
den Berg. The fractionated dipole antenna:
A new antenna for body imaging at 7 Tesla. Magn Reson Med. 2015 May
2 : 10.1002/mrm.25596. Published online 2015 May
2. doi: 10.1002/mrm.25596.
- P. Isola, J. Zhu, T. Zhou, A.A. Efros, Image-to-Image Translation with Conditional Adversarial Networks, arXiv:1611.07004v1 [cs.CV] 21 Nov 2016.
- Gosselin M-C, Neufeld E, Moser H, et al. Development of a new generation of high-resolution anatomical models for medical device evaluation: the Virtual Population 3.0. Phys Med Biol. 2014;59:5287–5303.
Figures
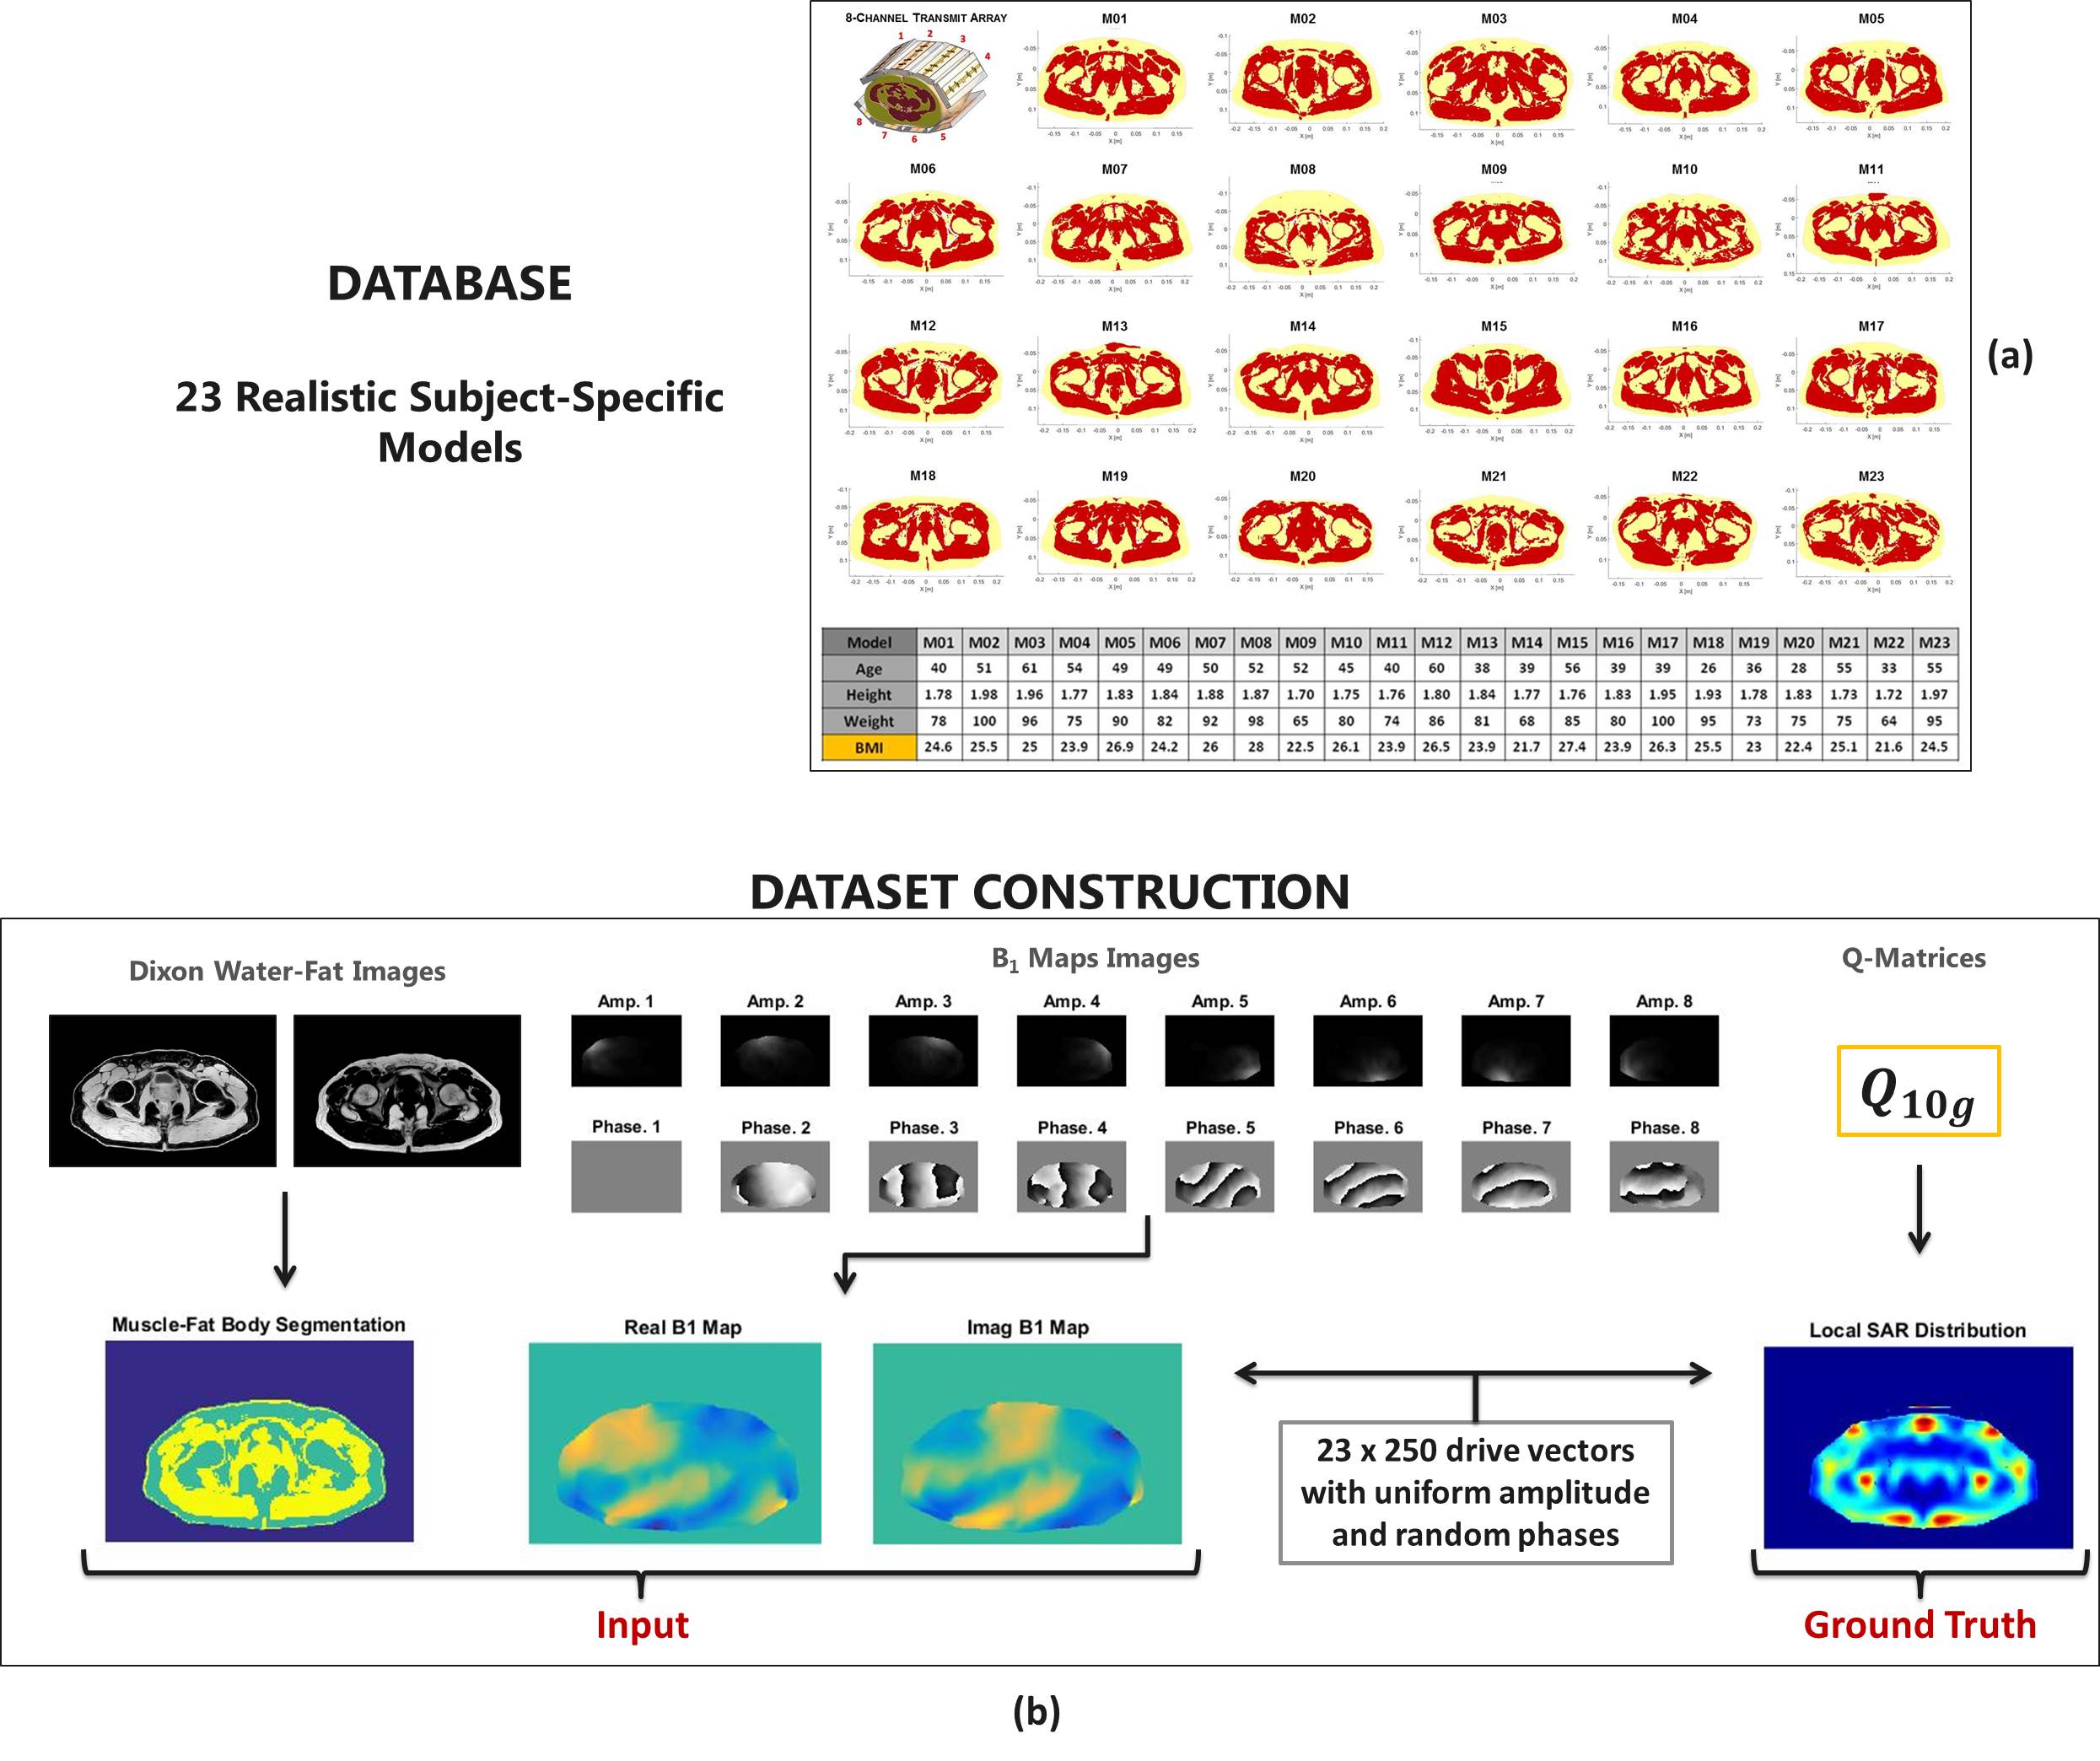
Figure 1: (a) 8-channel transmit array configuration, body models present in the database and data of their respective volunteers.
(b) Dataset construction pipeline.