0290
The Difference between Extracellular Space Expansion and Diffuse Myocardia Fibrosis in Defferent Severity Distolic Dysfunction (DD) Type 2 Diabetes Mellitus (T2DM) Rhesus Monkeys using Excellelar Volume mapping and Non-contrast T1ρ mapping1West China Hospital, Sichuan University, Chengdu, China, 2Sichuan Primed Bio-Tech Group Co., Ltd, Chengdu, China, 3Mallinckrodt Institute of Radiology, Washington University School of Medicine, St. Louis, MO, United States
Synopsis
In this study, diffuse myocardial fibrosis was quantifitied in type 2 diabetes mellitus (T2DM) rhesus monkeys with different severity diastolic dysfunction (DD) using ECV derived from T1 mapping and mFI derived from non-contrast T1ρ mapping. Different behaviors of ECV and mFI to differentiate HC from T2DM with mild DD was observed. This reflects the difference between extracellular space expansion and collagen content during the process of myocardial fibrosis. This difference is benifite for us to better understand the pathophysiology of DD.
Introduction
T1 mapping is a popular method use in myocardial fobrosis assessment. Extracellular volume fraction (ECV) derived from T1 mapping correlated well with collagen volume fraction (CVF) histological. Endogenous contrast T1ρ mapping for detecting collagen content has been used more and more often recently, although it was used first in regional fibrosis. ECV reflects myocardial fibrosis through extracellular expansion measurements while myocardial fibrosis index (mFI), which is a new non-contrast myocardial fibrosis index calculated based on the dispersion characteristics of T1ρ, derived from T1ρ detects collagen content, so it worth well to investigate the difference. A type 2 diabetes mellitus (T2DM) rehsus monkey model with different diastolic dysfunction (DD) was used.Methods
A total of 27 male rhesus monkeys were studied. Eighteen (14.33±2.24years, 10.89±1.48kg) of them were spontaneous T2DM (T2DM, FPG: 6.43 (6.08 6.58)mmol/L, HbA1c: 4.90 (4.75 5.10)%). The other nine (13.33years±1.11years, 10.15kg±0.84kg) healthy controls (HC, FPG: 4.24 (4.05 4.48)mmol/L, HbA1c: 4.35 (4.30 4.45)%) are matched in age, weight and gender. There was a four-week acclimation for blood biochemical examination. Echocardiography was performed for diastolic function classification (normal, mild, and moderate DD) on all monkeys 48h after the last blood collection. Cardiac magnetic resonance (CMR) was performed sequentially on all of the monkeys. CMR whole-heart cine was used for cardiac function evaluation, T1 mapping for ECV calulation, T1ρ mapping at two different spin-locking frequencies for mFI and absooute T1ρ values mesurements and late gadolinium enhancement (LGE) imaging for regional fobrosis detection. One heart of a T2DM monkey with moderate DD was harvested for histopathology. Masson staining were performed to confirm diffuse myocardial fibrosis. According to the classification of DD, we further assigned T2DM with HFpEF into different groups: T2DM with mild DD, T2DM with moderate DD. The comparisons were processed among three groups.Results
Echocardiographic results showed mild DD in 9 T2DM monkeys (E/A < 1,E’/A’ > 1 or < 1, E’ > 7, E/E’ < 11) and moderate DD in the other 9 T2DM monkeys (E/A > 1,E’/A’ < 1, E’ < 7, E/E’ > 11). The mFI increased progressively from healthy to mild DD, and then to moderate DD (2.90 ± 1.41 vs. 4.91 ± 2.09 vs. 7.74 ± 2.48). The differences between healthy and the mild (p = 0.049) or between the mild and the moderate (p = 0.007) were all significant. The corresponding global ECV was significantly different between three groups (24.61 (22.96 to 25.88) vs. 26.34 (25.39 to 26.97) vs. 29.02 (27.46 to 34.48)), but there was no significant different in ECV between healthy and the mild. Meanwhile, there was a positive correlation between mFI and ECV (r = 0.603, p = 0.001). For focal fibrosis, there was no evidence of regional late contrast enhancement in all animals. E’ correlated with mFI (r = -0.465) and ECV(r = -0.715). Histopathology showed that the myocardial extracellular space was widened with diffuse fibrosis (ECV = 37.46% and mFI =5.85) in T2DM with moderate DD.Discussion
Collagen deposition around intramural cardiac vessels and between myofibres, as well as expanded extracellular space are thought to be important contributors to DD in T2DM (1). While a good correlation between mFI and ECV was found, there still difference. The precise mechanisms to account for the different behaviors of ECV and mFI to differentiate HC from T2DM with mild DD remain unknown. One reason may be that increased ECV reflects the expansion of extracellular volume while increased mFI reflects the deposition of excessive collagen. Based on chemical exchange theory (2), an increased concentration of water protons bound to macromolecules (e.g., collagen) leads to increases in mFI. The magnitude of the increase is modulated by the chemical shifts and exchange rates of macromolecules. Although ECV correlated well with histologically quantified CVF, it theoretically delineates histological extracellular space. In a recent study by Shiro et al (3) showed ECV strongly correlated (r = 0.86) with histological extracellular space component but only modestly correlated (r = 0.66) with histological CVF in patients with dilated cardiomyopathy.Conclusion
From the results of our study, at the very early stage of DD, diffuse myocardial fibrosis still play an important role, meanwhile, ECV is not sensitive enough in ECM remodeling detection while mFI assess the changes in collagen contents. The nature between collagen deposition and extracellular volume expansion is still need further investigated. Future study to systematical validate mFI method by histologically defined collagen volume is warranted with sufficient sample size.Acknowledgements
No acknowledgement found.References
1. Lee M, Gardin JM, Lynch JC et al. Diabetes mellitus and echocardiographic left ventricular function in free-living elderly men and women: The Cardiovascular Health Study. American heart journal 1997;133:36-43.
2. Jin T, Kim SG. Quantitative chemical exchange sensitive MRI using irradiation with toggling inversion preparation. Magnetic resonance in medicine 2012;68:1056-64.
3. Nakamori S, Dohi K, Ishida M et al. Native T1 Mapping and Extracellular Volume Mapping for the Assessment of Diffuse Myocardial Fibrosis in Dilated Cardiomyopathy. J Am Coll Cardiol Img 2017.
Figures
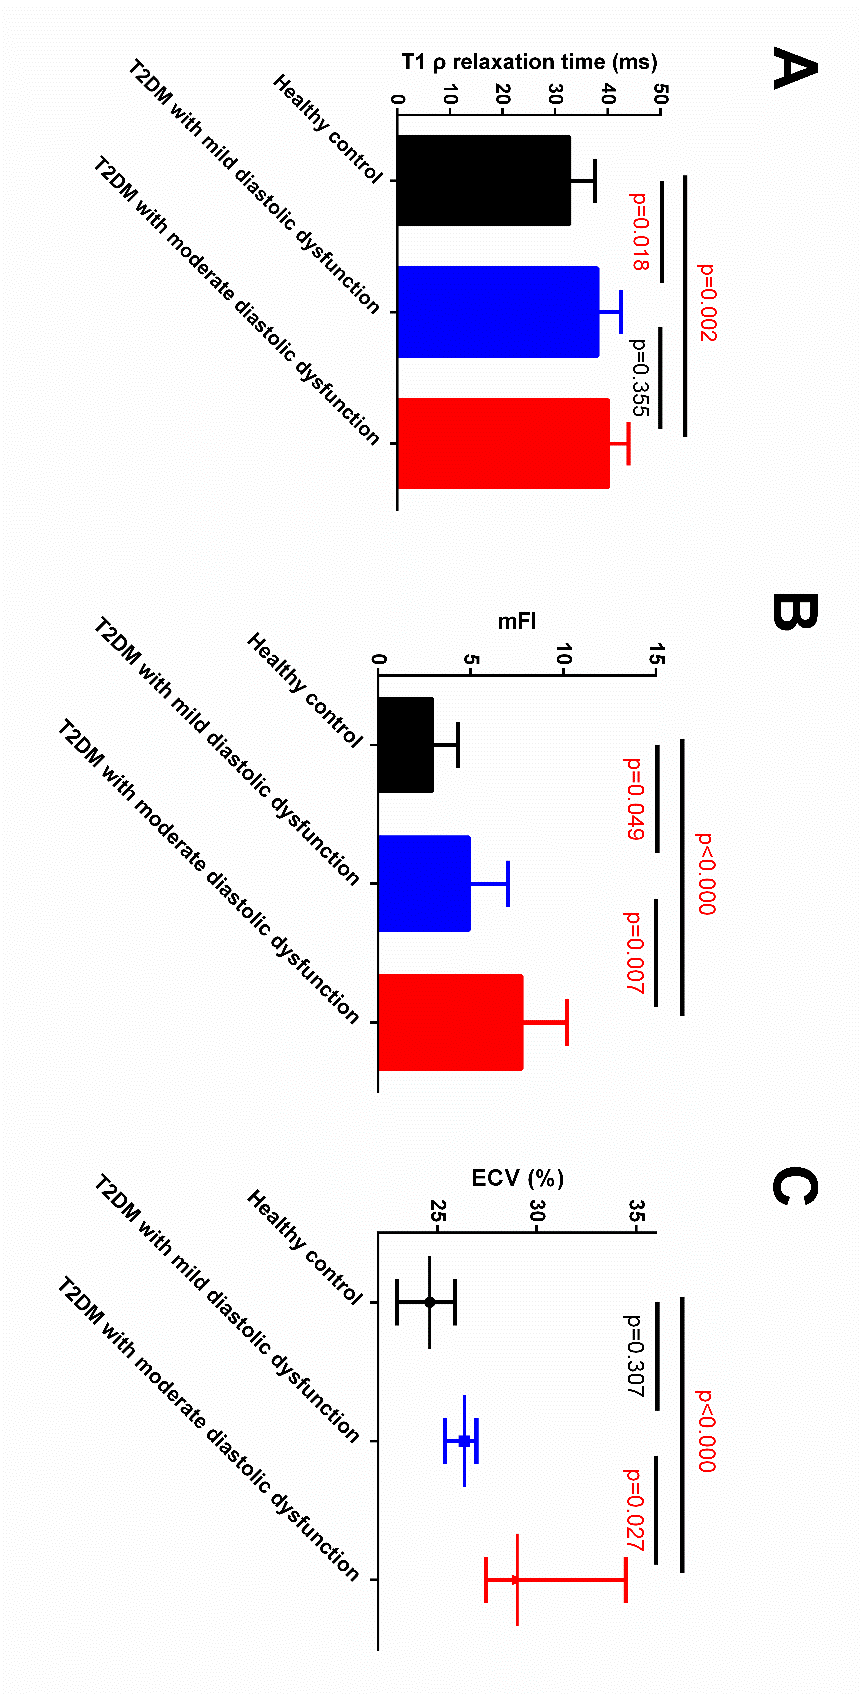
Figure 1 Results According to Different Degree of Diastolic Dysfunction and Healthy Control
Differences in T1ρ relaxation time(A), myocardial fibrosis index (mFI) (B), and extracellular volume (ECV) (C) are compared between healthy control, T2DM with mild diastolic dysfunction, and T2DM with moderate diastolic dysfunction. Values in (A) (B) were mean ± SD, (C) ECV was presented as median (interquartile range).
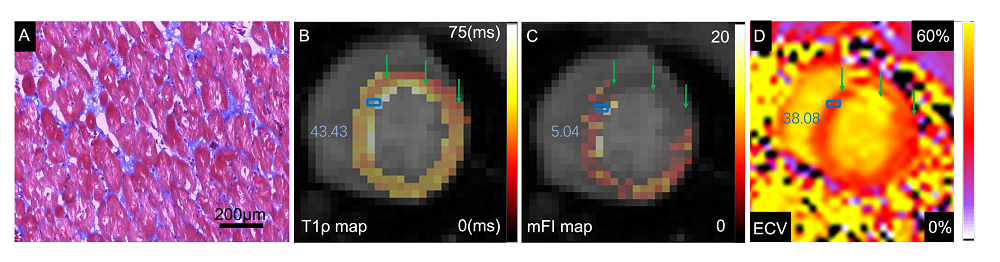
Figure 2 Masson staining and corresponding CMR images from one T2DM with moderate diastolic dysfunction
Masson staining were showned with high-power magnification of 100X (A) (collagen fibers were stained with aniline blue, cardiomyocytes were stained red), the blue rectangles in T1ρ map (B), myocardial fibrosis index (mFI) map (C) and extracellular volume fraction (ECV) map (D) indicate approximate areas where the histopathological slides were located. The values in each map indicated the mean T1ρ, mFI and ECV measured in the blue rectangles.