0289
The effects of cardiac allograft vasculopathy on intimal coronary artery wall thickness, myocardial fibrosis, and myocardial extracellular volume1Radiology, Lausanne University Hospital (CHUV), Lausanne, Switzerland, 2Center for BioMedical Imaging (CIBM), Lausanne, Switzerland, 3Cardiology, Lausanne University Hospital (CHUV), Lausanne, Switzerland, 4Pathology, Lausanne University Hospital (CHUV), Lausanne, Switzerland, 5School of Biomedical Engineering and Imaging Sciences, King's College London, London, United Kingdom
Synopsis
Cardiac allograft vasculopathy (CAV) occurs with a high prevalence after heart transplantation (HTx) and is a major cause of mid-term to late heart transplant failure. In this study we investigated whether the presence of CAV as diagnosed by x-ray coronary angiography or intima thickness as assessed by optical coherence tomography (OCT) is linked with the myocardial T1 relaxation time, extracellular volume, or interstitial fibrosis as assessed by endomyocardial biopsies (EMB).
Background
Cardiac allograft vasculopathy (CAV) occurs with a high prevalence after heart transplantation (HTx) and is a major cause of mid-term to late heart transplant failure.1 CAV is characterized by concentric thickening of the inner layer (tunica intima) of the coronary vessel wall, which ultimately results in reduced perfusion and oxygenation of the dependent myocardium.
CAV is most often detected by protocol X-ray coronary angiography (XRCA), where CAV manifests as irregular luminal narrowing of the majority of an affected vessel. Unfortunately, XRCA-based diagnosis of CAV is in general limited to late-stage CAV, when treatment options are limited. Conversely, optical coherence tomography (OCT) provides a high-resolution visualization of the tunica intima and accurate measurement of intimal thickness, suggesting that OCT should enable detection of early-stage CAV.2 However, OCT is time-consuming and associated with an increased dose of contrast media. MRI can be used to map and quantify the myocardial T1 relaxation time (a surrogate marker of fibrosis) and extracellular volume (ECV), which might both increase as a consequence of reduced myocardial oxygenation in CAV.3
The goal of this study was therefore to investigate whether the presence of CAV as diagnosed by XRCA or intima thickness as assessed by OCT is linked with the myocardial T1 relaxation time, ECV, or interstitial fibrosis as assessed by endomyocardial biopsies (EMB).
Materials and Methods
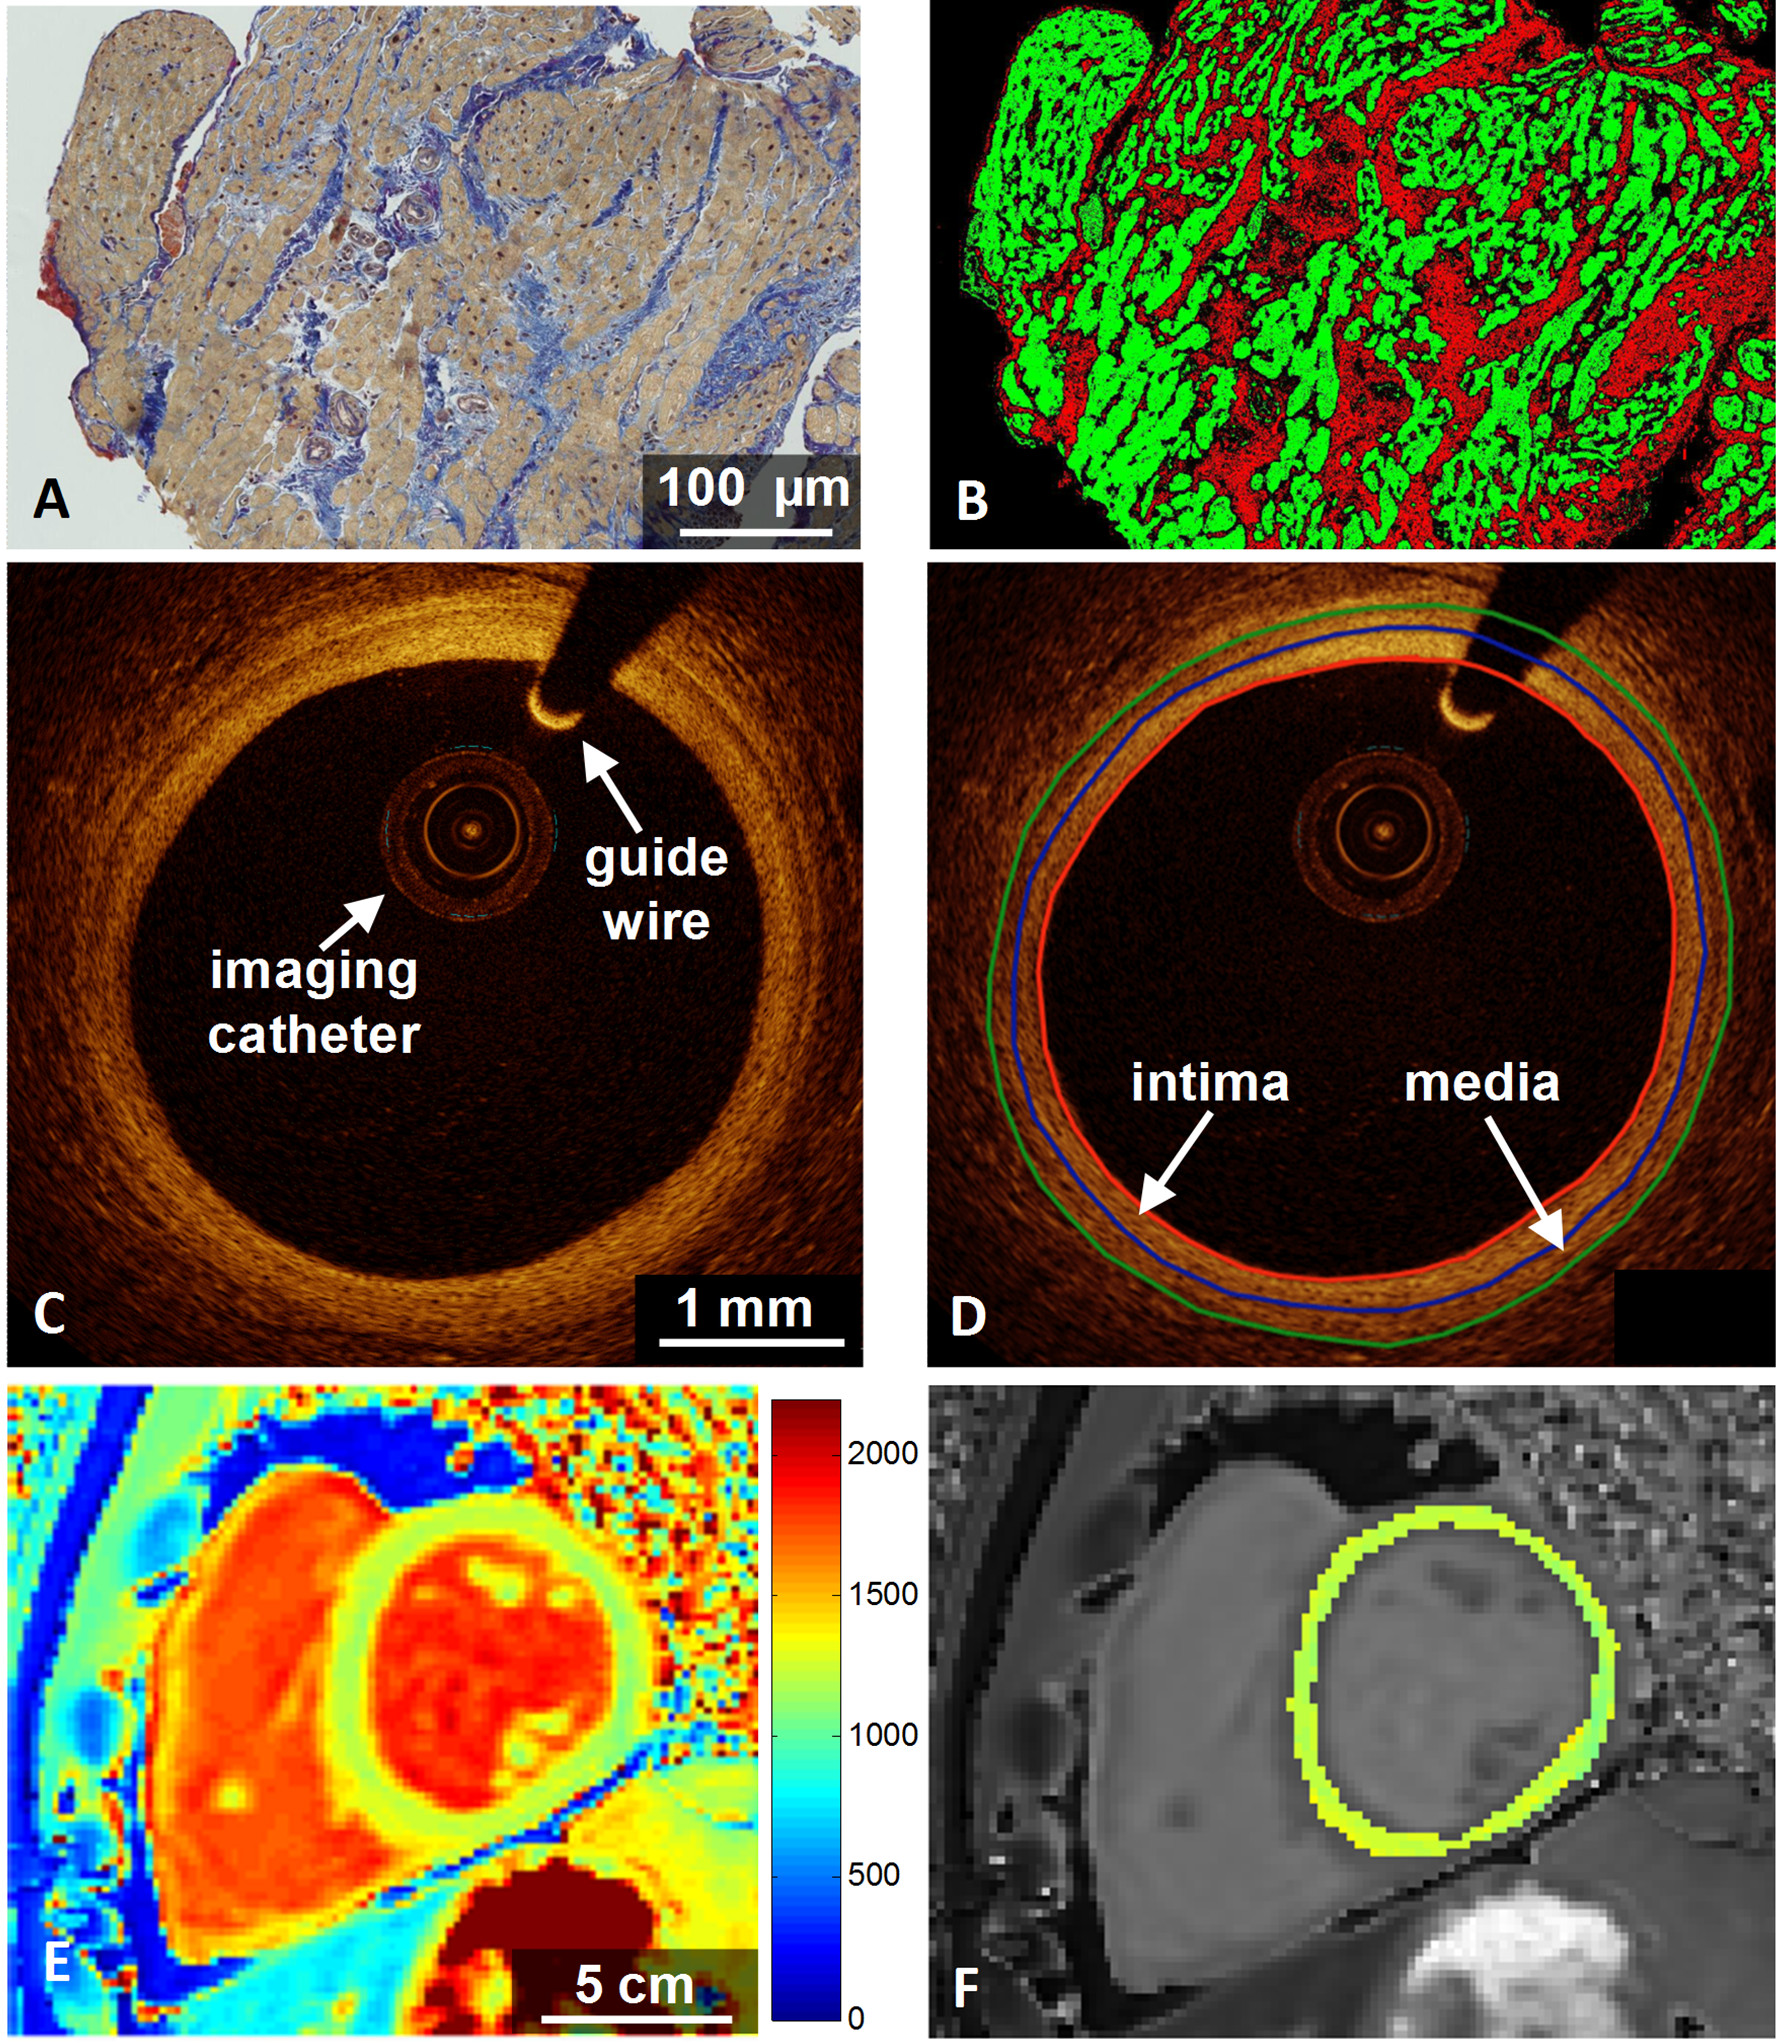
Cardiac allograft transplant recipients (n=26) ≥6 months after transplantation were recruited, and OCT was performed in addition to protocol XRCA and EMB. CAV was graded on the basis of the XRCA in accordance with the ISHLT recommendations (0=not significant; 3=severe).1 Quantification of interstitial fibrosis was based on Van Gieson’s staining of the EMB (Fig.1A-B) and automated image analysis.
Intracoronary OCT was performed with a Dragonfly Optis imaging catheter (St. Jude Medical) in 24 patients during automated pullback over 54mm at a radial resolution of 20µm and a frame density of 10frames/mm. The intima and media borders were manually traced and the ratio of the average thickness of the two layers (intima-media thickness ratio – IMTR) was calculated (Fig.1C-D). Segments with atherosclerotic plaque were excluded from analysis.
Myocardial T1 mapping was performed in 1 midventricular slice (breath-held 3-3-5 MOLLI,4 slice thickness 8mm, pixel size 1.4×1.4mm2) at 3T (Prisma, Siemens) before and after gadolinium contrast agent injection (Gadovist, 0.1ml/kg). The T1 and ECV of the entire segmented myocardium were computed (Fig.1E-F).
A Student’s t-test was used to establish whether the presence of CAV on XRCA is linked to differences in IMTR, EMB-based interstitial fibrosis, T1 value, or ECV. A Pearson correlation was calculated to ascertain whether there is a link between the IMTR or fibrosis on the one hand, and the T1 or ECV values on the other hand.
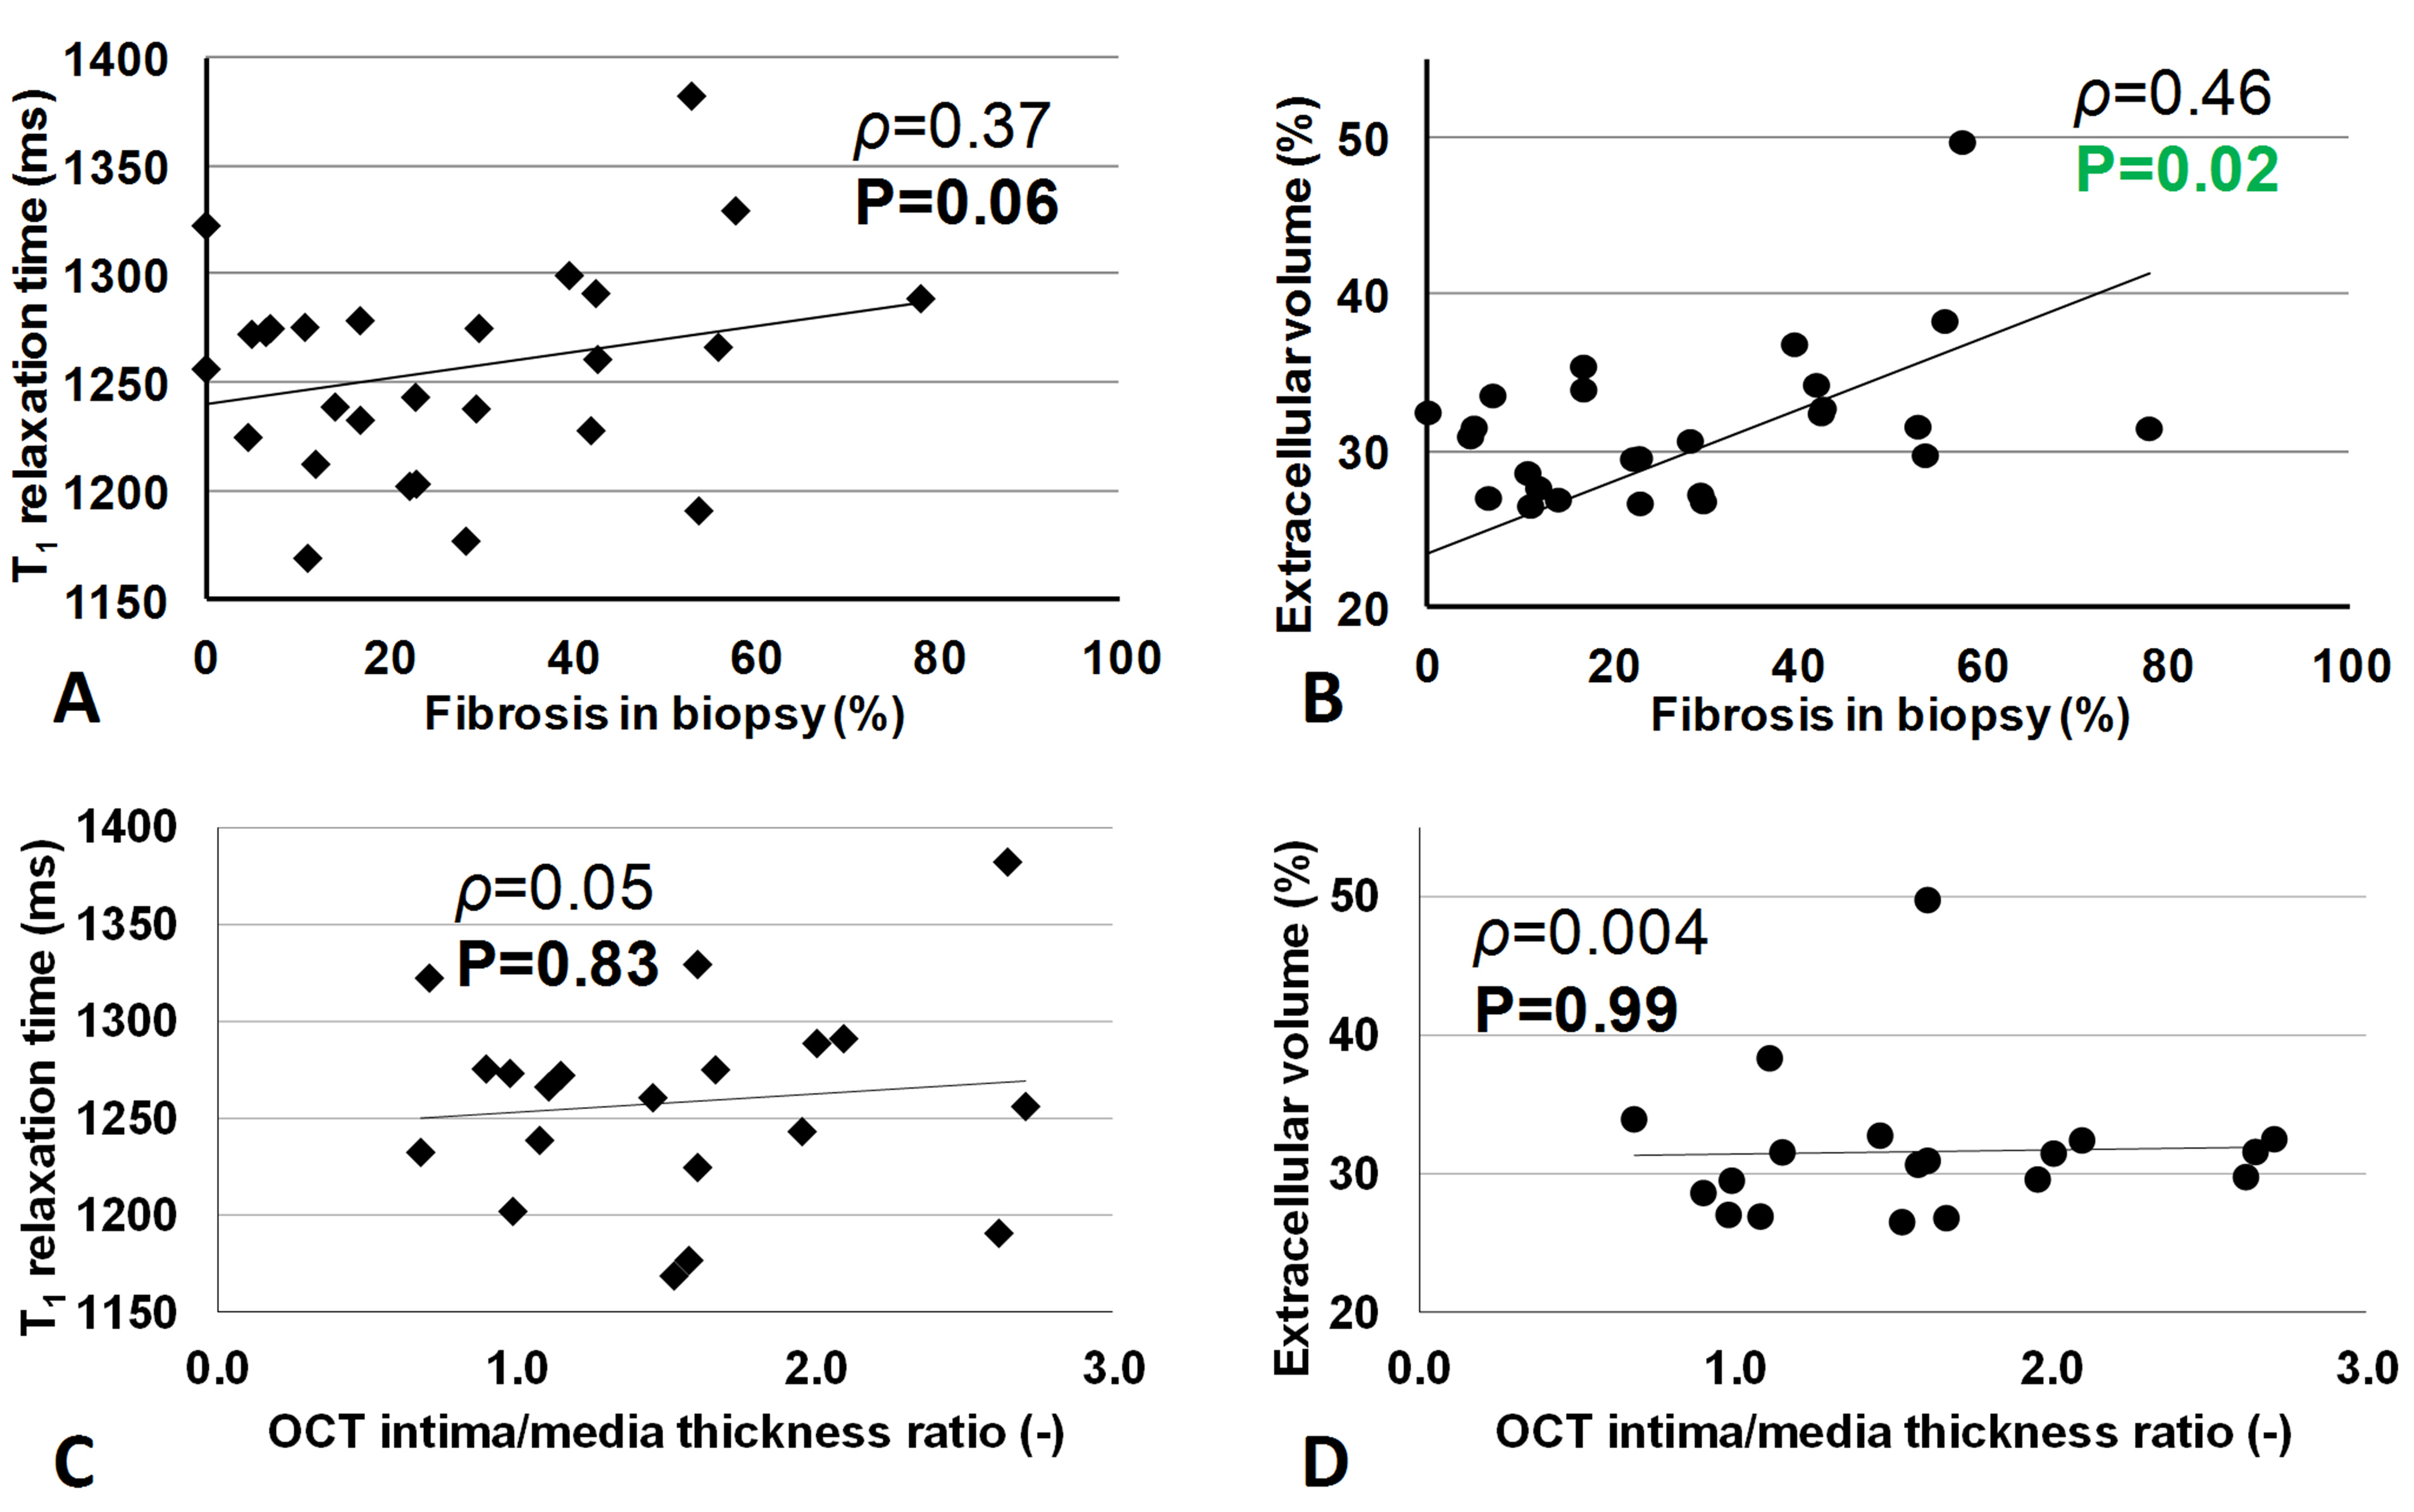
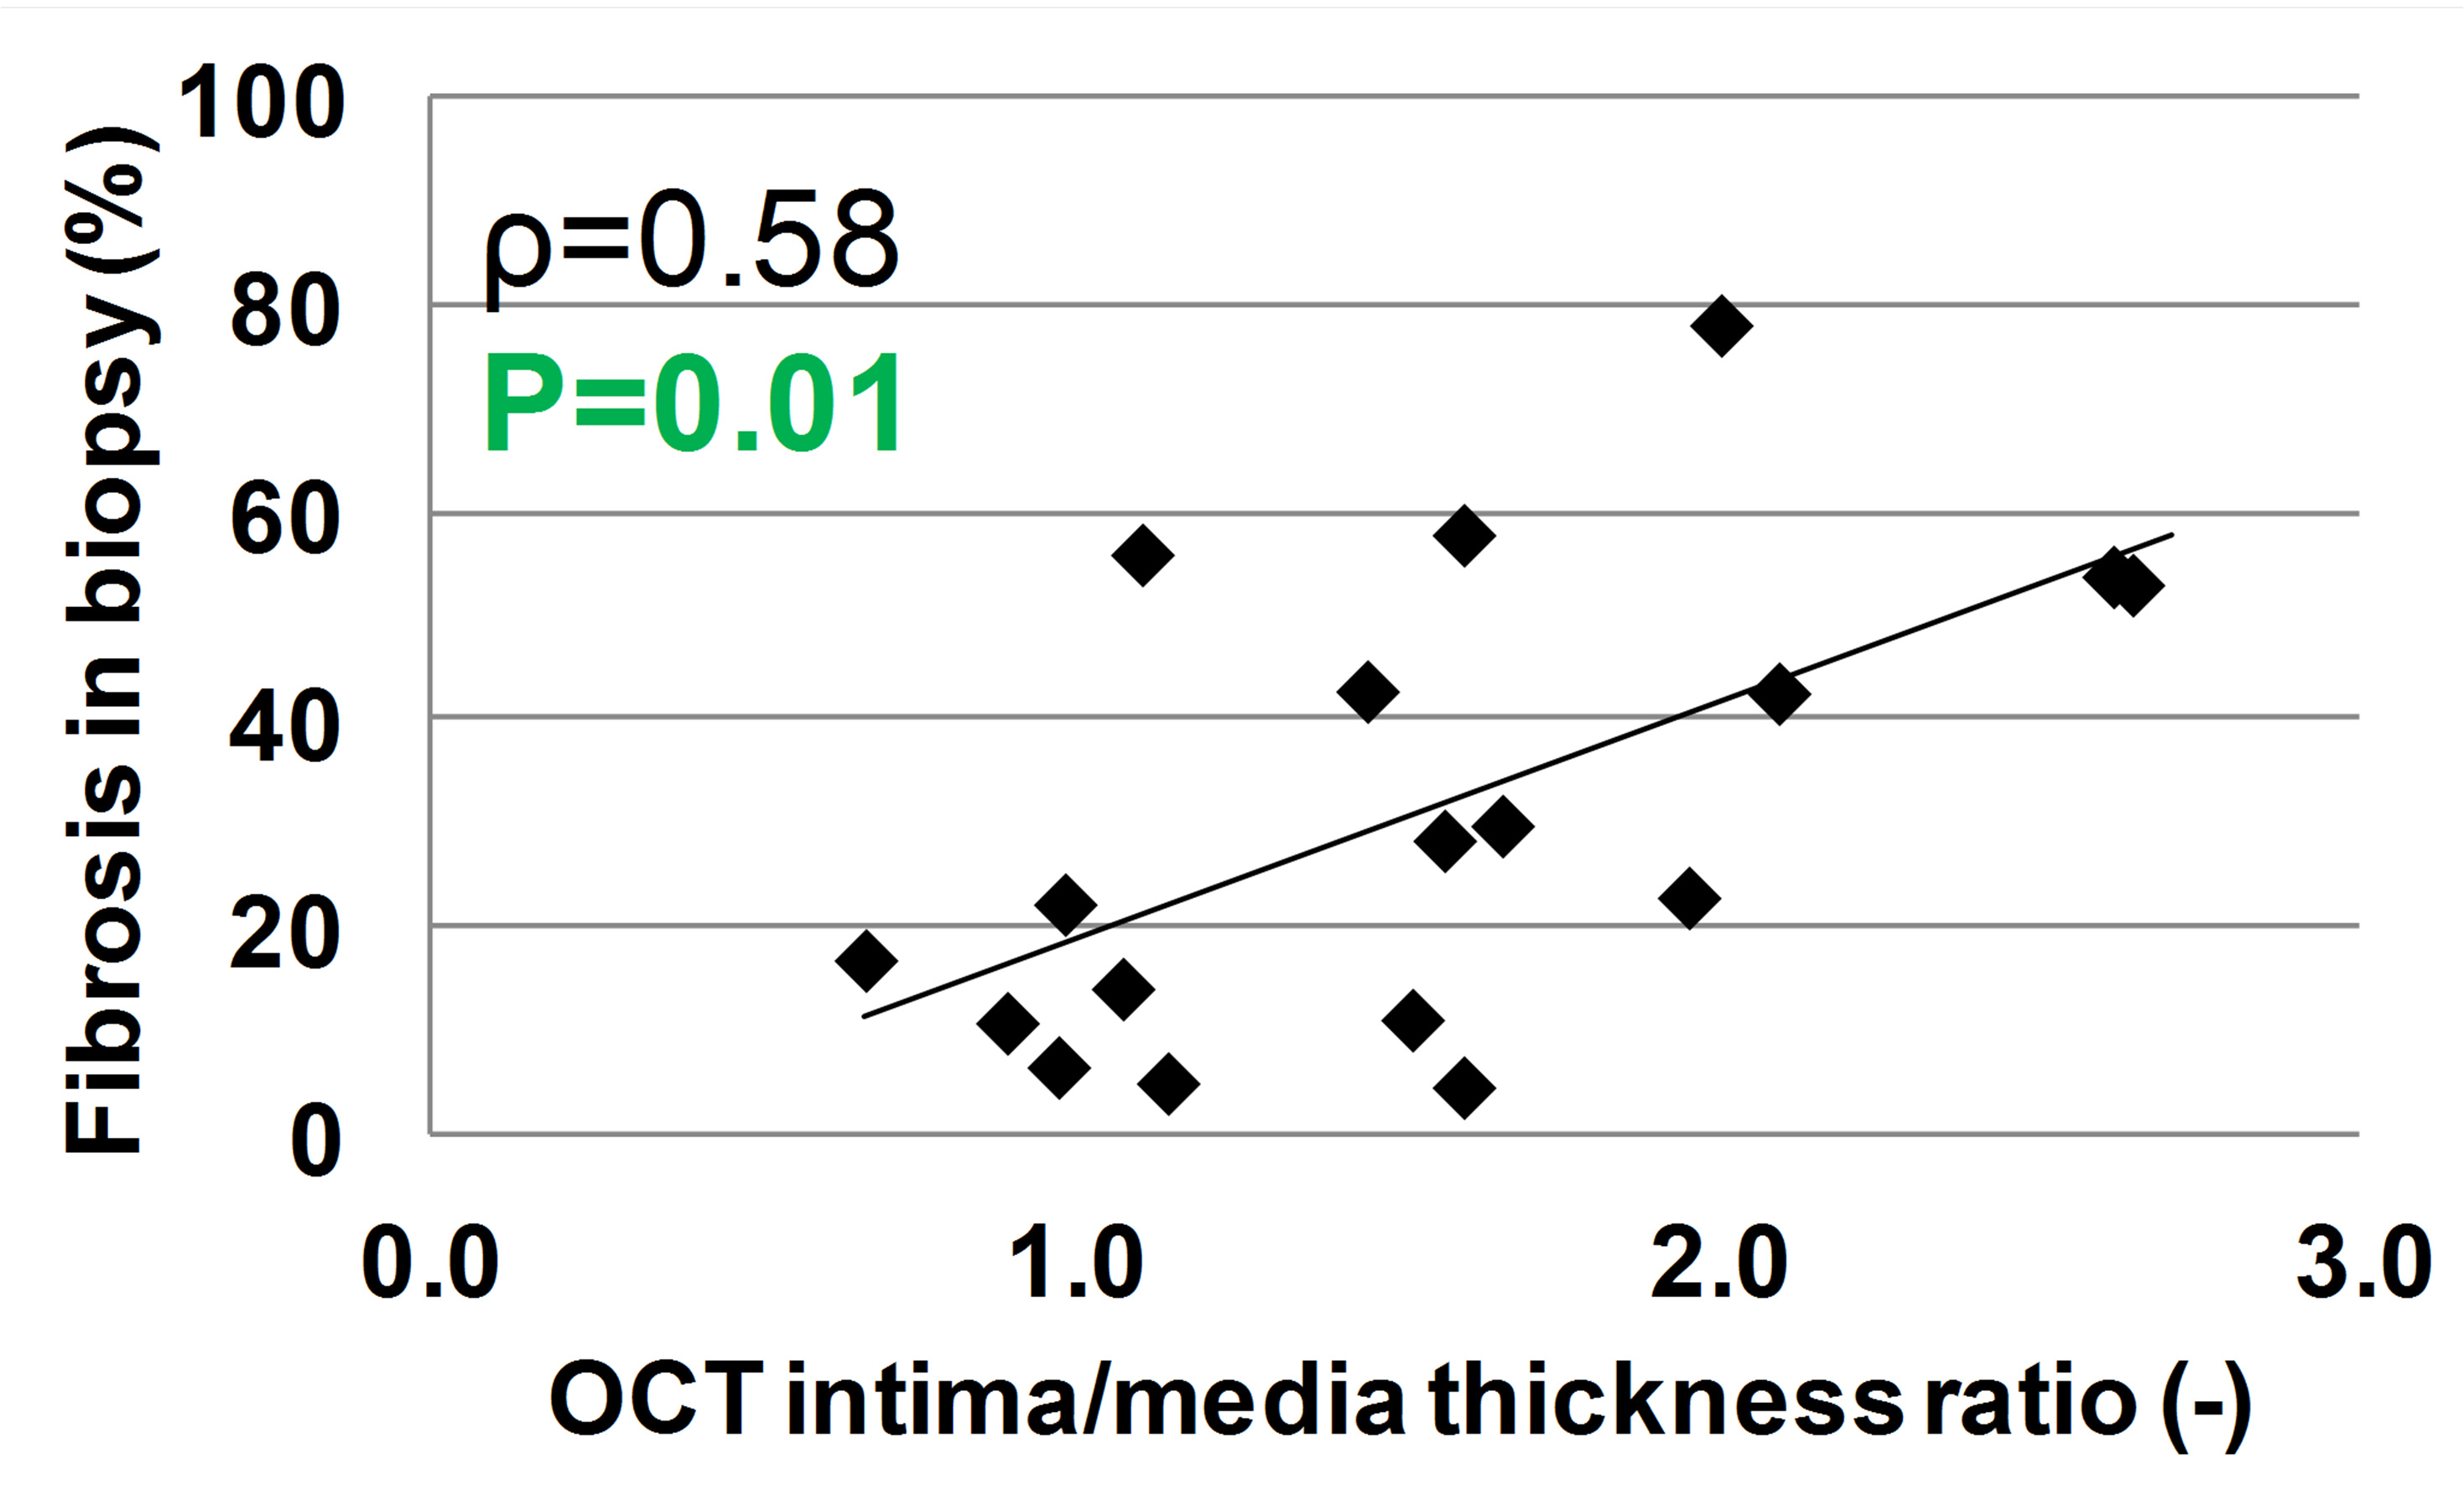
The interstitial fibrosis correlated significantly with the ECV (P=0.02) and showed a trend with the T1 relaxation time (P=0.06, Fig.2A-B), in accordance with previous reports on different cardiac pathologies.5,6 IMTR correlated neither with the T1 relaxation time nor ECV (Fig.2C-D), but was associated with the amount of interstitial fibrosis (P=0.01, Fig.3)
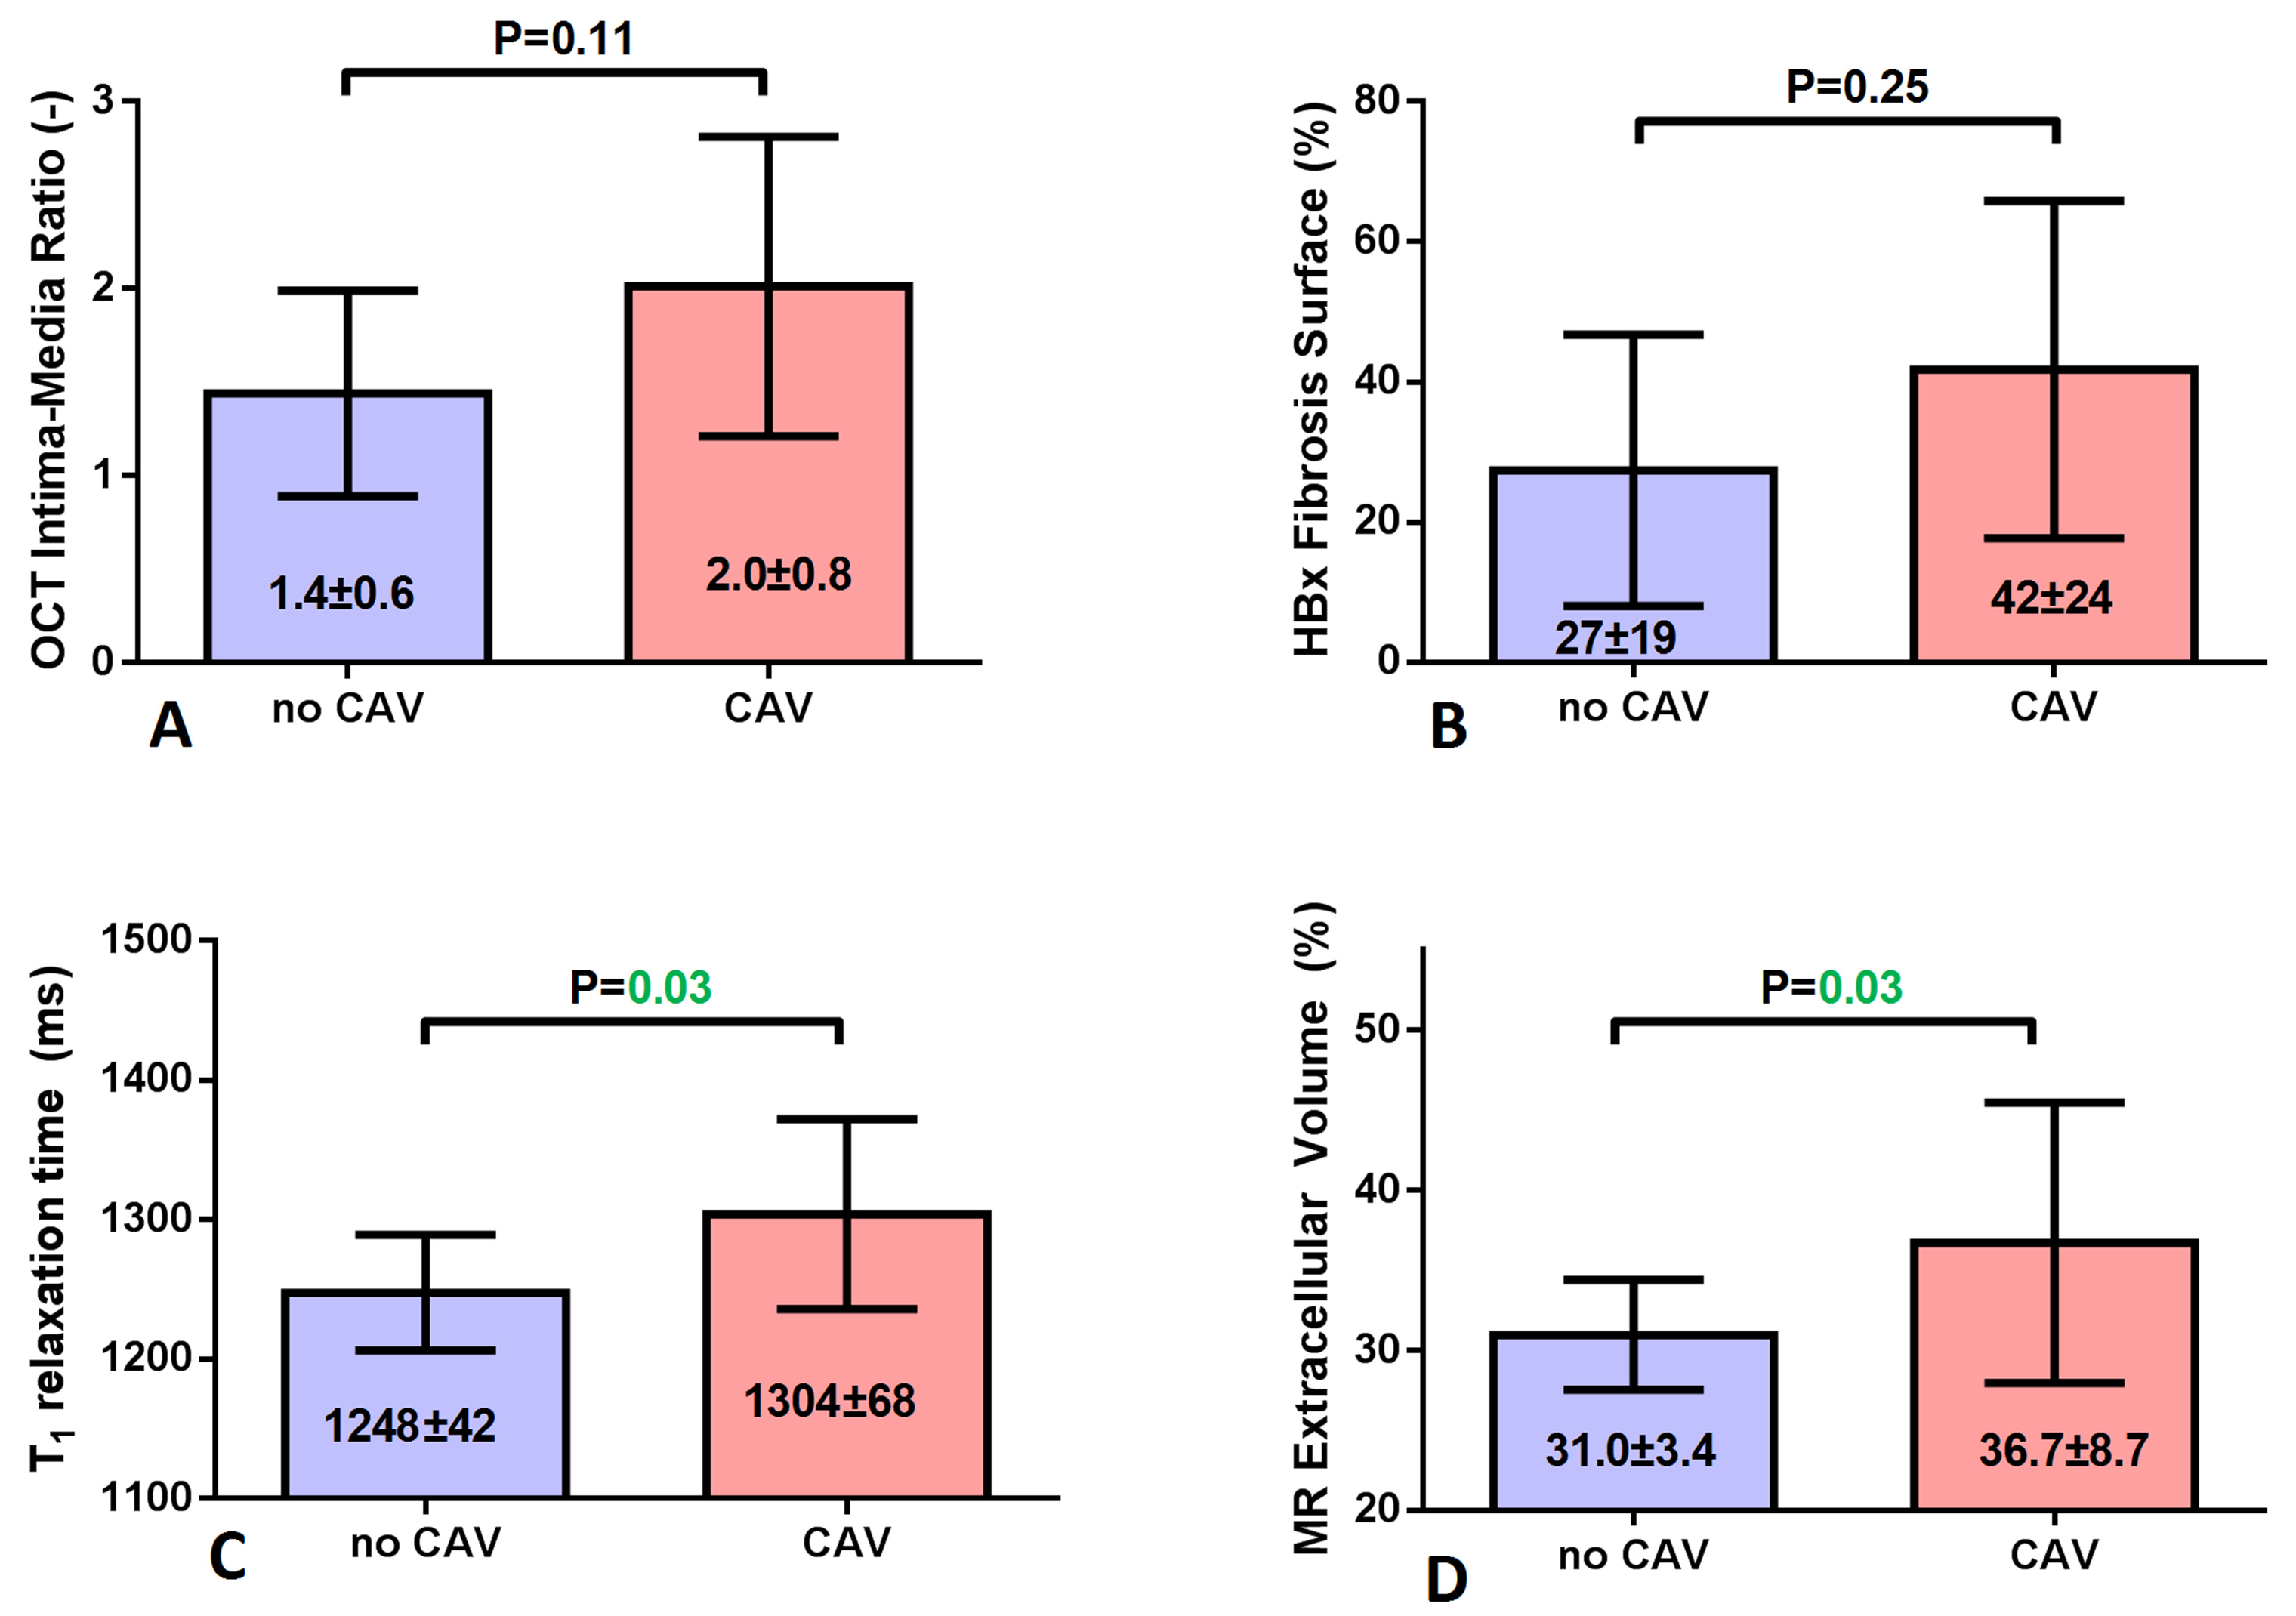
CAV was detected by XRCA in 4/26 patients (grade 1.5±1). IMTR and fibrosis did not significantly differ between the groups with and without CAV (P>0.11), but were numerically higher in recipients with CAV (Fig.4). However, both T1 and ECV were significantly higher in patients with CAV (P=0.03).
T1 values are influenced by both the tissue water content and collagen deposition, while ECV depends more purely on collagen deposition, which might explain the correlation of interstitial fibrosis with ECV. T1 mapping furthermore enables a global assessment of the myocardium at a much lower spatial resolution than OCT, which is used to locally characterize the coronary artery wall. These differences may explain why T1 and ECV values were not correlated with IMTR in this pilot study. However, the correlation between IMTR and EMB-based fibrosis suggests a link, which should be investigated further in a larger patient cohort.
Myocardial damage is associated with the arrival of interstitial edema and an increase of interstitial fibrosis. CAV when detected by means of XRCA represents advanced CAV, suggesting that dysfunction of the microcirculation may be causal for the increase of T1 values and ECV. However, this hypothesis needs confirmation in a study assessing the function of the microcirculation.
Conclusions
The present pilot study shows that T1 values and ECV increase in HTx recipients with CAV as detected by XRCA, suggesting that MRI-based non-invasive detection of CAV has the potential to play a diagnostic role for the detection of CAV. We therefore suggest that the results of this study merit evaluation in the context of a larger multicenter study.Acknowledgements
This work was supported by grants from the Swiss Heart Foundation and the Swiss National Science Foundation (PZ00P3-154719) to RBvH, as well as by the Centre d’Imagerie BioMédicale (CIBM) of the UNIL, UNIGE, HUG, CHUV, EPFL, and the Leenaards and Jeantet Foundations.References
1. MR Mehra et al., J Heart Lung Transplant. 2010, 29(7):717-27
2. SJ Khandhar et al. J Heart Lung Transplant. 2013; 32(6):596-602
3. DR Messroghli et al., J Cardiovasc Magn Reson. 2017; 19:75
4. DR Messroghli et al., Magn Reson Med. 2004,52(1):141-6
5. M Fontana et al., J Cardiovasc Magn Reson. 2012, 28;14:88.
6. S Nakamori et al., JACC Cardiovasc Imaging. 2017, pii: S1936-87
Figures