0288
Microvascular obstruction impacts recovery of T1 and T2 relaxation and strain parameters following acute myocardial infarction1Physical Sciences Platform, Sunnybrook Research Institute, Toronto, ON, Canada, 2Schulich Heart Research Program, Sunnybrook Research Institute, Toronto, ON, Canada, 3Division of Cardiology, St. Michael's Hospital, Toronto, ON, Canada, 4Department of Medical Biophysics, University of Toronto, Toronto, ON, Canada
Synopsis
Microvascular obstruction (MVO) is a frequent complication in acute myocardial infarction (AMI). A comprehensive regional and serial characterization of tissue response in the presence and absence of MVO will help assess the high-risk patients. In this study, we utilized T1 and T2 relaxation as well as tissue strain properties to evaluate tissue response in STEMI patient’s post-AMI. We observed that measures of infarct edema, hemorrhage and strain in patients with MVO fail to recover to remote levels and have significantly lower recovery rates compared to patients without MVO. Remote T2 alterations may further be an early indicator of adverse remodeling. Our study shows that MVO impacts disease progression by hindering the regional myocardial systolic function and edema recovery post-AMI.
Introduction
Ischemia-reperfusion injury (I/R) is an undesirable sequela following successful reperfusion in acute myocardial infarction (AMI) (1). Microvascular obstruction (MVO) is an important component of I/R that occurs in about 50% of the ST-segment elevation of myocardial infarction (STEMI) patient population and is an independent predictor of adverse outcomes post-AMI (2,3). In association with MVO, more recently, hemorrhage has been shown to be an active contributor to myocardial damage and inflammation, elevating the risk even further (4,5). Thus, the early and downstream consequences of MVO need to be carefully evaluated at the tissue level. Native T1 and T2 relaxation parameters have been instrumental in quantitatively characterising edema and hemorrhage in AMI (6,7). The consequences of MVO can be reflected by the assessment of inflammation, hemorrhage and regional myocardial systolic function in vivo over time using relaxation properties and strain analysis, respectively. The aim of our study was to serially characterize MRI relaxation and strain in STEMI patients with and without MVO to observe the influence of MVO in the transition from acute to chronic state of disease.Methods
16 patients with reperfused STEMI underwent a MRI exam on a 1.5T scanner at 2 days and 6 months post percutaneous-coronary-intervention (PCI); T1 data were available in 8 of 16 patients. Cardiac function was assessed using a cine SSFP sequence. T2 was quantified using a previously validated cardiac-gated free-breathing T2-prepared spiral imaging sequence: TE=2.9-184ms, 12 spiral interleaves, 4096 points (16.4 ms duration) (8). T1 was quantified using a Modified Look-Locker Inversion recovery (MOLLI) sequence acquired with two inversion schedules in a 3-5 pattern with 3 pausing heart-beats resulting in 8 images in 11 heart-beats. T2* was utilized as a reference for the identification of hemorrhage; the sequence was a multi-echo gradient-echo acquisition with 8 echoes, TE=1.4-12.7ms and TR=14.6 ms. Finally, gadolinium-DTPA (Magnevist, 0.2 mmol/kg) was administered to identify regions of MVO and infarction with early- and late gadolinium enhancement (EGE, LGE) imaging initiated at 1 min and 8 min post injection, respectively. Patients were divided into two groups with and without MVO (MVO+ and MVO-) by identifying the hypo-enhanced core in EGE images. Two slices with infarct were chosen for analysis per patient per time point. T1, T2, T2* and radial and circumferential strain were analyzed in infarct and remote segments using CVI42 software (Circle Imaging). Statistics were performed using 2-way ANOVA.Results
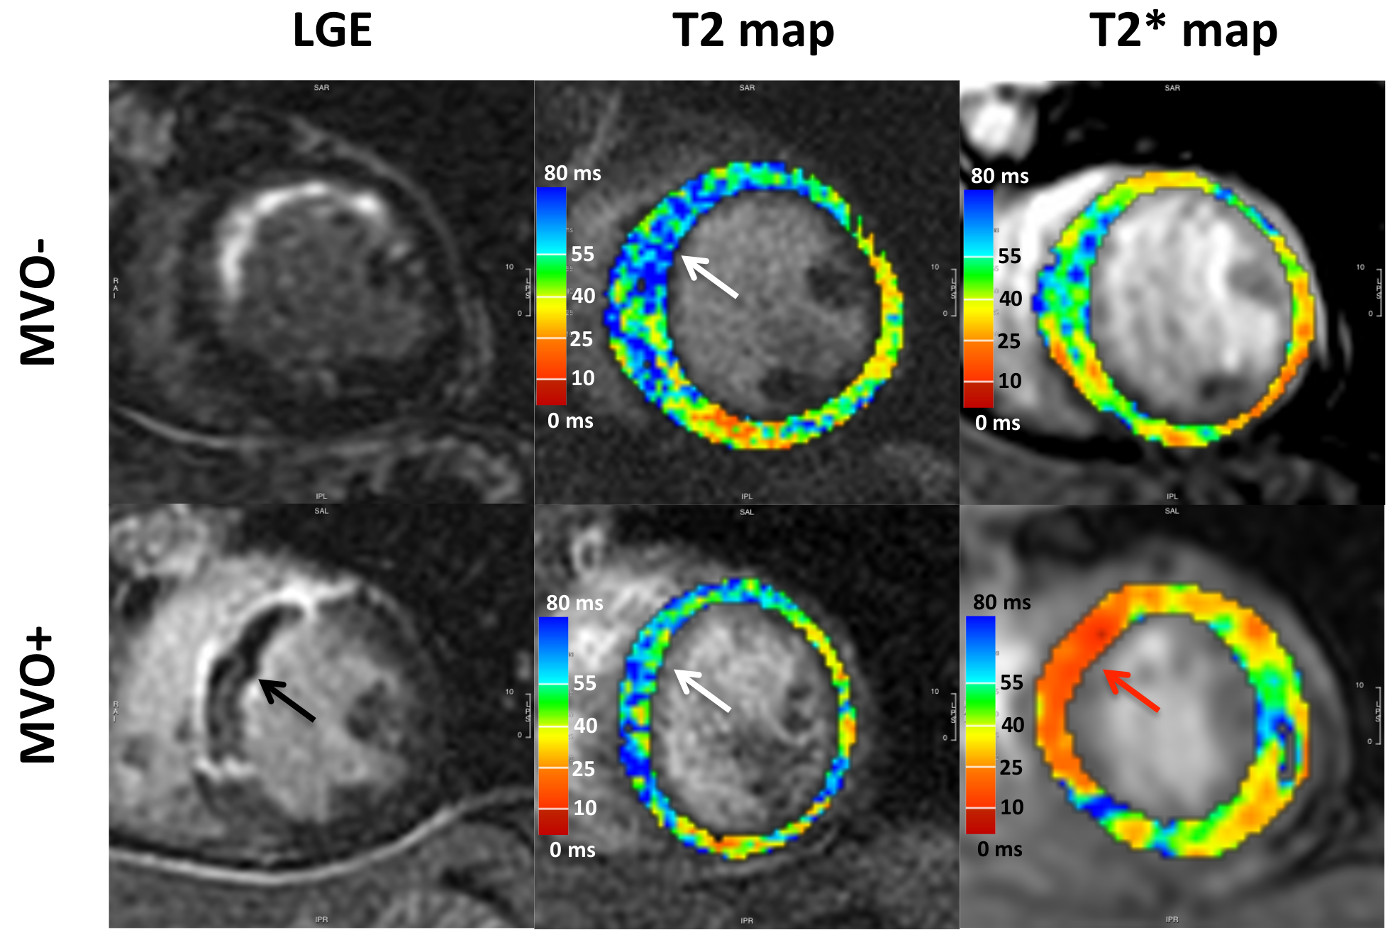
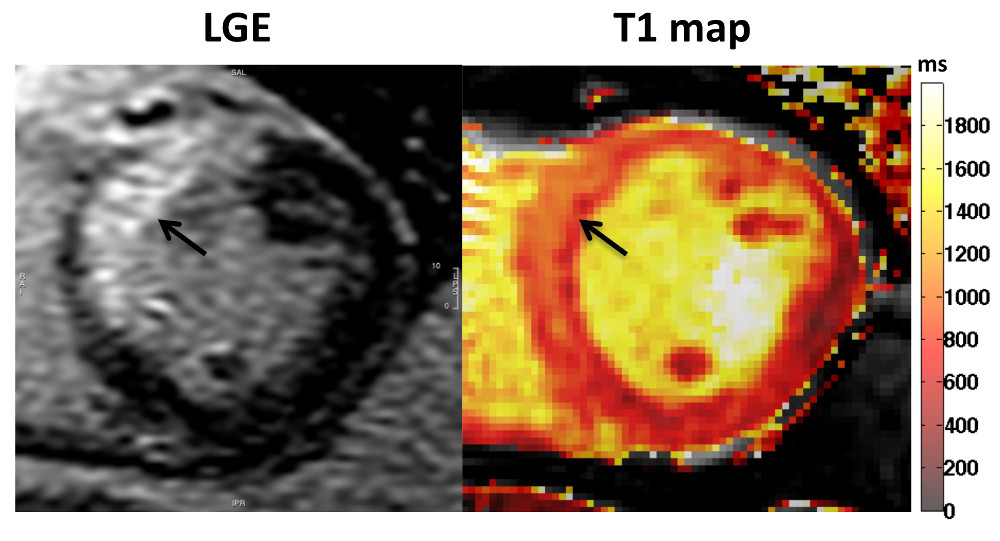
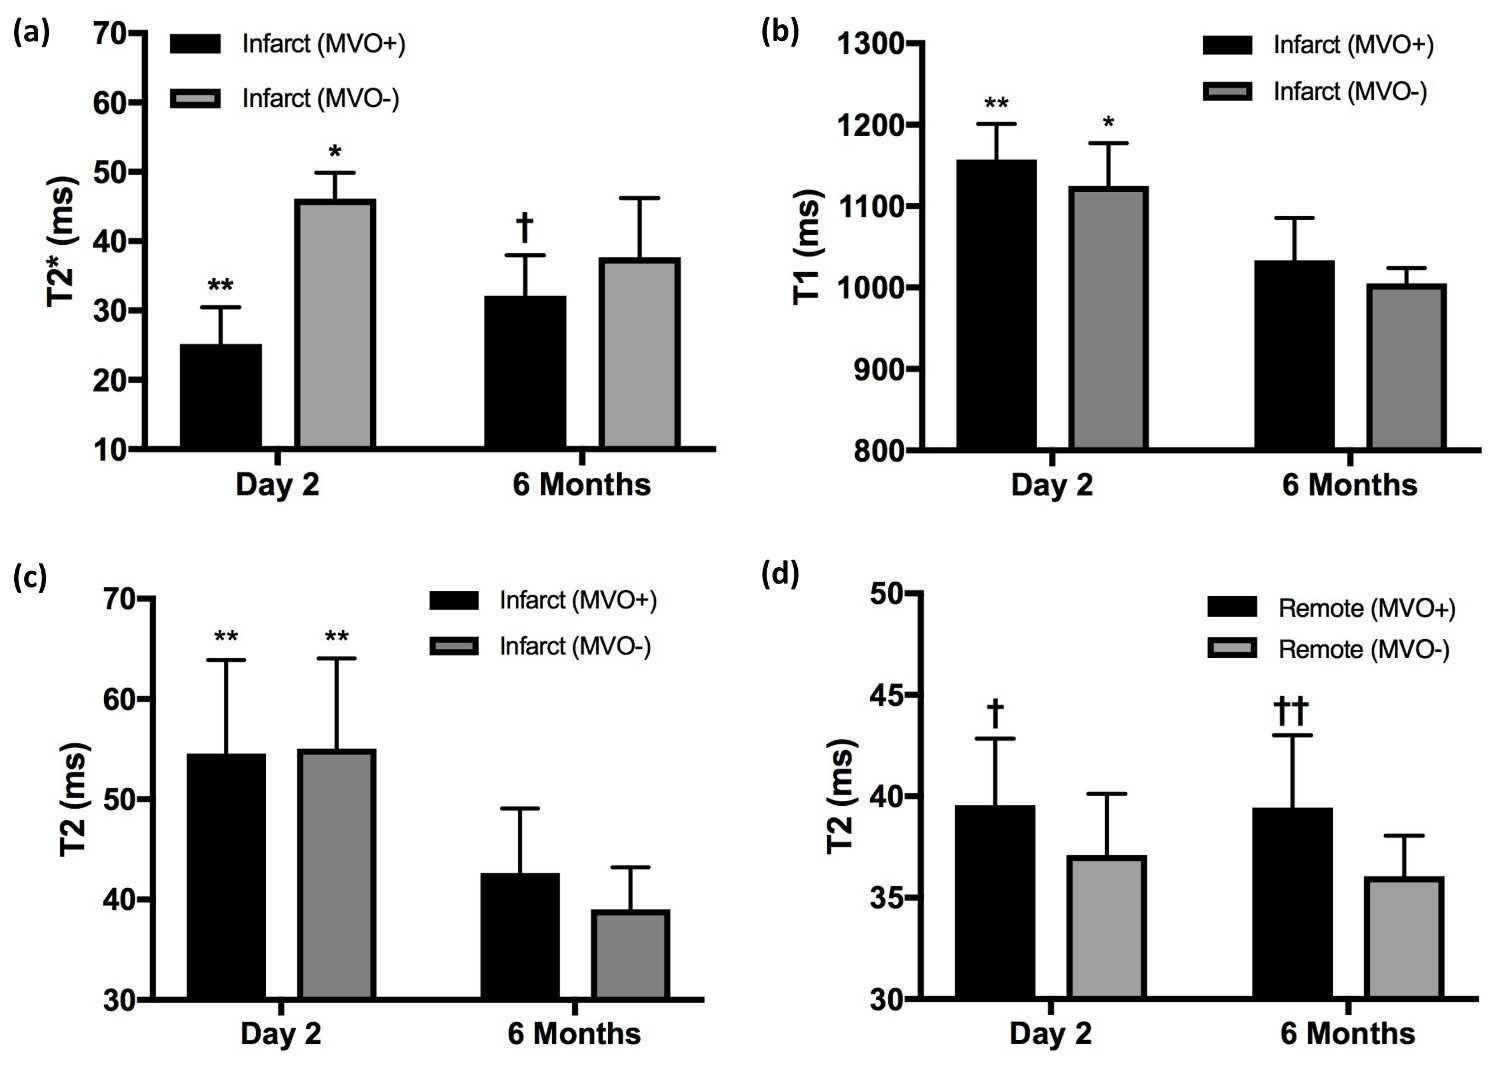
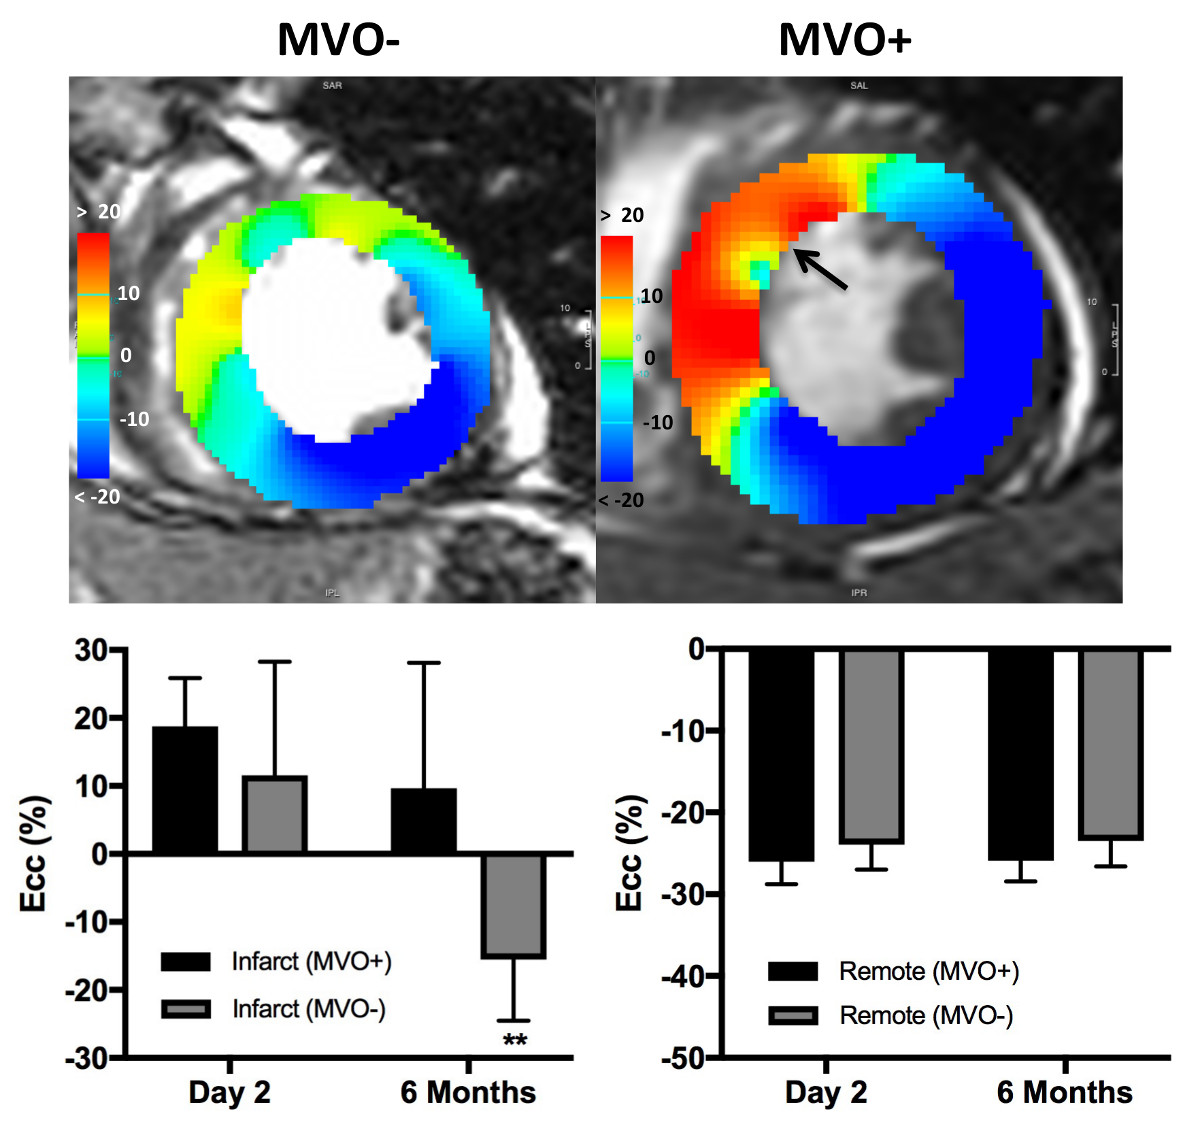
MVO was detected on EGE images in 8 of the 16 patients (50%). Representative images of LGE, T2, T2* and T1 maps are shown in Fig. 1 and Fig. 2. At 2 days, infarct T2* values were significantly lower in the MVO+ group relative to remote (25±5 ms vs. 36±3 ms, p<0.001) indicative of hemorrhage while T2* was slightly elevated in the MVO- group consistent with edema. At 6 months, T2* in the MVO+ group remained lower than that in the MVO- (32±5 ms vs. 37±8 ms, p=0.05) suggesting persistent hemorrhage (Fig. 3a). Infarct native T1 was significantly elevated at 2 days compared to remote (MVO+: 1157±43 vs. 997±28 ms; MVO-: 1124±52 vs.1017±19 ms) in both groups indicating edematous development (Fig. 3b). Similarly, at 2 days, T2 was also significantly elevated due to edema compared to remote tissue (MVO+: 54±9 vs. 40±3 ms; MVO-: 55±9 vs. 37±3 ms). Edema characterized by T1 and T2 in infarct myocardium subsided at 6 months in both groups (p<0.02); however both T1 and T2 showed trend towards increased values in the MVO+ group compared to MVO- (p=NS) pointing towards a persistent inflammatory response (Fig. 3 b,c). Differences in infarct native T1 and T2 were not apparent at day 2 between the groups given the counteracting effects of edema and hemorrhage in the MVO+ group. In the MVO+ group, remote T2 value was significantly elevated at both time points compared to the MVO- group (Fig. 3d). Remote native T1 values were not found to be different across time or between groups. Radial and circumferential strain analysis in infarct regions showed significant recovery over time for only MVO- patients whereas recovery was blunted in MVO+ patients (Fig. 4). Strain in remote myocardium was not different across groups and remained unchanged over time.Conclusion
Relaxation and strain parameters reveal important information about the underlying tissue alterations and healing post-AMI. Measures of edema, hemorrhage and strain progression in the infarct region for patients with microvascular obstruction fail to recover to remote levels and have significantly lower recovery rates compared to patients without microvascular obstruction. Remote myocardial alterations in T2 may further be an early indicator of adverse remodeling. Thus, our study shows that microvascular obstruction impacts disease progression by hindering the regional myocardial systolic function and edema recovery post-AMI.Acknowledgements
We would like to acknowledge funding support from the Ontario Research Fund (ORF-RE7) and the Canadian Institutes of Health Research.References
1. Yellon DM, Hausenloy DJ. Myocardial reperfusion injury. N Engl J Med 2007;357:1121–1135.
2. van Kranenburg M, Magro M, Thiele H, et al. Prognostic value of microvascular obstruction and infarct size, as measured by CMR in STEMI patients. JACC Cardiovasc. Imaging 2014;7:930–939.
3. Wu KC, Zerhouni EA, Judd RM, Lugo-Olivieri CH, Barouch LA, Schulman SP, Blumenthal RS, Lima JA. Prognostic significance of microvascular obstruction by magnetic resonance imaging in patients with acute myocardial infarction. Circulation 1998;97:765–772.
4. Carrick D, Haig C, Ahmed N, et al. Myocardial Hemorrhage After Acute Reperfused ST-Segment-Elevation Myocardial Infarction: Relation to Microvascular Obstruction and Prognostic Significance. Circ. Cardiovasc. Imaging 2016;9:e004148.
5. Ghugre NR, Pop M, Thomas R, Newbigging S, Qi X, Barry J, Strauss BH, Wright GA. Hemorrhage promotes inflammation and myocardial damage following acute myocardial infarction: insights from a novel preclinical model and cardiovascular magnetic resonance. J. Cardiovasc. Magn. Reson. 2017;19:50.
6. Ugander M, Bagi PS, Oki AJ, Chen B, Hsu L-Y, Aletras AH, Shah S, Greiser A, Kellman P, Arai AE. Myocardial edema as detected by pre-contrast T1 and T2 CMR delineates area at risk associated with acute myocardial infarction. JACC Cardiovasc Imaging 2012;5:596–603.
7. Ghugre NR, Ramanan V, Pop M, Yang Y, Barry J, Qiang B, Connelly KA, Dick AJ, Wright GA. Quantitative tracking of edema, hemorrhage, and microvascular obstruction in subacute myocardial infarction in a porcine model by MRI. Magn. Reson. Med. 2011;66:1129–1141.
8. Zia MI, Ghugre NR, Connelly KA, Strauss BH, Sparkes JD, Dick AJ, Wright GA. Characterizing myocardial edema and hemorrhage using quantitative T2 and T2* mapping at multiple time intervals post ST-segment elevation myocardial infarction. Circ Cardiovasc Imaging 2012;5:566–572.
Figures