0284
Assessment of Myocardial Fibre Architecture in Cardiac Amyloidosis Patients using In-Vivo Cardiac Diffusion Tensor Imaging1Institute for Biomedical Engineering, University and ETH Zurich, Zurich, Switzerland, 2Department of Cardiology, University Hospital Zurich, Zurich, Switzerland, 3Dept. Cardiology, Pneumology and Angiology, Heinrich Heine University, Düsseldorf, Germany
Synopsis
In-vivo cardiac diffusion tensor imaging (cDTI) allows imaging of alterations in the cardiac fibre architecture in diseased hearts. In this work, changes in the myocardial microstructure in patients with cardiac amyloidosis were assessed using cDTI and T1 mapping. Mean diffusivity and T1native are significantly increased in the patients and the helical fibre configuration is comparable to healthy controls. There is a trend towards higher/lower MD/FA with increased T1native, respectively. In agreement with T1 mapping, diffusion results support the presence of myocardial degeneration and emphasize the potential of cDTI as contrast agent free tool for characterizing cardiac involvement in amyloidosis patients.
Introduction
Imaging of the complex cardiac fiber architecture in healthy (1–3) and diseased human hearts (4–8) using in-vivo cardiac Diffusion Tensor Imaging (DTI) has been reported in recent years. Alterations of the cardiac microstructure of failing hearts have been associated with changes in diffusion metrics. The objective of the present work was to assess changes in myocardial fibre architecture in patients with cardiac amyloidosis using DTI. Diffusion metrics were correlated with T1 mapping and results compared with data from age-matched healthy controls.Methods
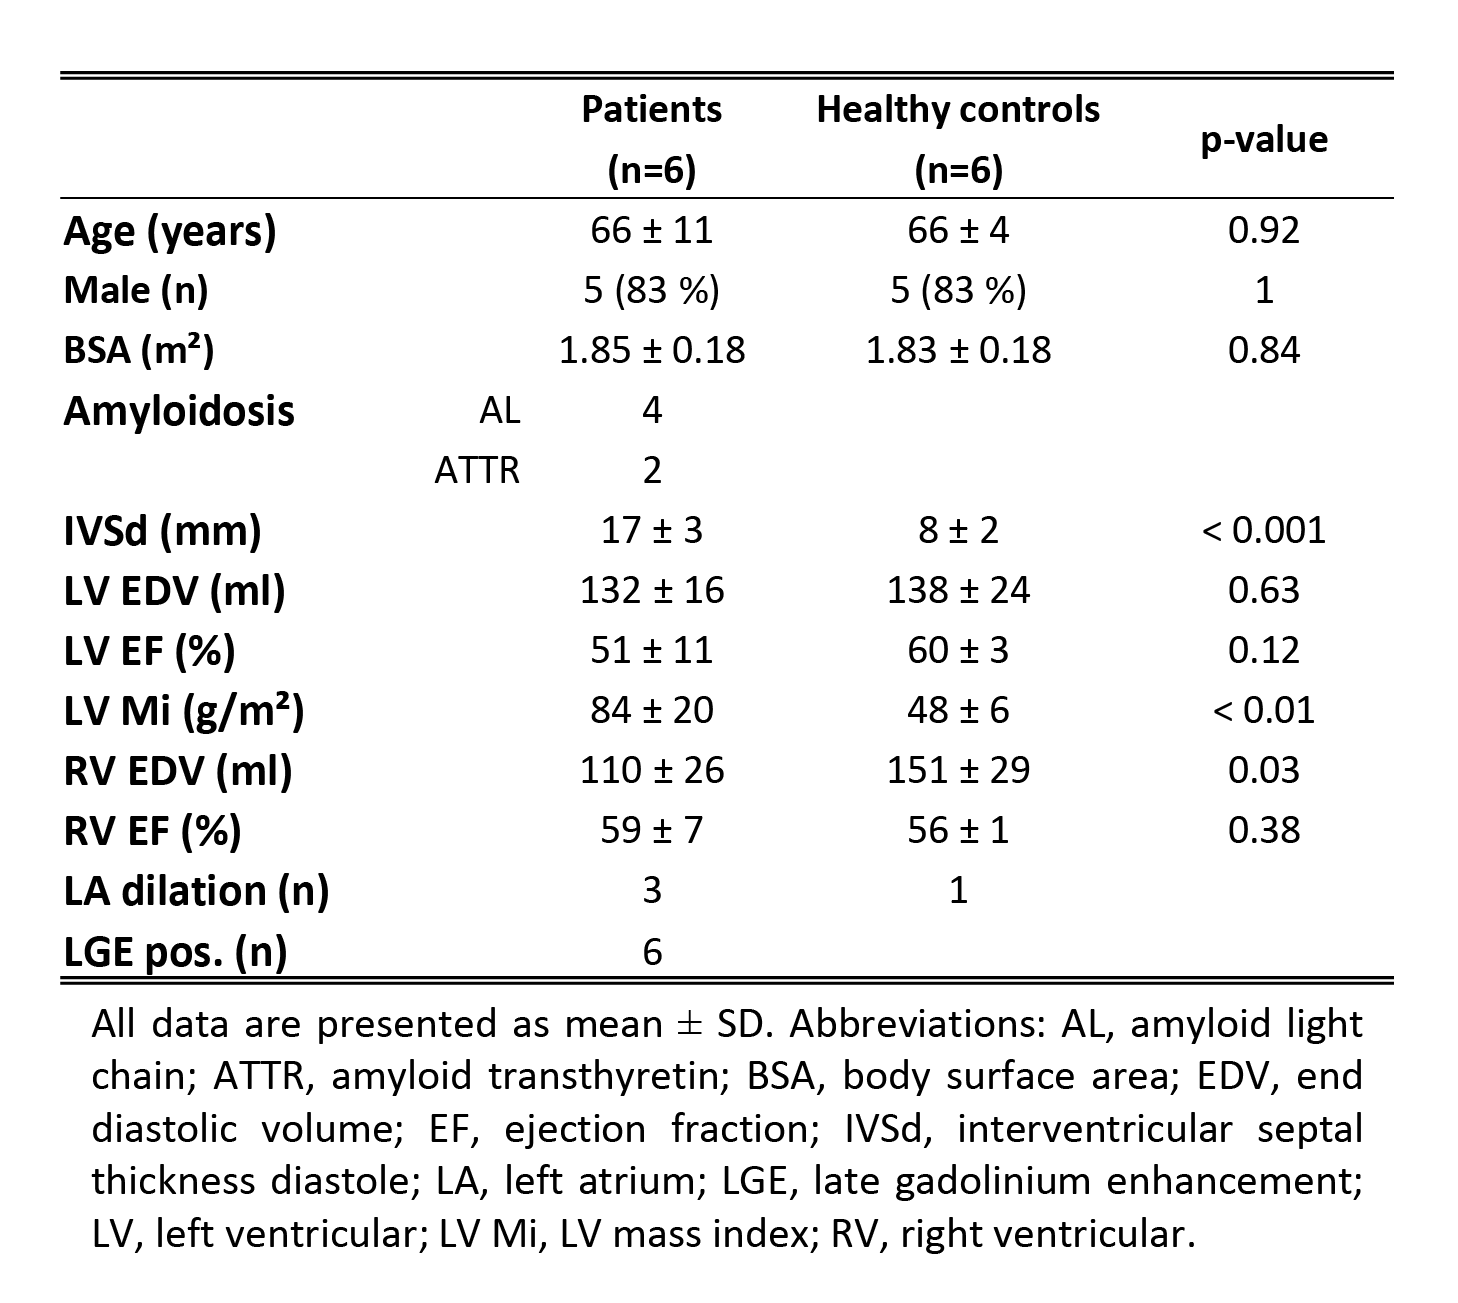
Four patients with amyloid light-chain (AL) amyloidosis and two patients with transthyretin-associated amyloidosis (ATTR) were studied using a diffusion-weighed second-order motion compensated spin-echo (SE) sequence (1) on a 1.5T Philips Achieva system (Philips Healthcare, Best, The Netherlands) equipped with a 5 channel coil. Six age-matched healthy volunteers were enrolled as controls (cf Table 1 for baseline characteristics). The study protocol was approved by the local ethics committee and written informed consent according to institutional guidelines was obtained prior to imaging.
Cardiac function was assessed by a contiguous stack of short-axis cine images covering the left ventricle (LV) (spatial resolution:1.6x1.6x8mm3). Diffusion imaging was ECG-triggered to mid-systole and three imaging planes were placed in short-axis view orientation at apical, mid-ventricular and basal level. Diffusion weighting was encoded along 9 and 3 directions with b=450 and 100s/mm2, respectively (9). Data acquisition was performed during free breathing with navigator based slice tracking (10). The imaging parameters were: resolution:2.5×2.5x8mm3, FOV:230×98mm2, TE/TR:67ms/3-R-R, number of signal averages:8.
T1 mapping was performed at the same slice location as the diffusion scans using a modified look-locker inversion recovery (MOLLI) technique (11). In all subjects native T1 mapping was performed and repeated in the patients 15min after a bolus injection of 0.2mmol/kg gadolinium-based contrast agent (Gadovist, Bayer Schering, Germany). The imaging parameters were: TE/TR:1.0/2.5ms, flip angle:35°, resolution:2.2×2.2x8mm3, FOV:320×320mm2. Late gadolinium enhancement (LGE) images were acquired with an inversion-recovery sequence (resolution:1.6×1.6x10mm3, FOV:360×460mm2, TE/TR:1.7ms/3.5ms) approximately 10min after the bolus injection. The haematocrit was measured in all patients.
Prior to diffusion tensor calculation and T1 fitting, geometric consistency was ensured by image registration (12). DTI analysis was performed on mean diffusivity (MD), fractional anisotropy (FA), helix, transverse and E2A sheet angle (HA, TA, SA) (5). The linear regression of the transmural HA distribution was calculated. Diffusion and relaxation parameters were evaluated in 4 sectors of the LV at the mid-ventricular level. Differences between both groups were assessed by unpaired two-tailed t-tests.
Results
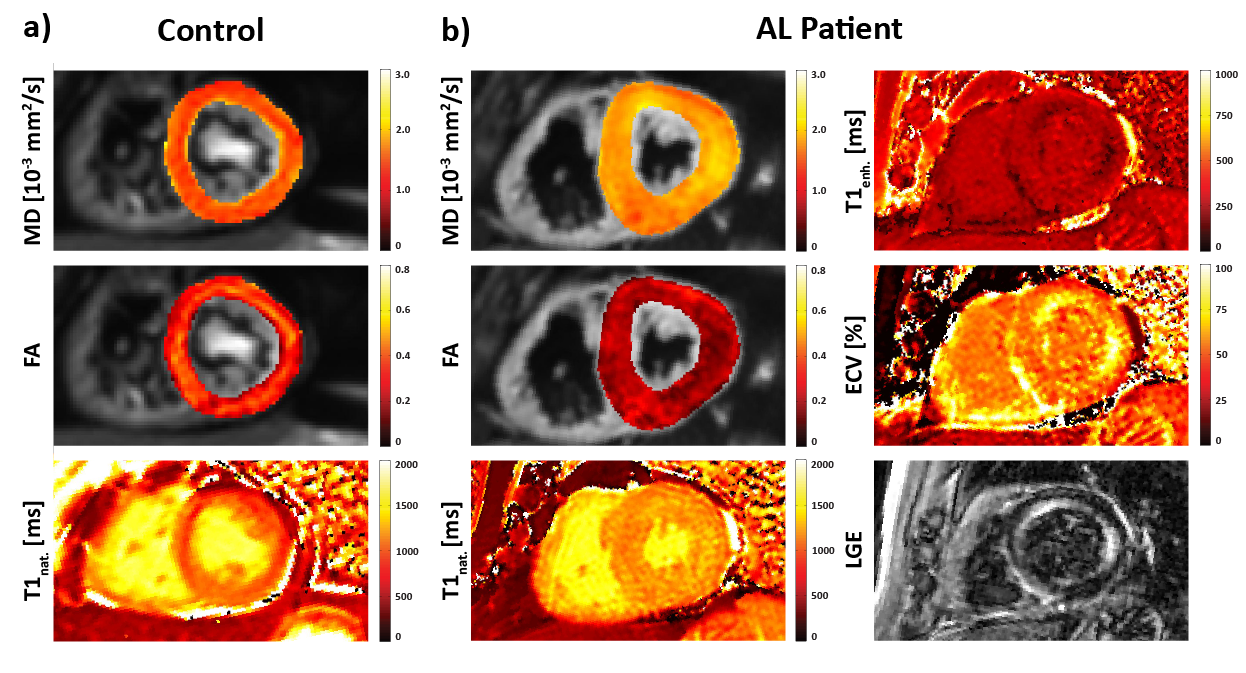
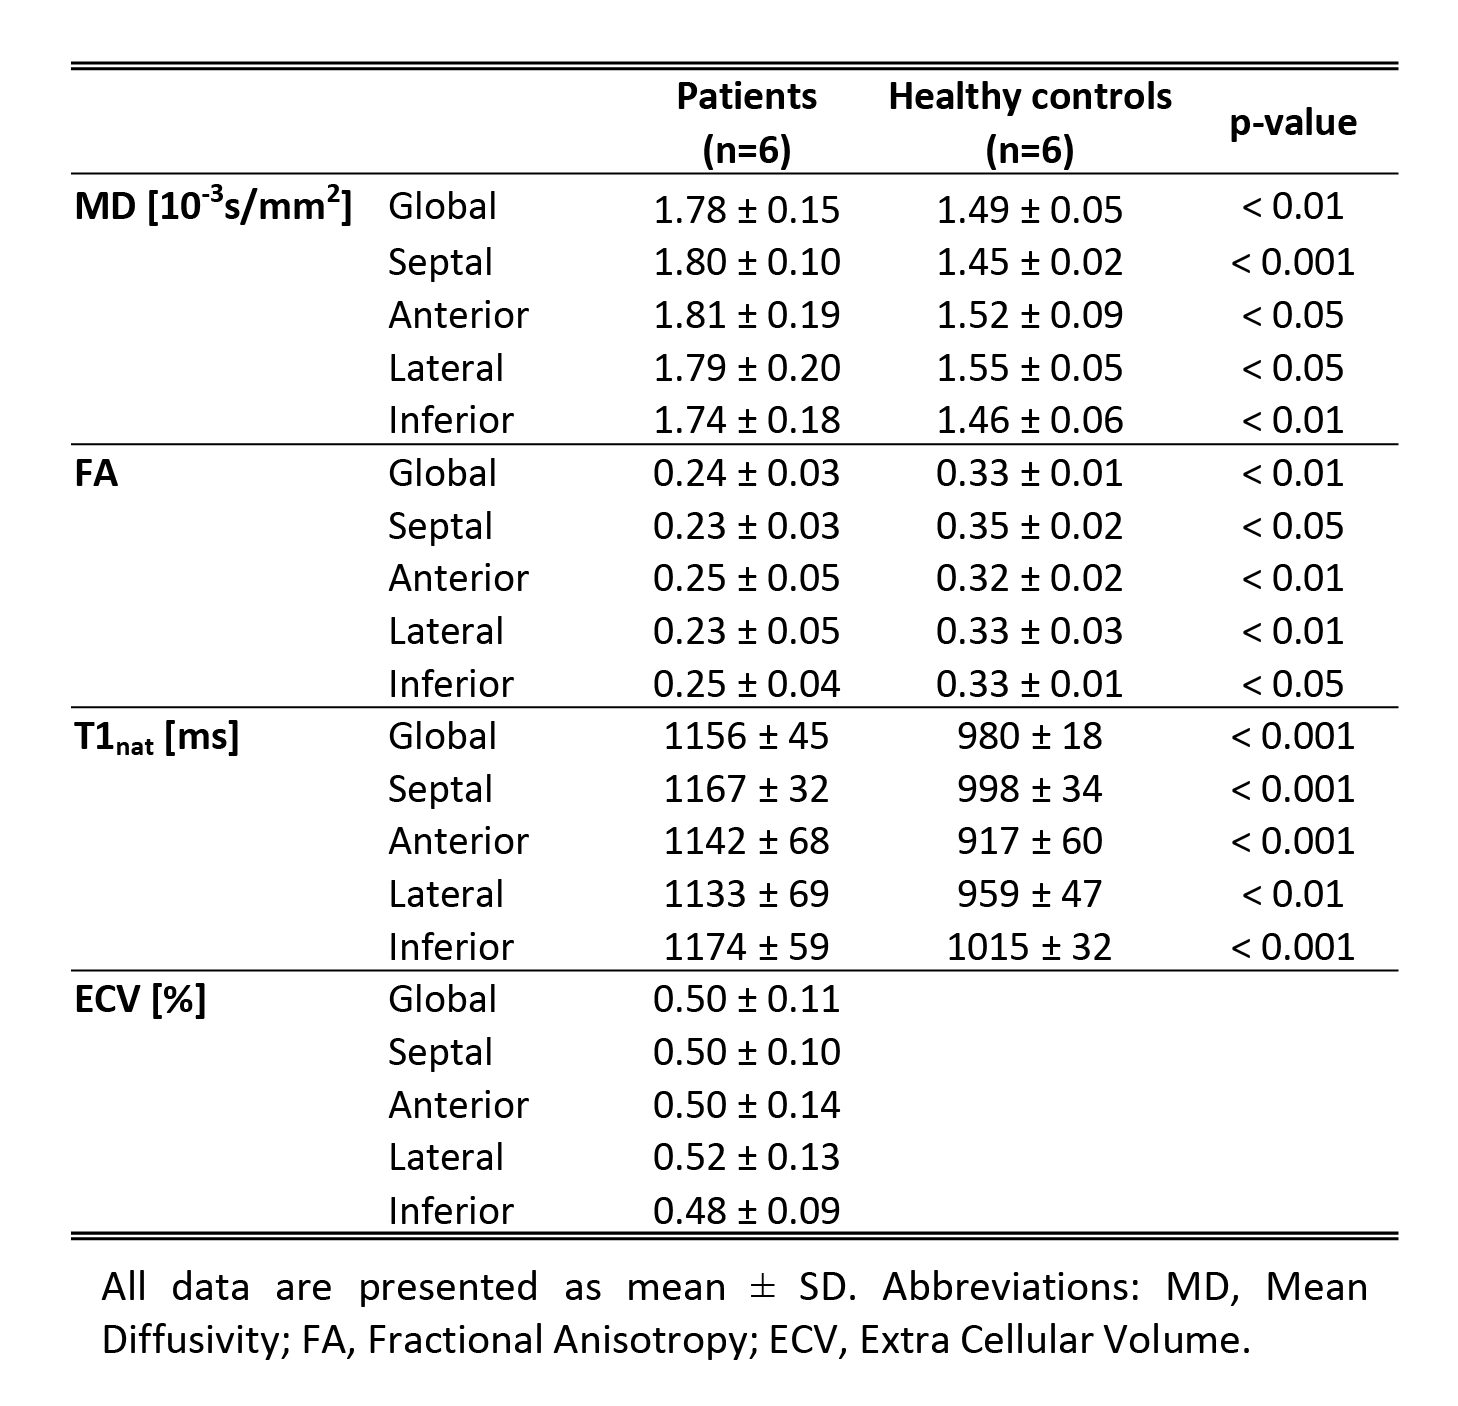
Figure 1 compares MD, FA and T1native maps in an AL amyloidosis patient relative to data of a control. Increased MD, T1native and reduced FA can be observed in the AL case with corresponding regions of elevated ECV and signal enhancement in the LGE. Table 2 summarizes the results for MD, FA, T1native and ECV for both cohorts. MD and T1native were found to be significantly increased in the patients, whereas FA was significantly reduced.
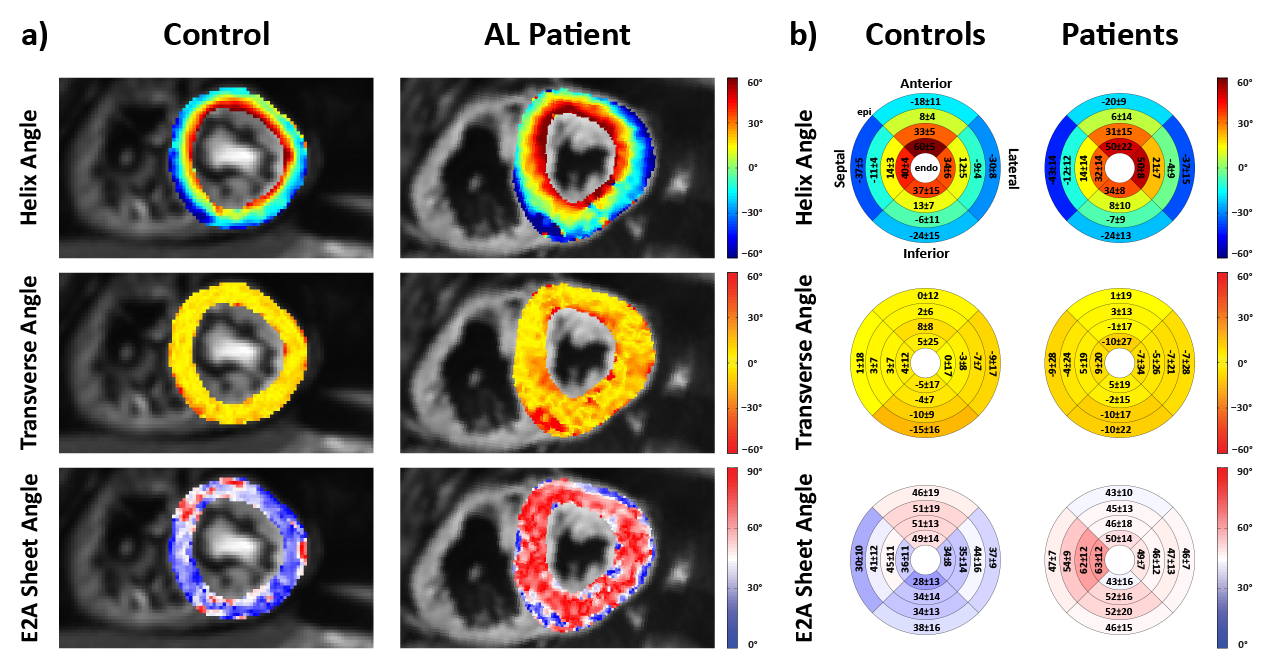
Example angulation maps are shown in Figure 2a. While the helical configuration is comparable between control and patient, TA variability and SA are increased in the amyloidosis patient. Figure 2b) summarizes HA, TA and SA for both populations. No significant difference was seen in the HA slope (-1.10±0.15°/%trans. depth vs. -1.16±0.23°/%trans. depth, p=0.64). TA were close to 0° with significantly increased standard deviation in the patients (-1.7±12.0° vs. -3.3±21.7°, p<0.05). On average, patient SA are increased by approximately 10° (39.7±7.6 vs. 49.4±9.5, p=0.11).
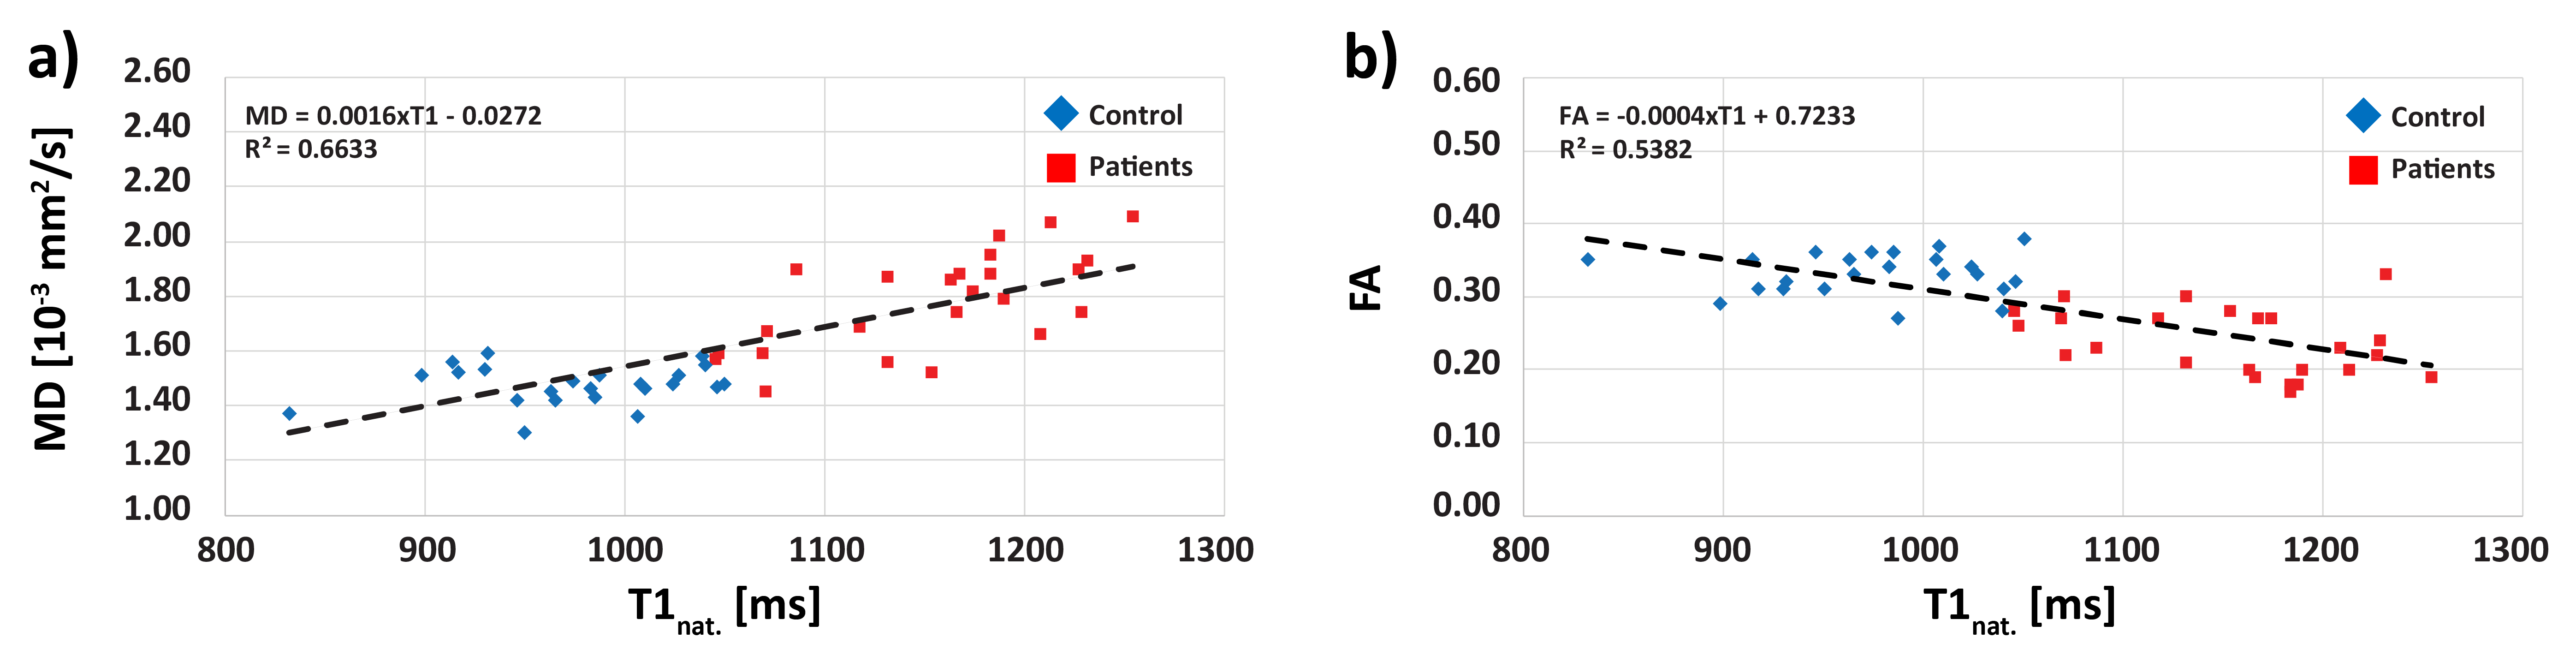
The correlations of MD and FA against T1native are shown in Figure 3a and b. There is a trend towards higher/lower MD/FA with increased T1native, respectively.
Discussion
In vivo cardiac DTI has successfully been applied to assess myofibre orientations in cardiac amyloidosis patients and healthy controls. A significantly increased TA variability and MD with reduced FA indicate myocardial degeneration where water can diffuse more freely. Similar results have been found in dilated and hypertrophic hearts (5,8). Elevated T1native and ECV values support the hypothesis of a reduction in myocardial integrity (13).
The HA configuration was comparable between both groups and the mean SA in the patients were found to be increased compared to the controls. LV wall thickness and mass indicate cardiac hypertrophy in the patients which is in accordance with SA observations in HCM patients using dual-phase DTI (5). T1native was found to be significantly increased in the patients as described previously (14) and a good correlation of MD, FA and T1native was seen.
In vivo cardiac diffusion imaging may be used to probe the degeneration process in cardiac diseases non-invasively and has the potential to extend native T1 mapping as contrast agent free tool for characterizing cardiac involvement in amyloidosis patients.
CvD and AG contributed equally to this work.
Acknowledgements
No acknowledgement found.References
1. Stoeck CT, et al. Second-order motion-compensated spin echo diffusion tensor imaging of the human heart. Magn Reson Med. 2016 Apr;75(4):1669-76
2. Edelman RR, et al. In vivo measurement of water diffusion in the human heart. Magn Reson Med. 1994;32(3):423–8.
3. Nielles-Vallespin S, et al. In vivo diffusion tensor MRI of the human heart: Reproducibility of breath-hold and navigator-based approaches. Magn Reson Med. 2013;70(2):454–65.
4. Nguyen CT, et al. In vivo diffusion-weighted MRI detection of myocardial fibrosis in hypertrophic cardiomyopathy patients. J Cardiovasc Magn Reson. 2015;17(Suppl 1):P34.
5. Ferreira P, et al. In vivo cardiovascular magnetic resonance diffusion tensor imaging shows evidence of abnormal myocardial laminar orientations and mobility in hypertrophic cardiomyopathy. J Cardiovasc Magn Reson. 2014;16(Suppl 1):P338.
6. Tseng WI, et al. Imaging myocardial fiber disarray and intramural strain hypokinesis in hypertrophic cardiomyopathy with MRI. J Magn Reson imaging. 2006;23(1):1–8.
7. McGill LA, et al. Reproducibility of in-vivo diffusion tensor cardiovascular magnetic resonance in hypertrophic cardiomyopathy. J Cardiovasc Magn Reson. 2012;14:86
8. von Deuster C, et al. Studying Dynamic Myofiber Aggregate Reorientation in Dilated Cardiomyopathy Using in Vivo Magnetic Resonance Diffusion Tensor Imaging. Circ Cardiovasc Imaging. 2016;9(10).
9. von Deuster C, et al. S. Spin echo versus stimulated echo diffusion tensor imaging of the in vivo human heart. Magn Reson Med. 2016 Sep;76(3):862-72
10. Moulin K, et al. In-vivo free-breathing DTI & IVIM of the whole human heart using a real-time slice-followed SE-EPI navigator-based sequence : a reproducibility study in healthy volunteers. Magn Reson Med. 2016 Jul;76(1):70-82
11. Messroghli DR, et al. Modified Look-Locker inversion recovery (MOLLI) for high-resolution T1 mapping of the heart. Magn Reson Med. 2004;52(1):141–6.
12. Vishnevskiy V, et al. Isotropic Total Variation Regularization of Displacements in Parametric Image Registration. IEEE Trans Med Imaging. 2016;62(c):1–1.
13. Kellman P, et al. Extracellular volume fraction mapping in the myocardium, part 1: evaluation of an automated method. J Cardiovasc Magn Reson. 2012;14(1):64.
14. Fontana M, et al. Native T1 mapping in transthyretin amyloidosis. JACC Cardiovasc Imaging. 2014;7(2):157–65.
Figures