0283
Myocardial T2 mapping using a Black-blood hEart-rate Adaptive T2-prepared bSSFP (BEATS) sequence1Department of Medicine (Cardiovascular Division), Beth Israel Deaconess Medical Center and Harvard Medical School, Boston, MA, United States, 2Academy for Advanced Interdisciplinary Studies, Peking University, Beijing, China, 3Department of Computer Science, Technical University of Munich, Munich, Germany, 4Biomedical Engineering Department, Cairo University, Giza, Egypt, 5Department of Radiology, Peking University First Hospital, Beijing, China, 6Department of Radiology, Beth Israel Deaconess Medical Center and Harvard Medical School, Boston, MA, United States
Synopsis
Quantification of T2 in areas bordering myocardium and blood pool is challenging due to partial volume errors. Blood signal suppression would effectively reduce partial volume effects and improve image contrast at the blood-myocardium boundaries. This study proposed a Black-blood hEart-rate Adaptive T2-prepared bSSFP (BEATS) sequence for myocardial T2 mapping to improve blood-myocardial border definition. Both phantom and in vivo studies proved the advantages of BEATS sequence compared to T2prep-bSSFP T2 mapping. The proposed BEATS sequence efficiently suppresses the blood signal, resulting in better definition of blood/myocardium border by reducing the impact of partial volume effect in T2 measurements, which improves the assessment of edema post myocardial infarction.
Introduction
T2 mapping is a quantitative technique that has emerged as a reproducible approach to accurately measure myocardial T2 relaxation time (1-4). However, quantification of T2 in areas bordering myocardium and blood pool is challenging due to partial volume errors.Purpose
Materials and Methods
Pulse Sequence
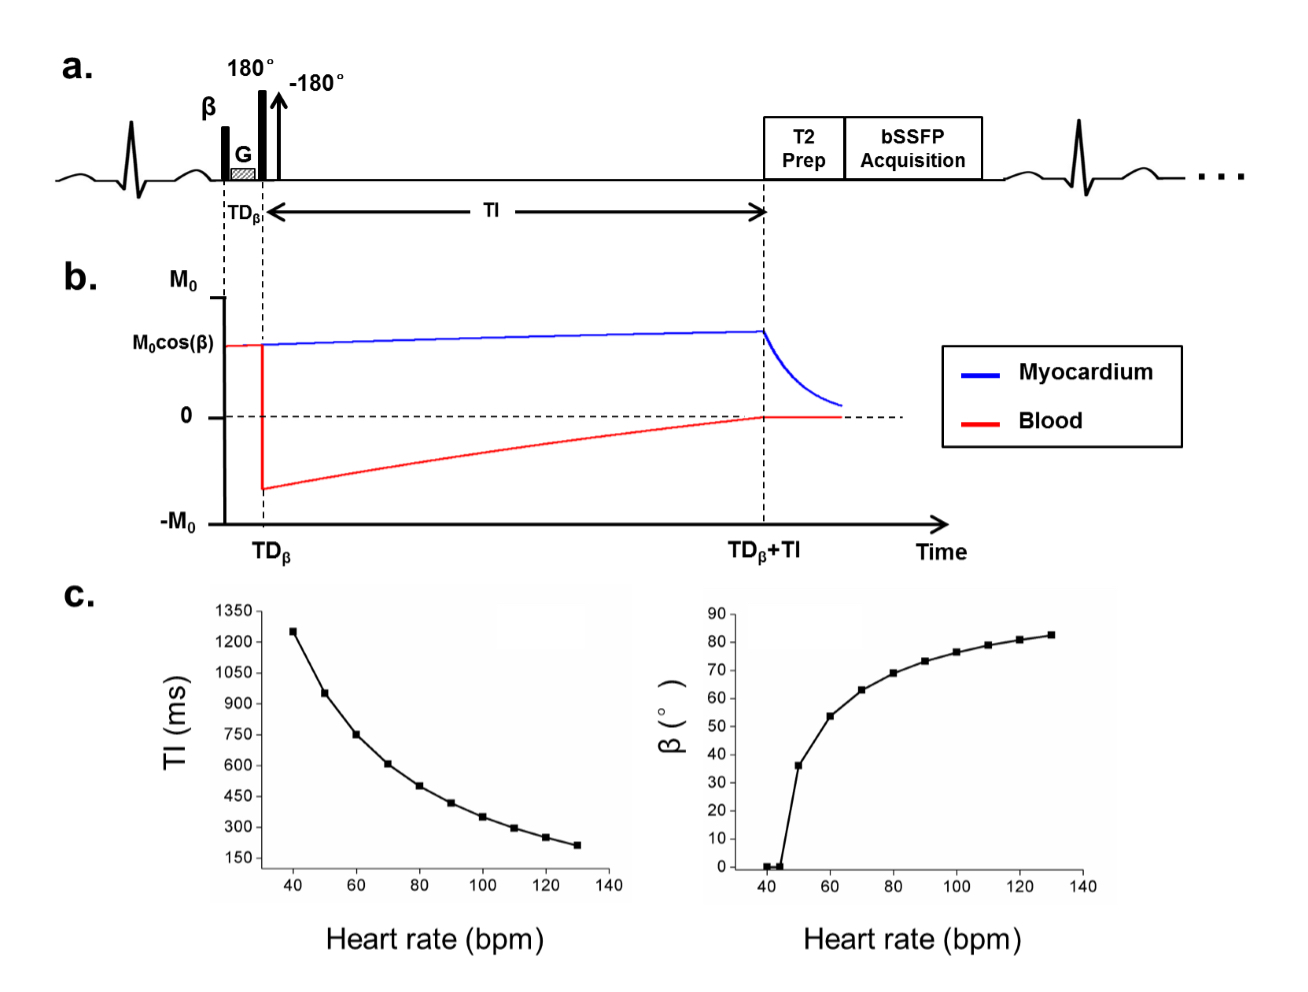
The proposed BEATS sequence (Fig.1) consists of three preparation pulses: a) pre-excitation non-selective pulse with adaptive flip angle of β, b) DIR pulses, c) T2prep pulses. For each subject, β is adaptively changed according to Eq.[1] to make sure that blood signal is fully suppressed.
$$ \beta =\arccos(1+e^{-TD_\beta/T1_{blood}}\cdot(e^{-TI/T1_{blood}}-2)) $$ [1]
where TDβ is the duration between pre-excitation pulse and nonselective 180° pulse, T1blood is the blood T1, TI is the delay time between nonselective 180° pulse and the T2prep pulses.
Numerical Simulations
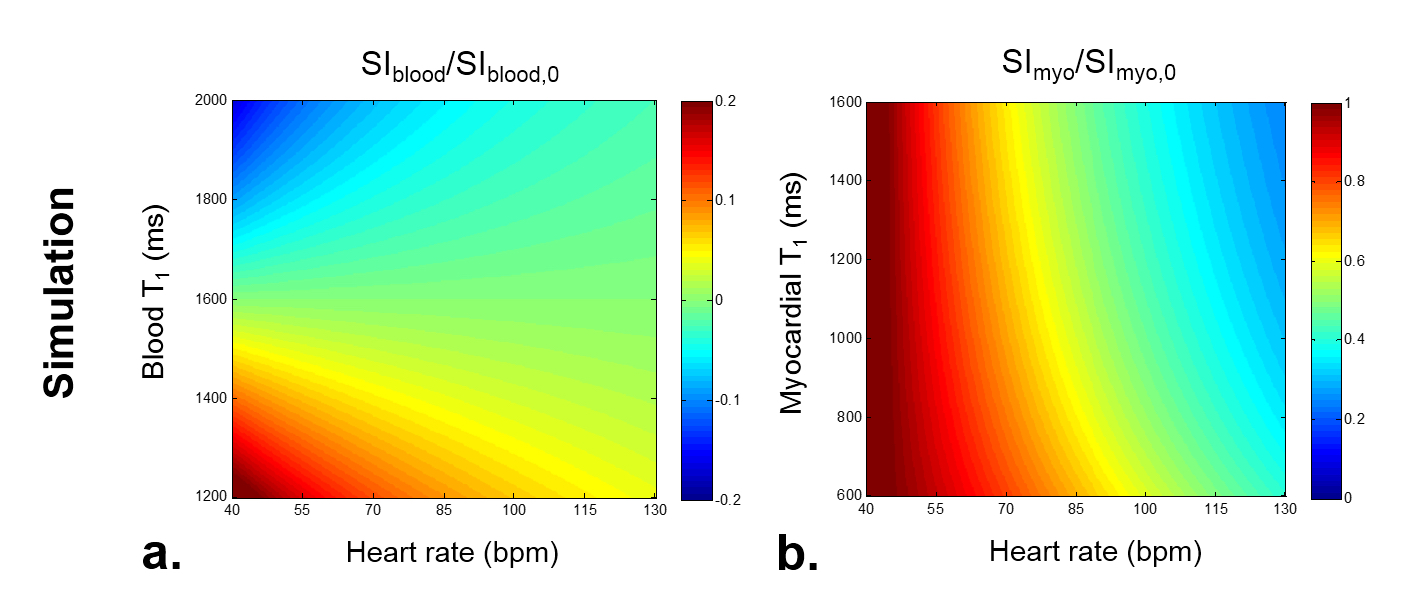
Bloch simulation was conducted to investigate the influence of heart rate and the blood T1 relaxation time on the efficiency of blood suppression in BEATS sequence. Heart rates were simulated with a range from 40 bpm to 130 bpm, while blood and myocardial T1 values were simulated with a range from 1200 ms to 2000 ms and from 600 ms to 1600 ms, respectively.
Phantom Study
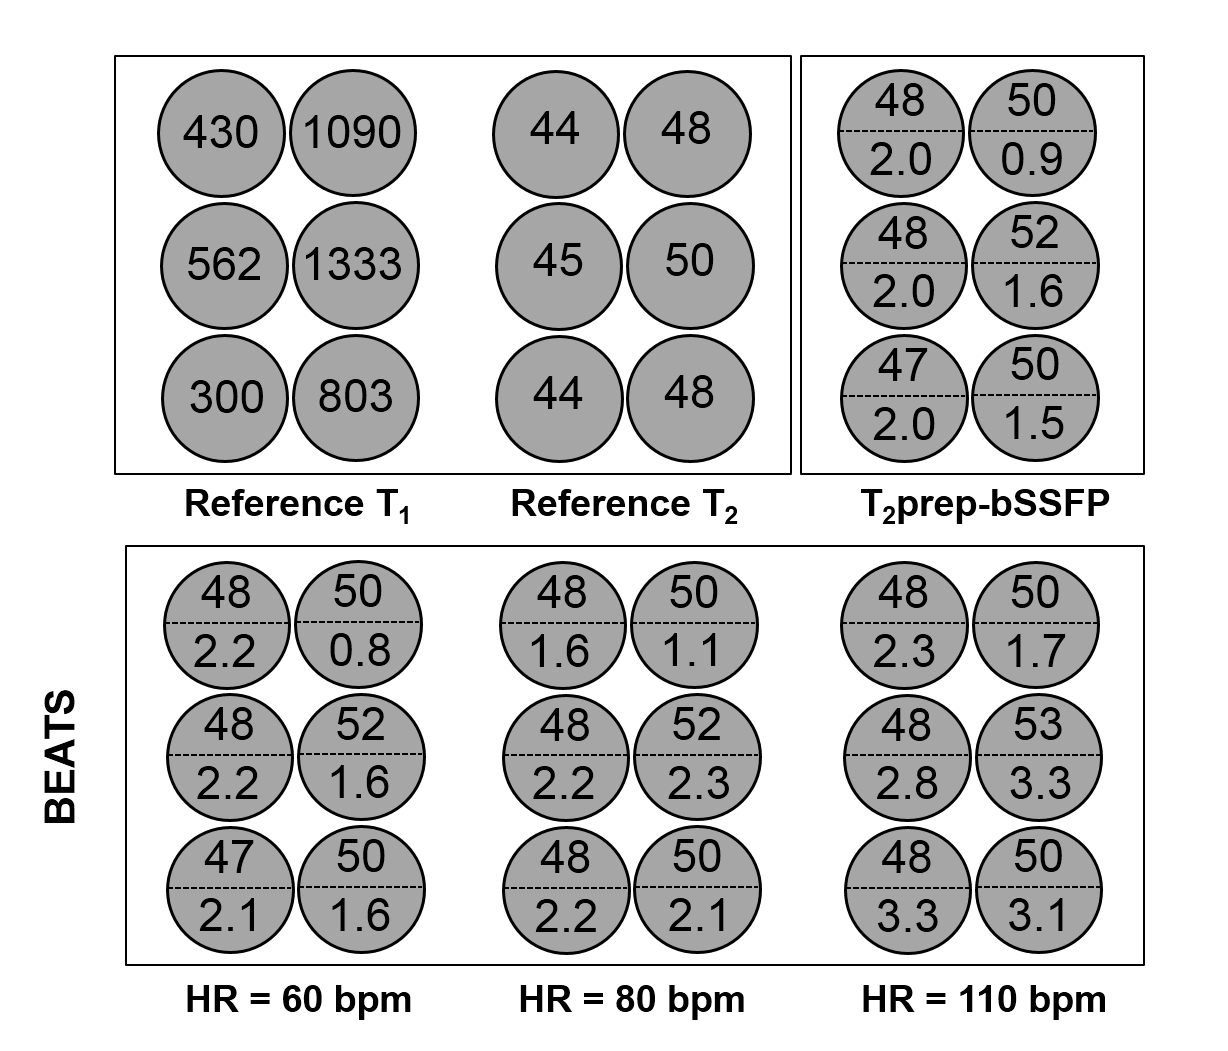
All scans were performed on 1.5T Philips Achieva system (Philips Healthcare). Phantom scans were performed on 6 NiCl2 doped agarose vials. Scanning parameters were: FOV = 320 × 320 mm2, in-plane resolution = 2 × 2 mm2, slice thickness = 8 mm, bSSFP readout with TR/TE = 2.8/1.4 ms, flip angle = 60°, and acquisition window = 150 ms.
In vivo Study
In vivo study was performed in 8 healthy subjects (26.0 ± 4.7 years). Sequence parameters were: FOV = 320 × 320 mm2, in-plane resolution = 2 × 2 mm2, slice number = 3, slice thickness/gap = 8/4 mm, TR/TE = 2.8/1.4 ms, flip angle = 60°, and 9 T2prep echo times including TET2prep = 0, 25, 35, 45, 55, 65, 75, 85, 95, ∞ ms.
Ischemia-reperfusion mediated myocardial infarction (MI) was induced in Yorkshire swine (N = 3) by 180-minutes balloon occlusion of the mid left anterior descending (LAD) artery as previously described (5). The imaging for swine was carried out using the same scanning parameters as humans.
Data Analysis
A three-parameter fitting model (6) was applied for pixel-wise T2 quantification. Segment-based analysis was performed to investigate the regional variations of T2 measurements.
Results
Numerical Simulation
Simulation shows that both heart rate and blood/myocardial T1 relaxation time influence the blood suppression and myocardial signal recovery (Fig.2). But the residual blood signal after inversion recovery maintained within 22.7% of original blood signal for a wide range of simulated blood T1 values from 1200 ms to 2000 ms.
Phantom Results
T2 measurements from BEATS were not affected by increased heart rates in a range from 60 bpm to 110 bpm, but higher heart rate decreases the precisions (Fig.3). Good repeatability was achieved for the BEATS T2 mapping as measured by the standard deviations over repeated scans (0.29 ms, 0.35 ms, 0.35 ms, 0.29 ms, 0.42 ms for heart rate of 60, 70, 80, 90, 100 bpm, respectively).
In vivo Study
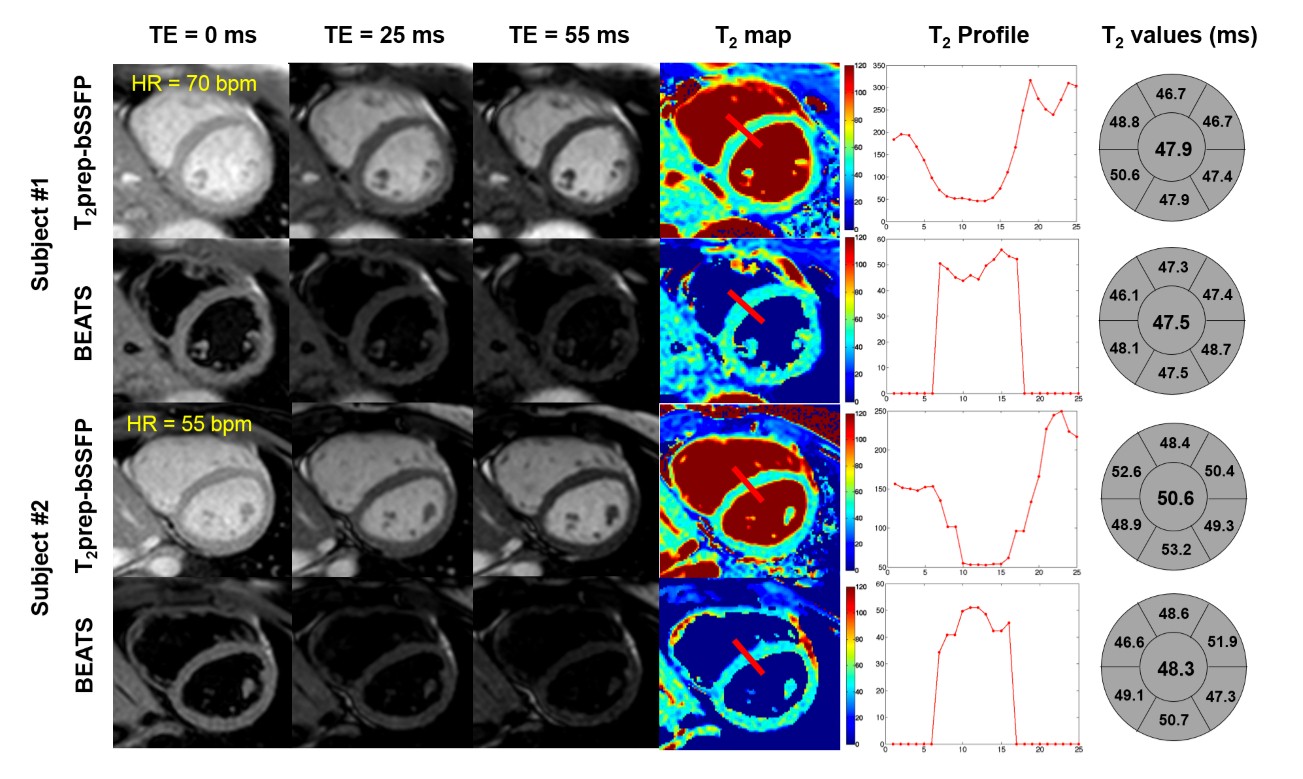
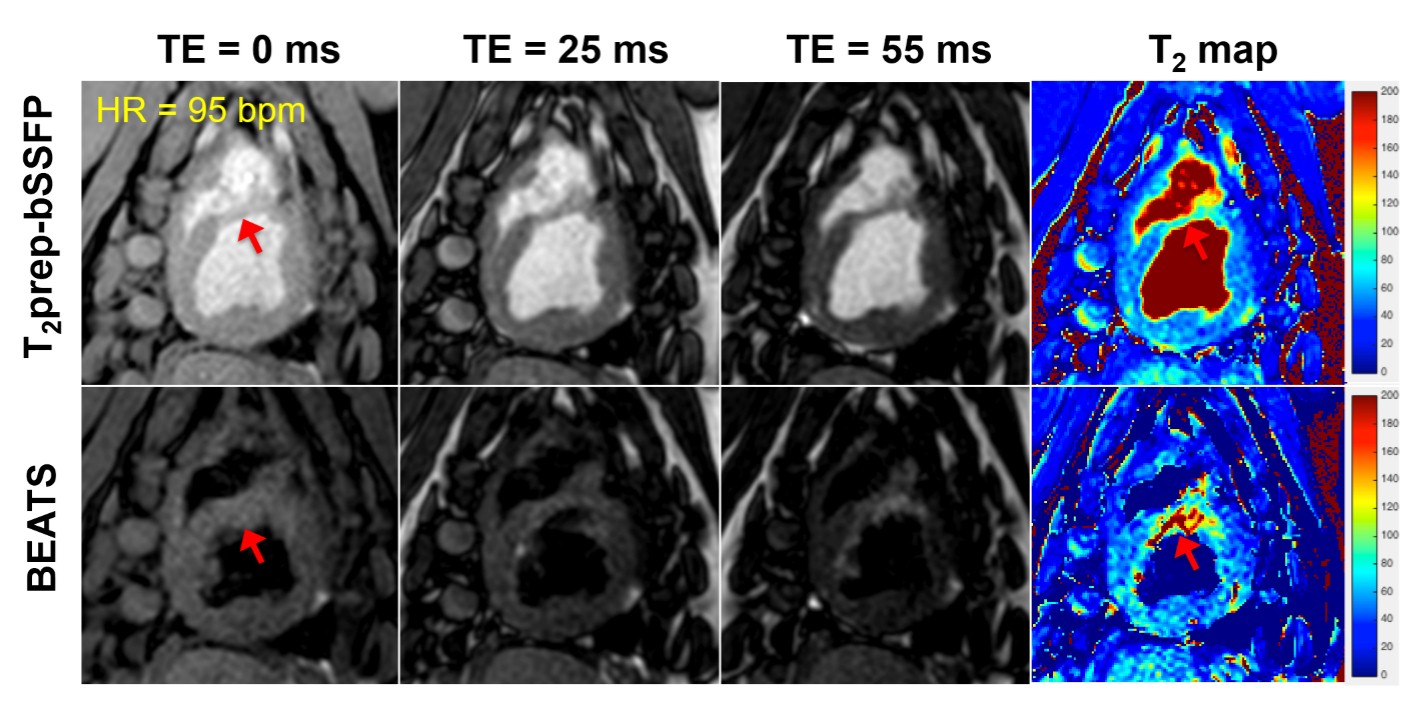
For human study, the blood to myocardial signal ratio was reduced from 3.21 ± 0.93 to 0.15 ± 0.03 by the BEATS sequence (P < 0.05) (Fig.4). The BEATS T2 profiles have a much sharper transition between blood and myocardium compared to that in conventional T2prep-bSSFP T2 maps (Fig.5). Bullseye analysis showed no significant difference between conventional T2prep-bSSFP T2 mapping and the proposed BEATS T2 mapping for segmental T2 values (P = 0.70, 0.88, 0.28, 0.26, 0.90 and 0.47 for each segments) and repeatability (P = 0.17, 0.43, 0.78, 0.72, 0.57 and 0.49 for each segments). However, there was an expected decrease in precision for BEATS (standard deviation of 7.77 vs 5.36 ms, P < 0.05; 5.34 vs 4.30 ms, P = 0.05; 7.08 vs 5.09 ms, P = 0.02; 7.28 vs 5.76 ms, P = 0.02; 7.38 vs 6.60 ms, P = 0.10; 7.05 vs 5.61 ms, P < 0.05 for each segment).
MI with edema was observed in both T2prep-bSSFP and BEATS T2 maps (Fig.5, red arrows). However, the extent of edema was better depicted in the BEATS images and T2 maps due to the suppression of blood signal.
Conclusion
Acknowledgements
No acknowledgement found.References
1. Verhaert D, Thavendiranathan P, Giri S, Mihai G, Rajagopalan S, Simonetti OP, Raman SV. Direct T2 quantification of myocardial edema in acute ischemic injury. JACC: Cardiovascular Imaging 2011;4(3):269-278.
2. Van Heeswijk RB, Feliciano H, Bongard C, Bonanno G, Coppo S, Lauriers N, Locca D, Schwitter J, Stuber M. Free-breathing 3 T magnetic resonance T2-mapping of the heart. JACC: Cardiovascular Imaging 2012;5(12):1231-1239.
3. Bano W, Feliciano H, Coristine AJ, Stuber M, van Heeswijk RB. On the accuracy and precision of cardiac magnetic resonance T2 mapping: A high‐resolution radial study using adiabatic T2 preparation at 3 T. Magnetic resonance in medicine 2017, 77(1): 159-169.
4. Giri S, Shah S, Xue H, Chung YC, Pennell ML, Guehring J, Zuehlsdorff S, Raman SV, Simonetti OP. Myocardial T2 mapping with respiratory navigator and automatic nonrigid motion correction. Magnetic resonance in medicine 2012;68(5):1570-1578.
5. Tschabrunn CM, Roujol S, Nezafat R, Faulkner-Jones B, Buxton AE, Josephson ME, Anter E. A swine model of infarct-related reentrant ventricular tachycardia: electroanatomic, magnetic resonance, and histopathological characterization. Heart Rhythm 2016;13:262-273.
6. Akçakaya M, Basha TA, Weingärtner S, Roujol S, Berg S, Nezafat R. Improved quantitative myocardial T2 mapping: impact of the fitting model. Magnetic resonance in medicine 2015;74(1):93-105.
Figures