0282
Magnetic susceptibility of hemorrhagic myocardial infarction: correlation with tissue iron and comparison with relaxation time MRI1Bioengineering, University of Pennsylvania, Philadelphia, PA, United States, 2Radiology, Perelman School of Medicine, University of Pennsylvania, Philadelphia, PA, United States, 3Biophysics, University of Pennsylvania, Philadelphia, PA, United States, 4Biochemistry and Biophysics, University of Pennsylvania, Philadelphia, PA, United States, 5Surgery, Perelman School of Medicine, University of Pennsylvania, Philadelphia, PA, United States, 6Surgery, Columbia University, New York City, NY, United States
Synopsis
Hemorrhagic myocardial infarction (MI) is a frequent complication of primary percutaneous coronary intervention and independently associated with impaired LV remodeling, function, and arrhythmias. We demonstrate that cardiac quantitative susceptibility mapping (QSM) shows increased susceptibility in infarcts compared to remote myocardium and correlates with iron content and infarct pathophysiology. QSM is a more specific marker of hemorrhagic MI than relaxation time MRI, susceptibility-weighted imaging, and late gadolinium enhanced (LGE) MRI.
Purpose:
Hemorrhagic myocardial infarction (MI) has been reported in 41%1 and 54%2 of ST-elevated MI patients after primary percutaneous coronary intervention. These patients are at high risk for adverse left ventricle (LV) remodeling, impaired LV function and increased risk of fatal arrhythmias1–3. Relaxation time MRI such as T2*-maps are sensitive to hemorrhagic infarct iron content, but are also affected by myocardial edema and fibrosis4. Quantitative Susceptibility Mapping (QSM), which uses the MR signal phase to quantify tissue magnetic susceptibility, may be a more specific and sensitive marker of hemorrhagic MI. The objective of this study was to develop and validate cardiac QSM in a large animal model of myocardial infarction, investigate the association of magnetic susceptibility with iron content and infarct pathophysiology, and compare QSM to relaxation time mapping, susceptibility-weighted imaging (SWI), and late-gadolinium enhanced (LGE) MRI.Methods:
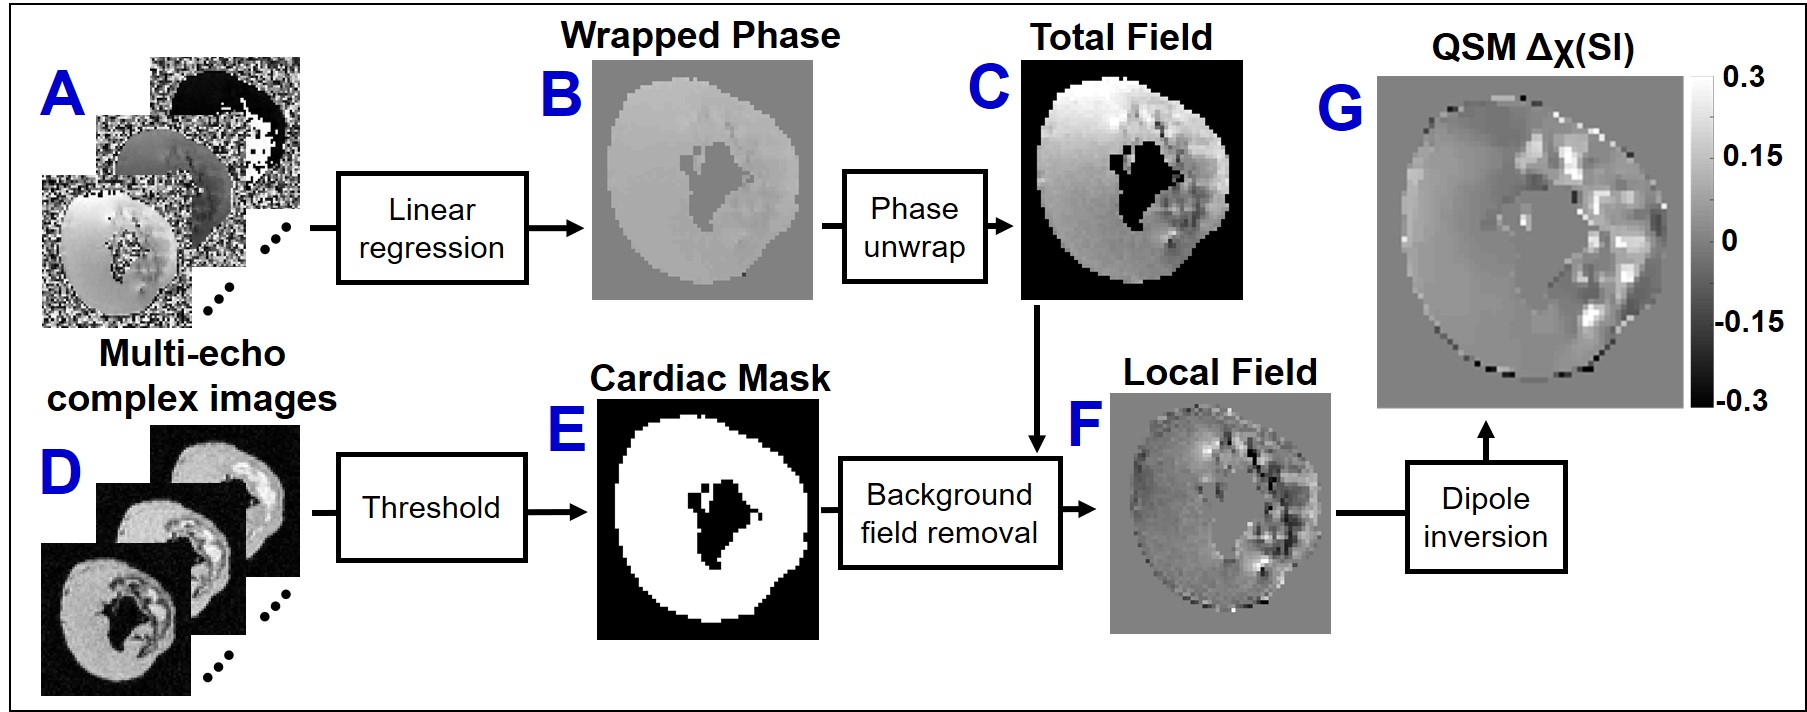
MI was induced by circumflex coronary artery surgical ligation and released after 90 minutes of ischemia (N=3), or permanent ligation (N=2) in male Yorkshire swine. LGE MRI was performed 7 days post-MI using 3D phase-sensitive inversion recovery segmented gradient echo at 3T (Trio, Siemens Healthcare). Afterwards, the animal was sacrificed, the heart was bathed in non-1H magnetic susceptibility-matched fluid (Fomblin), and multi-echo gradient-echo images of whole heart specimens were obtained at 0.2 mm3 isotropic resolution. Additional scan parameters were TR/TEfirst/TElast=42/3.3/38.5 ms, ΔTE=3.2 ms, FA=16 degrees, FOV=17.9×10 cm2, BW=610 Hz/pixel. T2*-maps and SWI images were obtained from T2*-weighted images using standard techniques5,6. As shown in Figure 1, QSM images were reconstructed using the morphology-enabled dipole inversion7,8. Three regions of interest (ROIs) were obtained by T2*-weighted thresholding active contour segmentation (ITK-SNAP, University of Pennsylvania)9 including remote myocardium (“isointense”), peripheral-infarct (“hyperintense”), and core-infarct (“hypointense”). Validation of iron content and fibrosis includes histopathological staining (Prussian Blue, Trichrome) of infarct tissue (2mm slice thickness) and iron concentration was quantified in adjacent slices by inductively coupled plasma atomic emission spectrometry (ICP-AES)10. Statistics included one-way analysis of variance pairwise comparisons between ROIs and student’s t-test comparison between tissue region iron concentrations (results are reported as mean±SD, significance if p<0.05).Results:
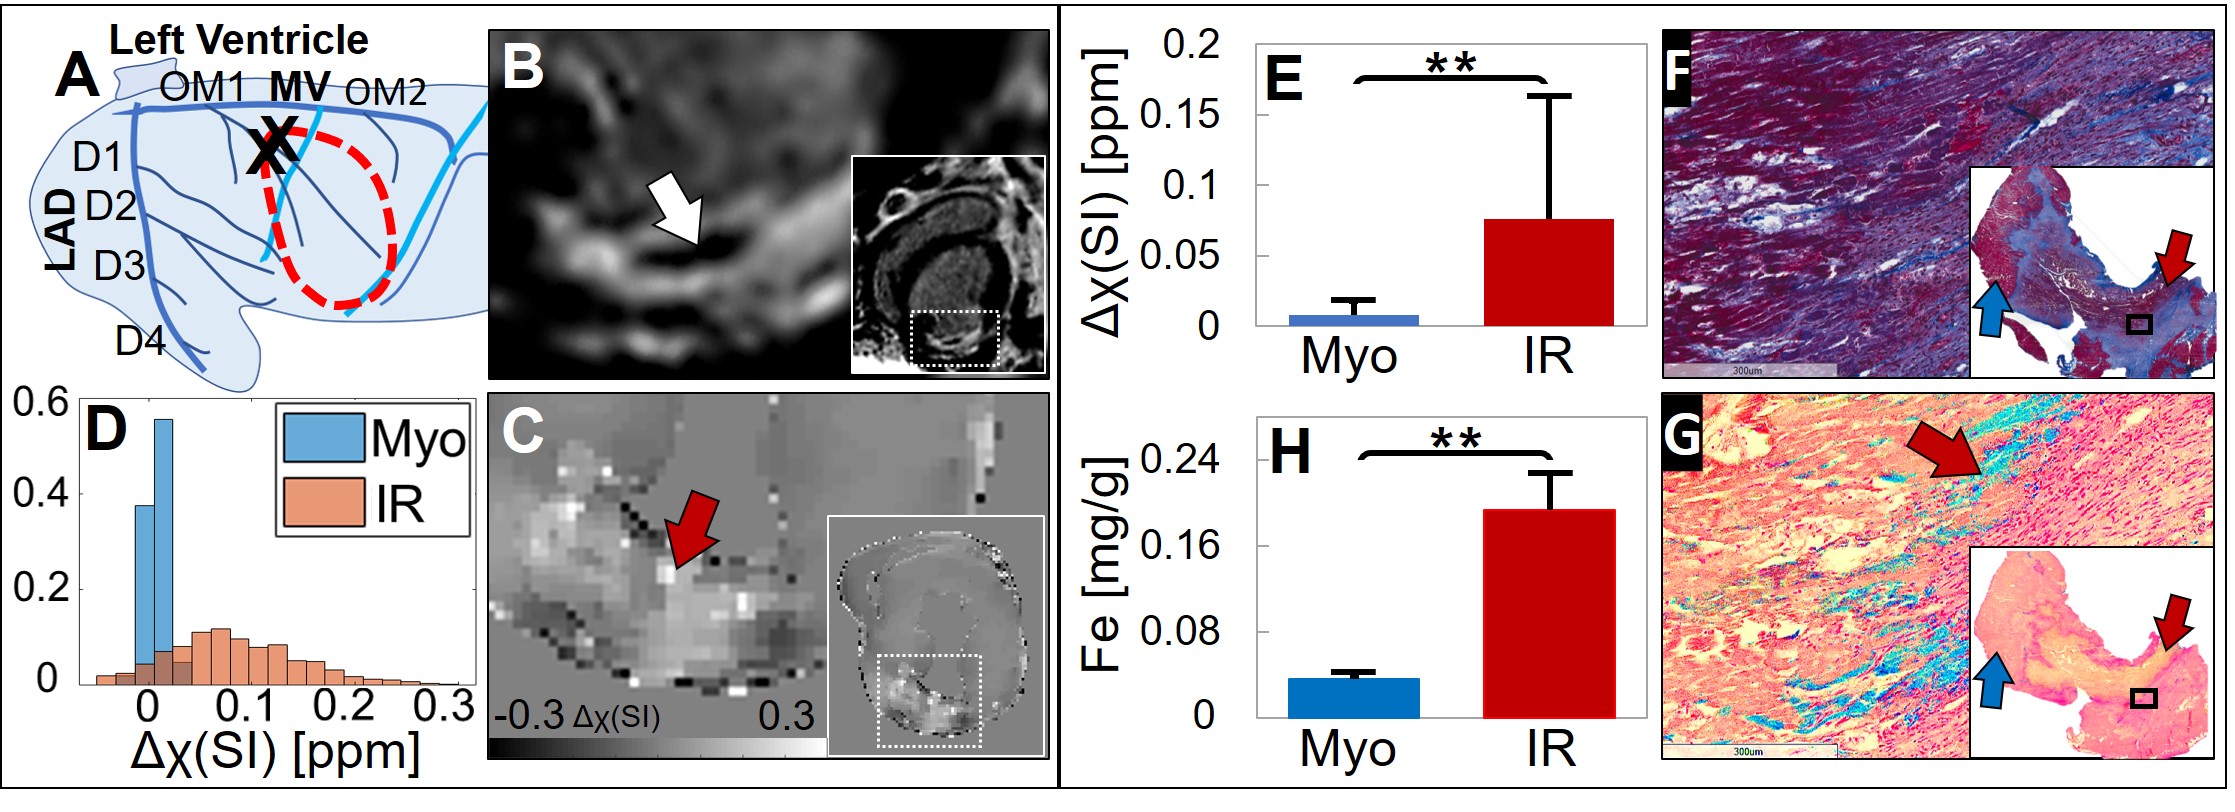
Figure 2 displays results obtained from a reperfused 90 min MI animal. Circumflex artery first branch ligation induced a posterolateral infarct with 20% area-at-risk (Figure 2A). 7 days post-MI, there was a non-transmural infarct and hypointense “core”, a phenotype of microvascular obstruction (Figure 2B). Increased magnetic susceptibility was found in the infarct region (Δχ=0.08±0.09 ppm) compared to remote myocardium (Δχ=0.01±0.01 ppm) (Figure 2C-E). This was associated with elevated iron concentration (infarct samples n=5, [Fe]=0.19±0.03 mg/g vs. remote myocardium samples n=13, [Fe]=0.04±0.003 mg/g) (p<0.001) (Figure 2H). Histology showed extensive extracellular matrix deposition peripheral to non-viable cardiomyocytes (Figure 2F) and substantial iron deposition (Figure 2G).
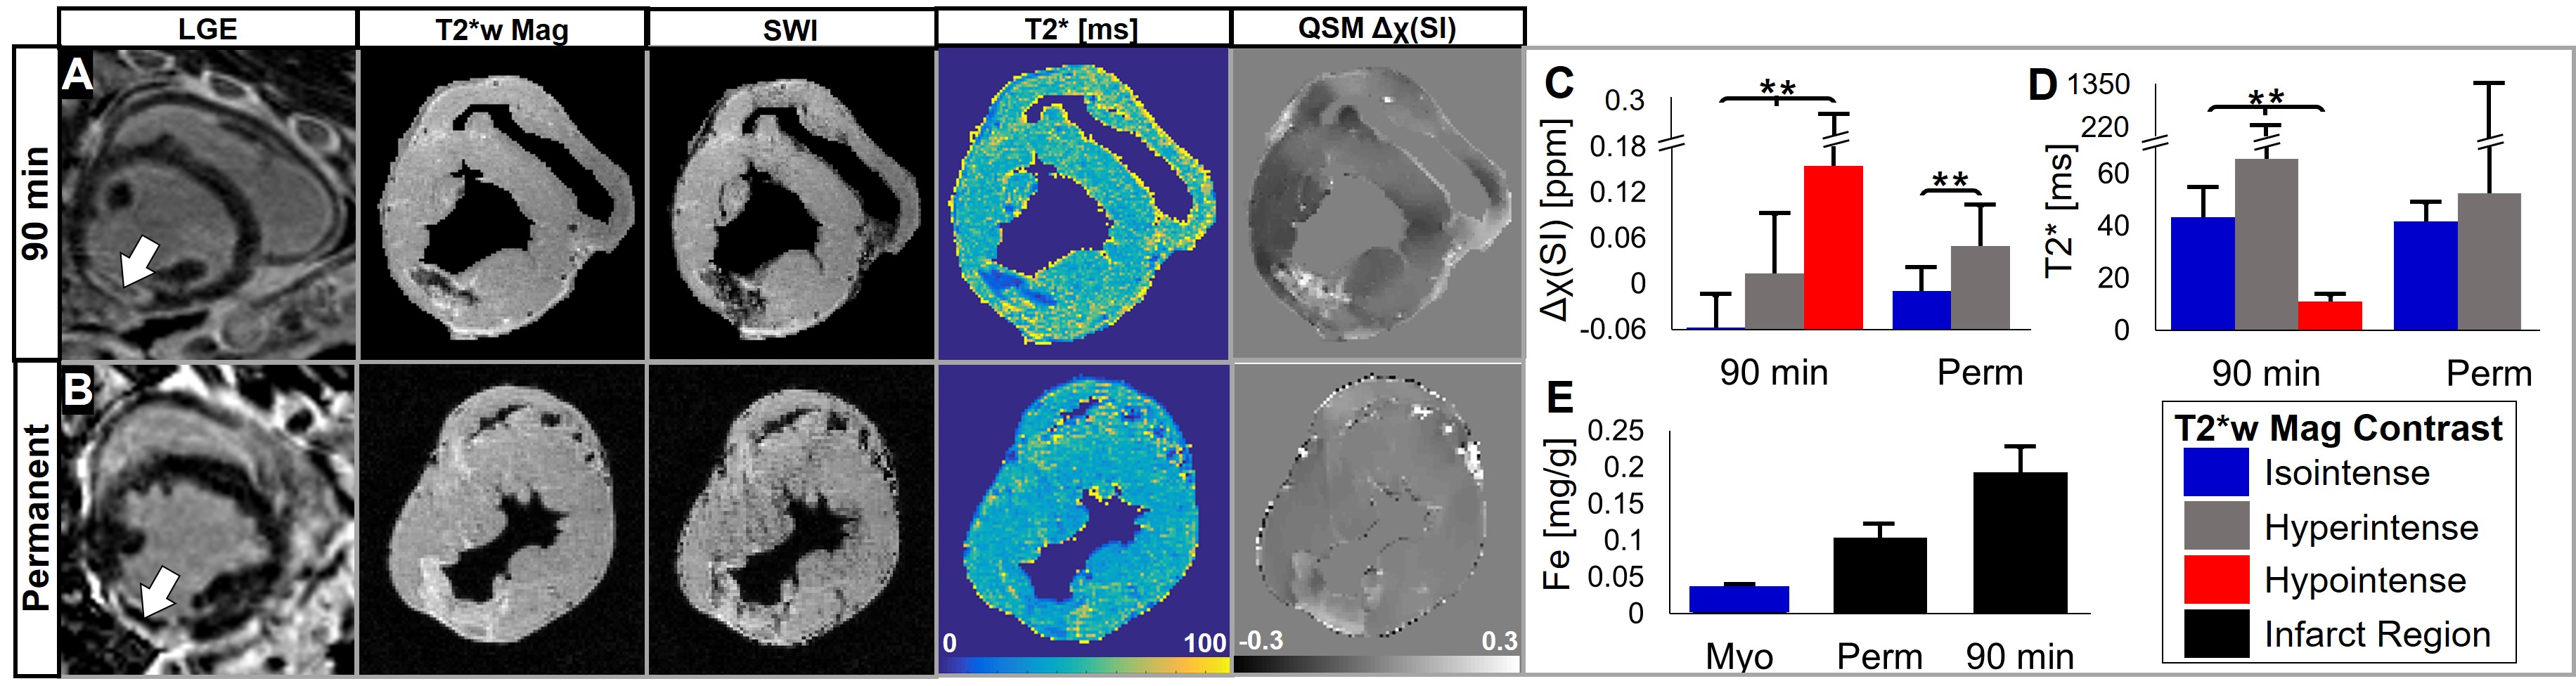
Figure 3A,B displays T2*-maps, SWI and QSM images at the same imaging location of posterolateral non-transmural 90 min and transmural permanent MI. Both infarcts had LGE hypointense cores. T2*-weighted, T2*-maps and SWI show hypointense regions for 90 min MI. QSM showed increased susceptibility in both infarcts (90 min and permanent MI) and substantial increase in hypointense region of 90 min MI. In reperfused infarcts (90 min MI), T2*-weighted and T2*-maps were spatially heterogenous, having both hypointense (T2*=11.0 ms) and hyperintense (T2*=65.7 ms) regions. The low T2* regions correspond to an elevated susceptibility and iron content. Magnetic susceptibility, but not T2*, was significantly different between ROIs of 90 min and permanent MIs (p<0.001) (Figure 3C,D). There was an increasing amount of iron concentration found in the infarct of 90 min and permanent animals compared to remote myocardium (Figure 3E).
Discussion and Conclusion:
The key finding of the present study was the increased infarct magnetic susceptibility after myocardial infarction compared to remote myocardium, and its correlation with tissue iron content at 7 days post-MI. All animals had LGE hypointense cores, indicating large severe infarcts with microvascular obstruction. T2*-weighted and T2*-maps of reperfused infarcts had hypointense regions attributed to hemorrhagic MI. Hypointense regions were not observed in permanently infarcted animals, despite increased iron content and magnetic susceptibility, suggesting that T2* is affected by other factors besides iron such as fibrosis and edema. This is consistent with the histological findings that showed substantial extracellular matrix deposition. Additionally, T2* may not directly reflect iron content due to the nonlocal effects of iron on T2* signal and dependence on imaging parameters such as voxel size. In summary, these findings show QSM is a more sensitive and specific marker of hemorrhagic MI. In a clinical environment, QSM could be used to determine targeted periprocedural therapy, risk stratification for aggressive pharmacologic treatment and monitoring of post-MI patients.Acknowledgements
We gratefully acknowledge support from R00-HL108157, NRSA in interdisciplinary Cardiovascular Biology NIH T32-HL007954, and HHMI-NIBIB Interfaces Program NIH T32-EB009384.References
1. Carrick D, Haig C, Ahmed N, et al. Myocardial hemorrhage after acute reperfused ST-segment-elevation myocardial infarction: Relation to microvascular obstruction and prognostic significance. Circ Cardiovasc Imaging. 2016;9(1):1-10. doi:10.1161/CIRCIMAGING.115.004148.
2. Amier RP, Tijssen RYG, Teunissen PFA, et al. Predictors of Intramyocardial Hemorrhage After Reperfused ST‐Segment Elevation Myocardial Infarction. J Am Heart Assoc. 2017;6(8):e005651. doi:10.1161/JAHA.117.005651.
3. Husser O, Monmeneu J V., Sanchis J, et al. Cardiovascular magnetic resonance-derived intramyocardial hemorrhage after STEMI: Influence on long-term prognosis, adverse left ventricular remodeling and relationship with microvascular obstruction. Int J Cardiol. 2013;167(5):2047-2054. doi:10.1016/j.ijcard.2012.05.055.
4. Ghugre NR, Ramanan V, Pop M, et al. Quantitative tracking of edema, hemorrhage, and microvascular obstruction in subacute myocardial infarction in a porcine model by MRI. Magn Reson Med. 2011;66(4):1129-1141. doi:10.1002/mrm.22855.
5. Haacke EM, Mittal S, Wu Z, Neelavalli J, Cheng YCN. Susceptibility-weighted imaging: Technical aspects and clinical applications, part 1. Am J Neuroradiol. 2009;30(1):19-30. doi:10.3174/ajnr.A1400.
6. O’Regan DP, Ahmed R, Karunanithy N, et al. Reperfusion Hemorrhage Following Acute Myocardial Infarction: Assessment with T2* Mapping and Effect on Measuring the Area at Risk. Radiology. 2009;250(3):916-922. doi:10.1148/radiol.2503081154.
7. Liu J, Liu T, De Rochefort L, et al. Morphology enabled dipole inversion for quantitative susceptibility mapping using structural consistency between the magnitude image and the susceptibility map. Neuroimage. 2012;59(3):2560-2568. doi:10.1016/j.neuroimage.2011.08.082.
8. Liu T, Liu J, De Rochefort L, et al. Morphology enabled dipole inversion (MEDI) from a single-angle acquisition: Comparison with COSMOS in human brain imaging. Magn Reson Med. 2011;66(3):777-783. doi:10.1002/mrm.22816.
9. Yushkevich PA et al. User-guided 3D active contour segmentation of anatomical structures: significantly improved efficiency and reliability. Neuroimage. 2006;31(3):1116-1128.
10. Kali A, Kumar A, Cokic I, et al. Chronic manifestation of postreperfusion intramyocardial hemorrhage as regional iron deposition: A cardiovascular magnetic resonance study with ex vivo validation. Circ Cardiovasc Imaging. 2013;6(2):218-228. doi:10.1161/CIRCIMAGING.112.000133.
11. Liu T, Khalidov I, Rochefort L de, et al. A novel background field removal method for MRI using projection onto dipole fields (PDF). NMR Biomed. 2011;24(9):1129-1136. doi:10.1002/nbm.1670.A
Figures