0280
The Rate of Hyperpolarized [1-13C] Pyruvate to [1-13C] Lactate Conversion Distinguishes High-Grade Prostate Cancer from Low-Grade Prostate Cancer and Normal Peripheral Zone Tissue in Patients1Radiology and Biomedical Imaging, University of California at San Francisco, San Francisco, CA, United States, 2The Graduate Group in Bioengineering, Universities of California at Berkeley and San Francisco, Berkeley and San Francisco, CA, United States, 3Urology, University of California at San Francisco, San Francisco, CA, United States, 4Pathology, University of California at San Francisco, San Francisco, CA, United States
Synopsis
The accurate discrimination of aggressive from indolent prostate cancer at diagnosis remains a pressing clinical need. High spatial and temporal resolution 3D dynamic hyperpolarized 13C MRSI has previously demonstrated the ability to correlate hyperpolarized (HP) [1-13C]pyruvate to [1-13C]lactate conversion, kPL, with cancer grade in murine models. This initial analysis of patients studies enrolled in a phase II pre-prostatectomy clinical trial demonstrated for the first time that maxmium kPL (kPLmax) is significantly elevated in high-grade prostate cancer versus both normal (p=0.0003) and low-grade disease (p=0.034).
Introduction
A pressing need facing the clinical management of prostate cancer patients is an accurate method for distinguishing aggressive, potentially lethal, prostate cancer from indolent disease at the time of diagnosis. A recent publication has demonstrated that high spatial and temporal resolution 3D dynamic hyperpolarized 13C MRSI can provide images of the rate of hyperpolarized (HP) [1-13C]pyruvate to [1-13C]lactate conversion, kPL, that correlate with cancer grade in a murine model of prostate cancer[1]. The phase I clinical trial of HP [1-13C]pyruvate (NCT01229618) demonstrated both the safety and feasibility of imaging prostate cancer based on kPL from 2D dynamic 13C spectroscopic imaging data, but with only biopsy-based pathology correlations[2]. In this work, we present the initial patient data from a phase II clinical trial (NCT02526368) using a 3D dynamic hyperpolarized 13C MRSI approach focused on investigating the association between kPL and pathologic grade of prostate cancer, including benign prostate tissue, low-grade and high-grade prostate cancer using whole-mount step section histopathology after surgery as a reference standard.Methods
To date, 11 prostate cancer patients have received a 3T multiparametric (anatomy, diffusion, perfusion and 1H MRSI) 1H/HP 13C pyruvate MRI of the prostate using a dual-tuned 1H/13C endorectal coil in combination with a 4-channel 1H pelvic array for reception and a 13C clamshell coil for 13C RF excitation. An anatomic T2-weighted sequence (FSE, FOV=180x180mm, TR/TE=6000/95ms, resolution=0.35x0.35x3mm) was acquired to prescribe functional imaging sequences. Dynamic HP 13C spectroscopic imaging data (13C-MRSI) were acquired using a 3D EPSI sequence with compressed sensing after injection of 0.43mL/kg [1-13C]-pyruvate (FOV=96x96x128mm, TR/TE=150/4.0 ms, multiband variable flip angle scheme, spatial resolution = 8x8x8mm, temporal resolution=2 seconds). An image of the apparent rate of [1-13C]pyruvate to [1-13C]lactate conversion (kPL map)[3] was modeled with a signal-to-noise (SNR) cutoff of 14.
All patients underwent radical prostatectomy with 3mm-slice whole-mount sectioning within two months of imaging. Regions of Interest (ROIs) were manually transposed from pathologist-defined regions of prostate cancer and benign peripheral zone tissue onto the T2-weighted images. ROIs with benign, high-grade primary pattern 4 disease (Gleason score≥4+3) and low-grade primary pattern 3 disease (Gleason≤3+4) were propagated to the kPL map after 3D rigid registration and nearest-neighbor interpolation to account for differences in spatial resolution. Wilcoxon Rank Sum tests with a Holm-Sidak correction were used to determine significant differences in maximum kPL (kPLmax) between tissue types.
Results and Discussion
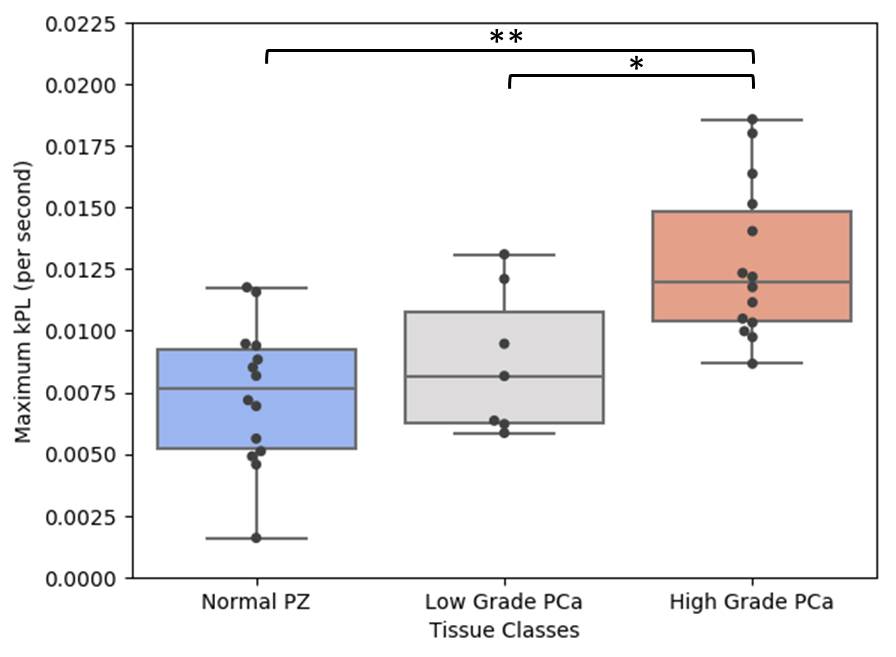
Regions of low-grade (n=7) and high-grade (n=14) prostate cancer, and regions of benign prostate tissue (n=14) were identified in the peripheral zones of whole-mount sections. kPLmax distributions by tissue type are summarized in Figure 1. Benign prostate tissue was associated with a kPL of 0.0072±0.003 sec-1; kPLmax was significantly increased in regions of prostate cancer (0.0114±0.004sec-1, p=0.0013).
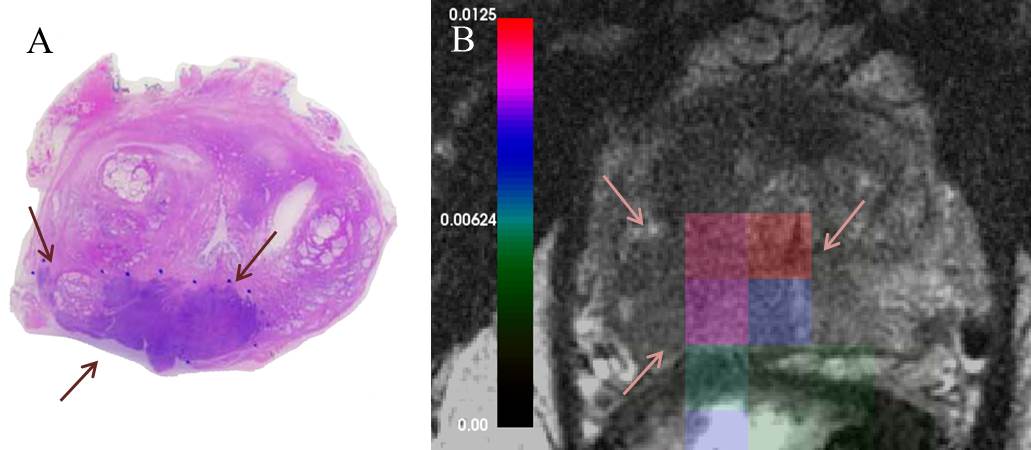
kPLmax was nonsignificantly elevated in regions of low-grade cancer (0.0088±0.003sec-1, p=0.218) relative to benign prostate tissue. High-grade prostate cancer demonstrated a significantly higher kPLmax (0.0128±0.003 sec-1), relative to benign (p=0.003) and low-grade cancer (p=0.034), respectively. A representative high-grade cancer region with contralateral benign tissue is presented in Figure 2. There were only 4 cancers within the central gland of the prostate in the 11 patients studied, therefore more data needs to be acquired to assess the ability of kPLmax to pathologically characterize tumors within the central gland.
Conclusion
The initial analysis of prostate cancer patients studied in this phase II clinical trial demonstrated that high spatial and temporal resolution 3D dynamic hyperpolarized 13C pyruvate MRI with full prostate coverage can be obtained, and kPLmax images created using an SNR threshold of 14 for HP [1-13C]pyruvate. Relatively low kPLmax was associated with regions of benign tissue that significantly increased in cancer, consistent with what was observed in the initial phase 1 clinical trial[2]. This study demonstrated for the first time that kPLmax is significantly elevated in high-grade prostate cancer versus both normal and low-grade disease, consistent with the recent pre-clinical study[1]. The results of ongoing studies will better determine the ability of kPLmax to discriminate low-grade prostate cancer from benign tissues in the peripheral zone and the ability to characterize prostate cancer in the central gland. While the focus of this study was the initial characterization of kPLmax in pathologically well-defined prostate tissue types, future studies will need to assess the ability of kPLmax to improve the assessment of pathologic grade in addition to the other multiparametric 1H MRI biomarkers.Acknowledgements
P41 EB013598
R01 EB017449
R01CA166655 .
References
[1] Chen et al, Cancer Res, 2017
[2] Nelson et al, Sci Transl Med 2013
[3] Maidens et al, IEEE Trans Med Im 2016
Figures