0279
Multimodal Characterization of In Vivo Metabolic Activities with Hyperpolarized 13C MRI, 18F-FDG PET, and EPR Imaging in Pancreatic Ductal Adenocarcinoma Tumors1National Cancer Institute, National Institutes of Health, Bethesda, MD, United States
Synopsis
Profiling the metabolic and physiologic phenotypes of tumors has become important in treatment planning and response monitoring. Here, multimodal imaging methods, including hyperpolarized 13C MRI, 18F-FDG PET, and EPRI imaging, were used to profile the metabolic and physiologic features of human pancreatic ductal adenocarcinoma (PDAC) tumors, Hs766t, MiaPaCa-2, and SU.86.86. PDACs have some of the worst prognoses of all cancers. Experimental results have demonstrated, for the first time, the feasibility and advantages of multimodal metabolic and physiologic assessment of xenograft tumors. This multimodal imaging approach will complement tumor characterization, lead to better prognostics, and earlier response monitoring in cancer treatment.
Purpose
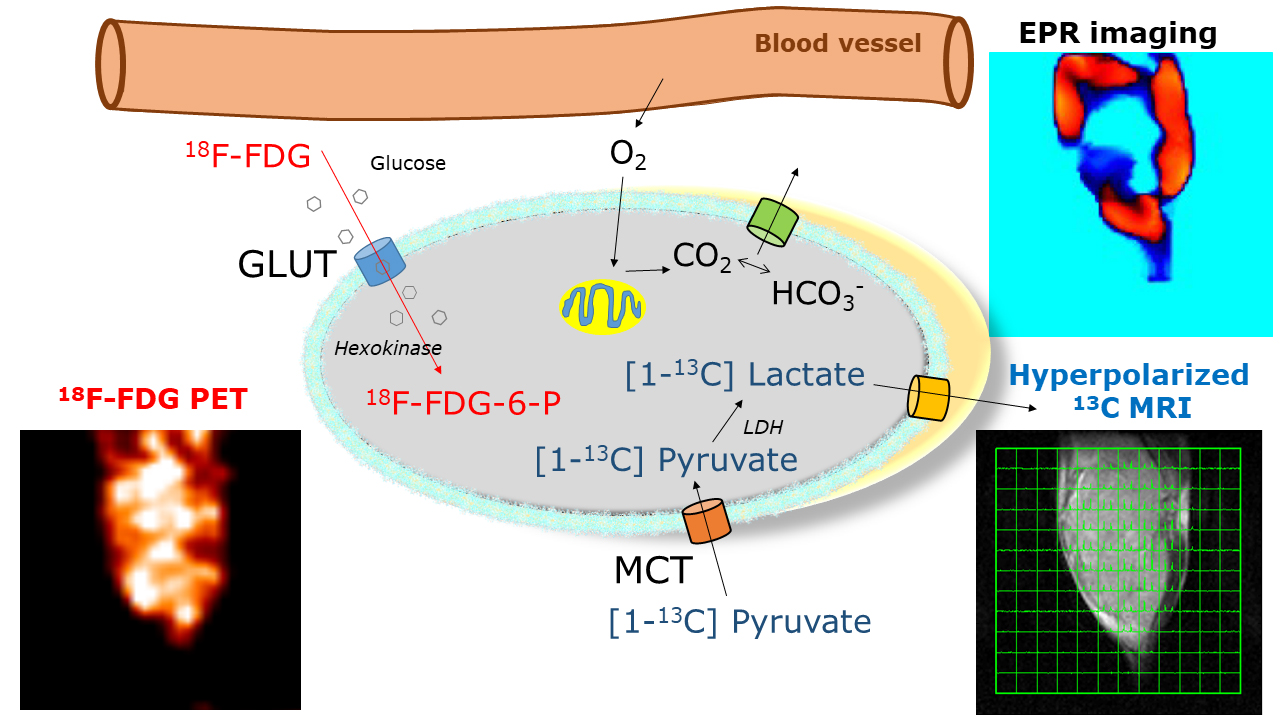
Cancer therapies can be personalized by targeting key survival pathways, or by monitoring treatment response. In order to non-invasively evaluate treatment responses earlier, molecular imaging methodologies are required. For this purpose, molecular imaging of metabolic and physiologic status has been considered useful to profile solid tumors. Most tumors display aerobic glycolysis also known as the Warburg phenotype. In order to visualize this phenotype either directly or indirectly, a variety of imaging techniques have been developed, including: (1) hyperpolarized 13C Magnetic Resonance Imaging (MRI); (2) 18F-FDG Positron Emission Tomography (PET) imaging; these two techniques profile metabolism and (3) Electron Paramagnetic Resonance Imaging (EPRI) for physiologic imaging. Each molecular imaging modality utilizes unique biomarkers, which form the basis for visualizing tumors through different metabolic pathways. For example, (1) hyperpolarized [1-13C] pyruvate is transported by a MCT transporter and is metabolized to 13C-lactate, 13C-Alanine and 13C-HCO3; (2) a glucose analog 18F-2-fluoro-2-deoxy-D-glucose (18F-FDG) is transported by GLUT transporters and is phosphorylated by hexokinases and entrapped in cells; and (3) a triarylmethyl radical probe, OX063, works as an oxygen tracer in EPRI as shown in Figure 1. Therefore, by comparing these methods and metabolic products using this multimodal imaging approach, additional valuable information to better characterize tumors can be obtained. Here, in order to evaluate the feasibility, advantages and disadvantages of this multimodal approach, xenograft models with three human pancreatic ductal adenocarcinoma cell lines, including Hs766t, MiaPaCa-2, and SU.86.86, which exhibit a glycolytic phenotype with different hypoxic levels, were examined.Methods
Hyperpolarized 13C MRI: Hs766t, MiaPaca-2, and SU.86.86 pancreatic tumor bearing mice (n=5 each) were formed by injecting 3×10⁵ cells, subcutaneously into the right hind legs of mice. Hyperpolarized 13C MRI experiments were performed on a 3T MRI scanner (MR solutions Inc.) using a 17 mm diameter home built 13C solenoid coil with a saddle 1H coil. A solution of 30 ml of [1-13C] pyruvate, containing 15 mM of OX063 and 2.5 mM of the chelated gadolinium, ProHance (Bracco Diagnostics), was polarized at 3.35T and 1.4 K in a Hypersense DNP polarizer (Oxford Instruments). Each hyperpolarized sample was rapidly dissolved in 4.5 ml of a superheated alkaline dissolution buffer, containing 40 mM of 4-(2-hydroxyethyl)-1-piperazineethanesulfonic acid, 30 mM of NaCl and 100 mg/L ethylenediaminetetraacetic acid.
18F-FDG PET: Tumor bearing mice were injected with 100 mCi of 18F-2-fluoro-2-deoxy-D-glucose (18F-FDG) in a phosphate buffered saline via tail veil cannula under anesthesia.
EPR Imaging: A 300 MHz pulsed EPR imaging scanner with a homemade parallel coil was used for oxygen imaging using OX063 as the paramagnetic tracer to obtain pO2 maps.
Results and Discussion
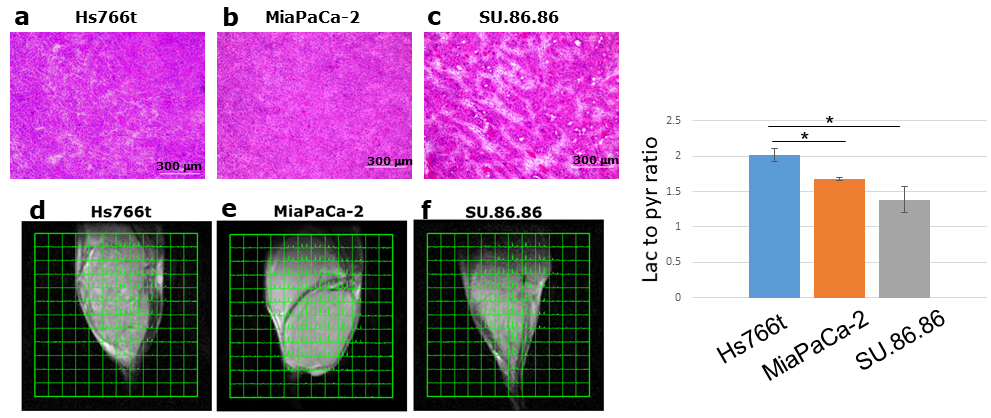
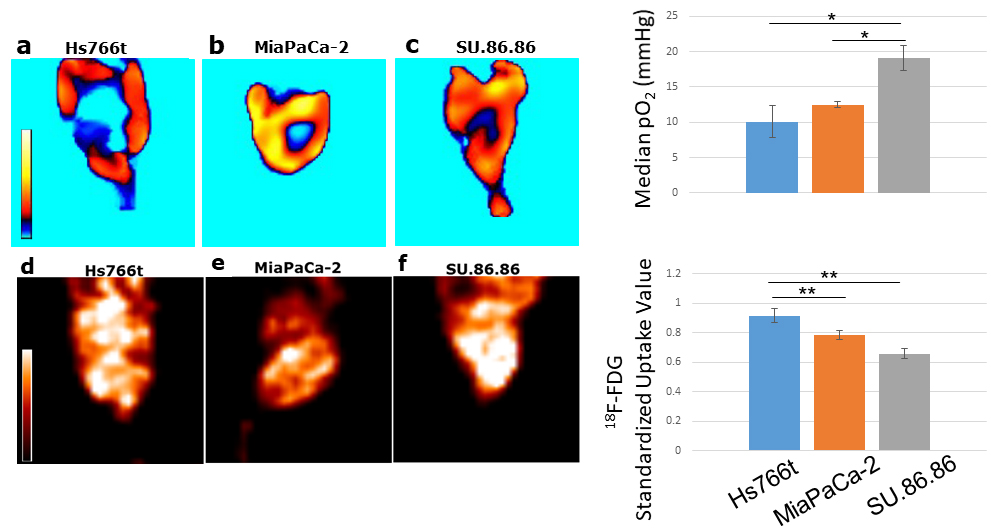
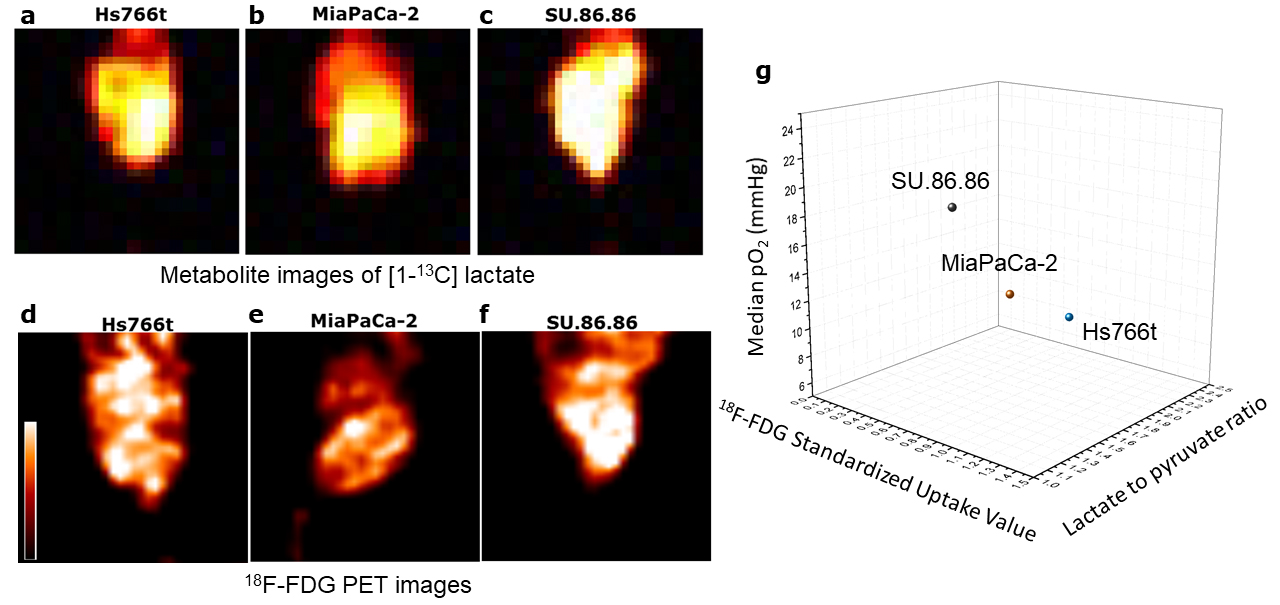
Subcutaneous tumor xenografts generated from three human pancreatic ductal adenocarcinoma cell lines, including Hs766t, MiaPaCa-2, and SU.86.86, were shown to be histologically similar to pancreatic orthotopic tumors as shown in Figure 2.1 These tumors were subjected to multimodal imaging techniques of hyperpolarized 13C MRI, 18F-FDG PET and EPR imaging using an identical scanner bed, which can be utilized for all three of these imaging modalities. Therefore the positioning of tumors can be fixed for various imaging systems, and the obtained anatomical/metabolic/physiologic images can be directly overlapped and compared. The Lac/Pyr flux ratio in Hs766t and MiaPaCa-2 tumor were significantly greater than that of a SU.86.86 tumor as shown in Figure 2. Mismatches in distribution between 18F-FDG uptake and 13C-lactate production are seen in the Figure 4. These results demonstrate that hyperpolarized 13C-pyruvate MRI directly reports the conversion to 13C-lactate via LDH activity in real time. On the other hand, even though it has significantly higher sensitivity than 13C MRI, 18F-FDG PET only indirectly indicates glycolysis through GLUT transport and Hexokinase activity.2-4 Tumor pO2 of Hs766t, MiaPaCa-2, and SU.86.86 tumors had median values pO2 of 10.1± 2, 12.5±1, and 19.1±2 mmHg, respectively. SU.86.86 tumors were less hypoxic compare with Hs766t and MiaPaCa-2 as shown in Figure 3.Conclusions
To our knowledge this is the first study comparing hyperpolarized 13C MRI, 18F-FDG PET and EPR imaging using a well-defined cancer phenotype, the human PDAC cell lines in vivo. Successful comparison of these three modalities allows us to monitor a variety of tumor metabolic activities at a molecular level in a complemental manner. For example, the mismatch and overlap of distributions between 13C lactate production and 18F FDG uptake suggest that a multimodal approach may contain additional valuable diagnostic information to monitor the Warburg effect accurately.2-4 Therefore, mapping these metabolic activities non-invasively with various approaches can potentially contribute to better prognostics, further tumor characterization, and earlier response monitoring in cancer treatment.Acknowledgements
This study was supported by intramural research program at NCI/NIH.References
1. Wojtkowiak JW et al., Pyruvate sensitizes pancreatic tumors to hypoxia-activated prodrug TH-302., Cancer Metab. 2015; 3(1):2.
2. Menzel MI et al., Multimodal assessment of in vivo metabolism with hyperpolarized [1-13C]MR spectroscopy and 18F-FDG PET imaging in hepatocellular carcinoma tumor-bearing rats., J Nucl Med. 2013; 54(7):1113-9.
3. Gutte H et al., In Vivo Phenotyping of Tumor Metabolism in a Canine Cancer Patient with Simultaneous (18)F-FDG-PET and Hyperpolarized (13)C-Pyruvate Magnetic Resonance Spectroscopic Imaging (hyperPET): Mismatch Demonstrates that FDG may not Always Reflect the Warburg Effect., Diagnostics (Basel). 2015; 5(3):287-9.
4. Gutte H et al., The use of dynamic nuclear polarization (13)C-pyruvate MRS in cancer., Am J Nucl Med Mol Imaging. 2015; 5(5):548-60.
Figures