0277
Imaging the healthy human brain with hyperpolarized [1-13C] pyruvate1Radiology, University of Cambridge, Cambridge, United Kingdom, 2Cancer Research UK Cambridge Institute, University of Cambridge, Cambridge, United Kingdom, 3Global Research, General Electric, Munich, Germany, 4Healthcare, General Electric, Cambridge, United Kingdom, 5Pharmacy, Addenbrooke's Hospital, Cambridge, United Kingdom, 6MRIS, Addenbrooke's Hospital, Cambridge, United Kingdom, 7Medicine, University of Cambridge, Cambridge, United Kingdom, 8Oncology, University of Cambridge, Cambridge, United Kingdom, 9Physiology, Anatomy and Genetics, University of Oxford, Oxford, United Kingdom, 10Clinical Neurosciences, University of Cambridge, Cambridge, United Kingdom
Synopsis
Initial results from imaging the healthy human brain with [1-13C] pyruvate are presented. Labelled lactate and bicarbonate formation are seen, as well as differences in gray and white matter perfusion.
Introduction
Hyperpolarized 13C MR Spectroscopic Imaging (MRSI) can be used to probe human metabolism in vivo in real time. To date, this has been applied to studies of [1-13C]pyruvate metabolism in oncology and in the healthy human heart (1-3). Here we describe initial results from the first study to image [1-13C]pyruvate metabolism in the healthy human brain. The results show the feasibility of imaging the exchange of hyperpolarized 13C label between pyruvate and the endogenous lactate pool in the healthy brain as well as spectroscopic measurements of 13C-bicarbonate production.Methods
Three healthy volunteers were imaged at 3T (MR750, GE Healthcare, WI) in a dual tuned 1H/13C head coil (Rapid, Germany). T1 weighted 1H images (3D-inversion-prepared, repetition time (TR) = 8.1ms, echo time (TE) = 3.1ms, resolution = 1x1x2mm3, FA = 12˚, FOV = 240mm) were acquired and subsequent 13C imaging was performed after injection of approximately 250 mM hyperpolarized [1-13C]pyruvate using a GE SPINlab (0.4ml/kg; injection rate 5ml/s).
Spectra were acquired from two volunteers (3-4 slices, TE = 1.2ms, slice thickness = 20-25 mm, FA = 5˚, FOV = 240mm, time resolution = 2s) and IDEAL spiral images from the third volunteer (interleaved spectral and imaging acquisitions, 3 slices, TR = 250ms, TE = 1.2ms, 8 echoes per time point, ST = 30mm, FA = 15˚, FOV = 240mm, in-plane resolution = 12x12mm2, reconstructed resolution = 6x6mm2, time resolution = 2s). Acquisitions commenced 10 s after the end of injection.
Results
Polarizations of up to 40% were measured using a liquid state NMR spectrometer (GE Healthcare).
Dynamic images showed hyperpolarized [1-13C]pyruvate and [1-13C]lactate in the brain (figure 2A-B). Time averaged pyruvate and lactate maps superimposed on the proton images are shown in figure 3. A time series of spectra is shown in figure 2C. The average signal within gray and white matter is shown in figure 1B: a relatively higher pyruvate signal was observed in gray matter and the peak pyruvate signal was at 8 s in white matter and 10 s in gray matter. The peak lactate signal was at approximately 10 s in both regions. The ratio of lactate-to-pyruvate summed over the whole brain, as determined from both spectroscopy and imaging, was 0.2 ± 0.05 for all three volunteers.
Summed spectra acquired from the whole brain showed the presence of hyperpolarized 13C-bicarbonate (figure 3G).
Discussion
These are the first images of hyperpolarized [1-13C]pyruvate metabolism in the normal human brain. They suggest that pyruvate transport across the intact blood brain barrier (BBB) is sufficient rapidly to allow real time metabolism to be observed within the lifetime of hyperpolarized 13C signal.
Differential perfusion of white and gray matter was observed, with the white matter peak occurring ~2 s prior to that in gray matter (figure 1B). The higher gray matter pyruvate signal may reflect increased perfusion of this region (5) as a similar lactate signal was observed in both areas.
The demonstration of hyperpolarized 13C-bicarbonate signal from summed spectra suggests that pyruvate transport and pyruvate dehydrogenase (PDH) activity is sufficiently rapid to allow metabolism of pyruvate to carbon dioxide within the lifetime of the polarisation. Further work is required to localise this signal within the head; the signal could be optimised with the use of spectral spatial acquisitions, allowing higher flip angles for selected metabolites while retaining polarization of pyruvate.
Imaging the distribution of bicarbonate in the brain offers the possibility of measuring PDH activity, which has been shown to be altered in a number of disease processes (6).
Conclusion
This work represents the first hyperpolarized 13C study in the healthy human brain and has shown labelled lactate and bicarbonate production as well as differences in pyruvate perfusion between white and grey matter. The study has demonstrated that pyruvate is transported across the BBB and metabolised in the normal brain sufficiently rapidly to allow imaging within the lifetime of the hyperpolarized 13C signal.Acknowledgements
This study was supported by the The Wellcome Trust, Cancer Research UK, Medical Research Council, CRUK Cambridge Centre, Cambridge Biomedical Research Centre, Addenbrooke’s Charitable Trust, MS Society, and the Cambridge Experimental Cancer Medicine Centre.References
1. Nelson, Sarah J., John Kurhanewicz, Daniel B. Vigneron PEZL, Andrea L. Harzstark, Marcus Ferrone, Mark van Criekinge, Jose W. Chang R, Bok1, Ilwoo Park, Galen Reed, Lucas Carvajal, Eric J. Small, Pamela Munster V, K. Weinberg, Jan Henrik Ardenkjaer-Larsen6, Albert P. Chen6, Ralph E. Hurd6 L-I, Odegardstuen, Fraser J. Robb, James Tropp and JAM. Metabolic Imaging of Patients with Prostate Cancer Using Hyperpolarized [1-13C]Pyruvate. 2013;487:109–113. doi: 10.1038/nature11130.Reduced.
2. Cunningham CH, Lau JYC, Chen AP, Geraghty BJ, Perks WJ, Roifman I, Wright GA, Connelly KA. Hyperpolarized 13C Metabolic MRI of the Human Heart: Initial Experience. Circ. Res. 2016;119:1177–1182. doi: 10.1161/CIRCRESAHA.116.309769.
3. Aggarwal R, Vigneron DB, Kurhanewicz J. Hyperpolarized 1-[13C]-Pyruvate Magnetic Resonance Imaging Detects an Early Metabolic Response to Androgen Ablation Therapy in Prostate Cancer. Eur. Urol. 2017:2–3. doi: 10.1016/j.eururo.2017.07.022.
4. Wiesinger F, Weidl E, Menzel MI, Janich M a, Khegai O, Glaser SJ, Haase A, Schwaiger M, Schulte RF. IDEAL spiral CSI for dynamic metabolic MR imaging of hyperpolarized [1-13C]pyruvate. Magn. Reson. Med. 2012;68:8–16. doi: 10.1002/mrm.23212.
5. Li X, Sarkar SN, Purdy DE, Briggs RW. Quantifying cerebellum gray matter and white matter perfusion using pulsed arterial spin labeling. Biomed Res. Int. 2014;2014. doi: 10.1155/2014/108691.
6. Erica Martin, Robert E. Rosenthal and GF. Pyruvate Dehydrogenase Complex: Metabolic Link to Ischemic Brain Injury and Target of Oxidative Stress. J Neurosci Res 2011;193:118–125. doi: 10.1016/j.jneumeth.2010.08.011.
Figures
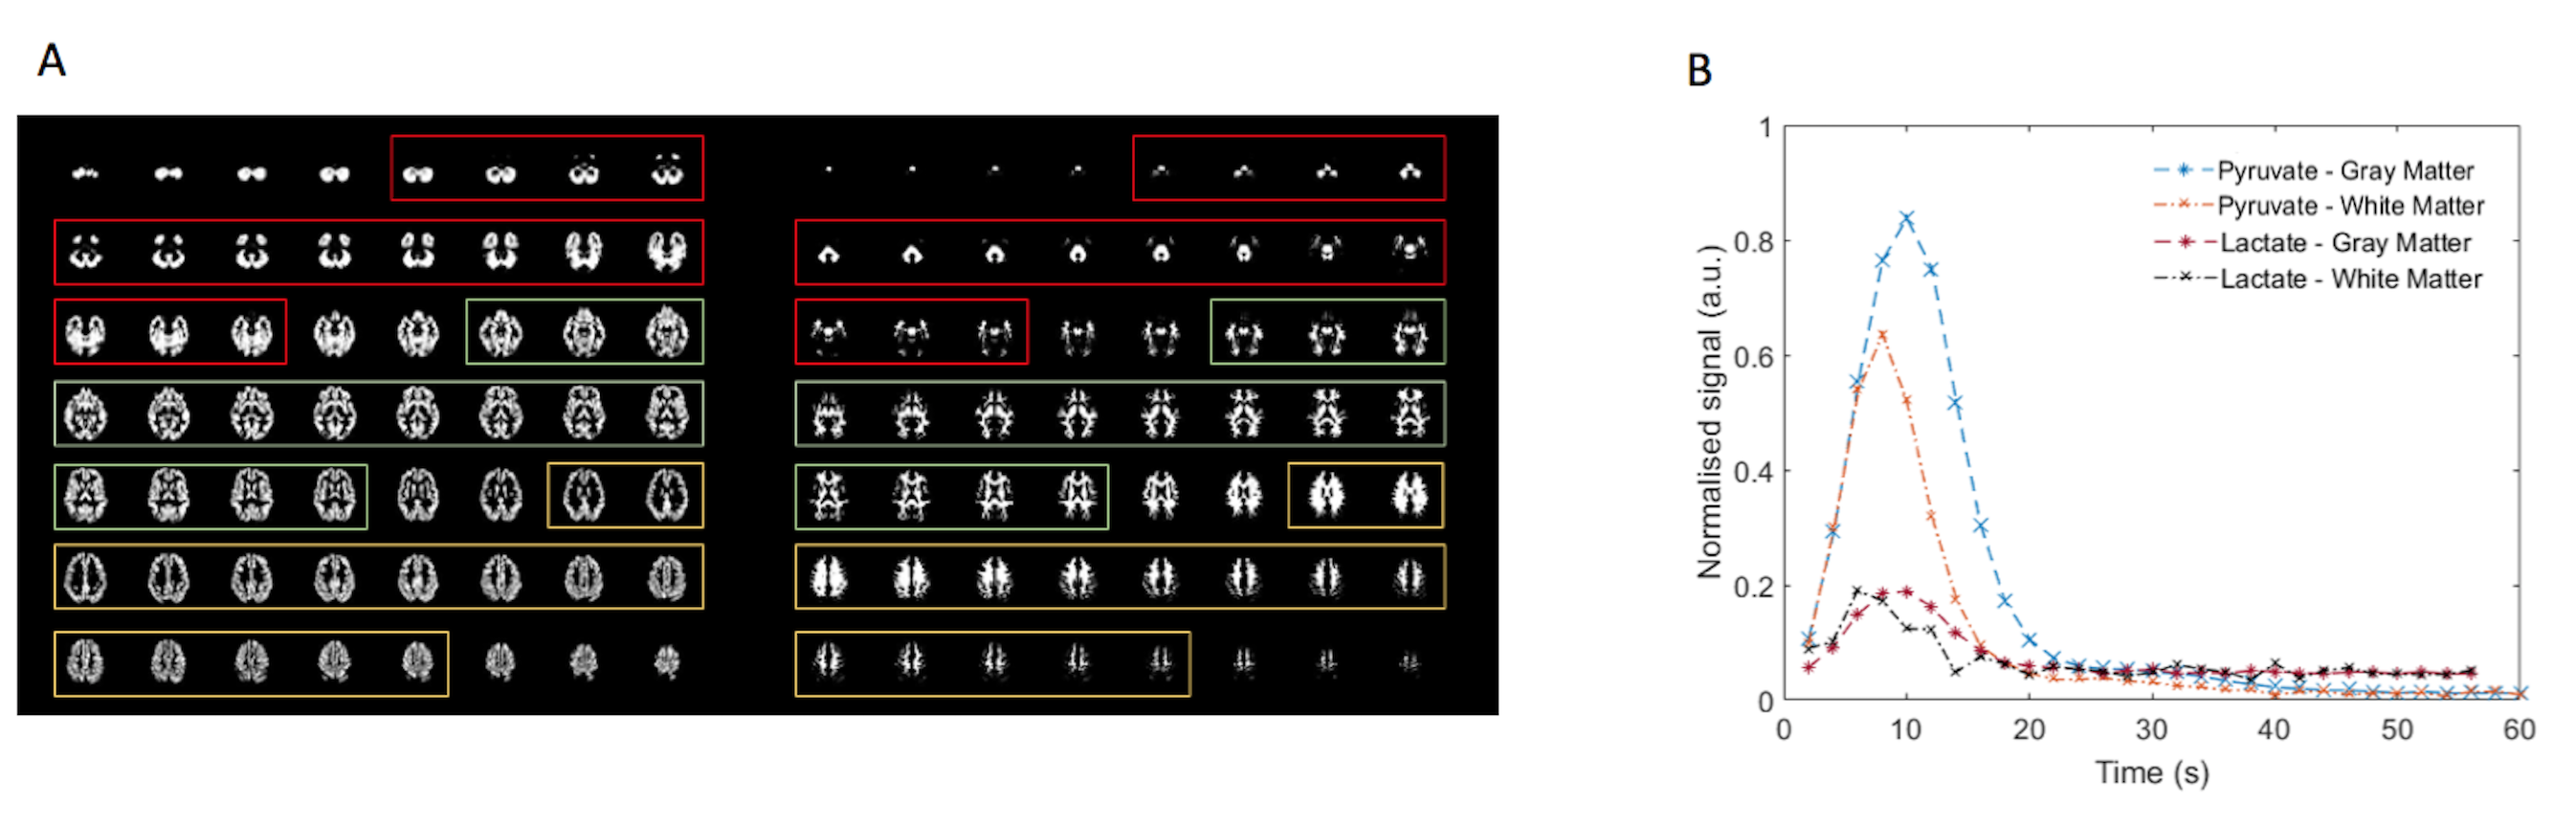
Segmentation reveals differences in white and grey matter perfusion.
A: Grey (left) and white (right) matter segmentation masks from T1-weighted imaging. Slices 1,2, and 3 shown in red, green, and yellow respectively.
B: Differences in the perfusion of pyruvate in white and grey matter over the whole brain are shown. Exchange into lactate in the brain is also observed. Lactate signal x3 displayed.
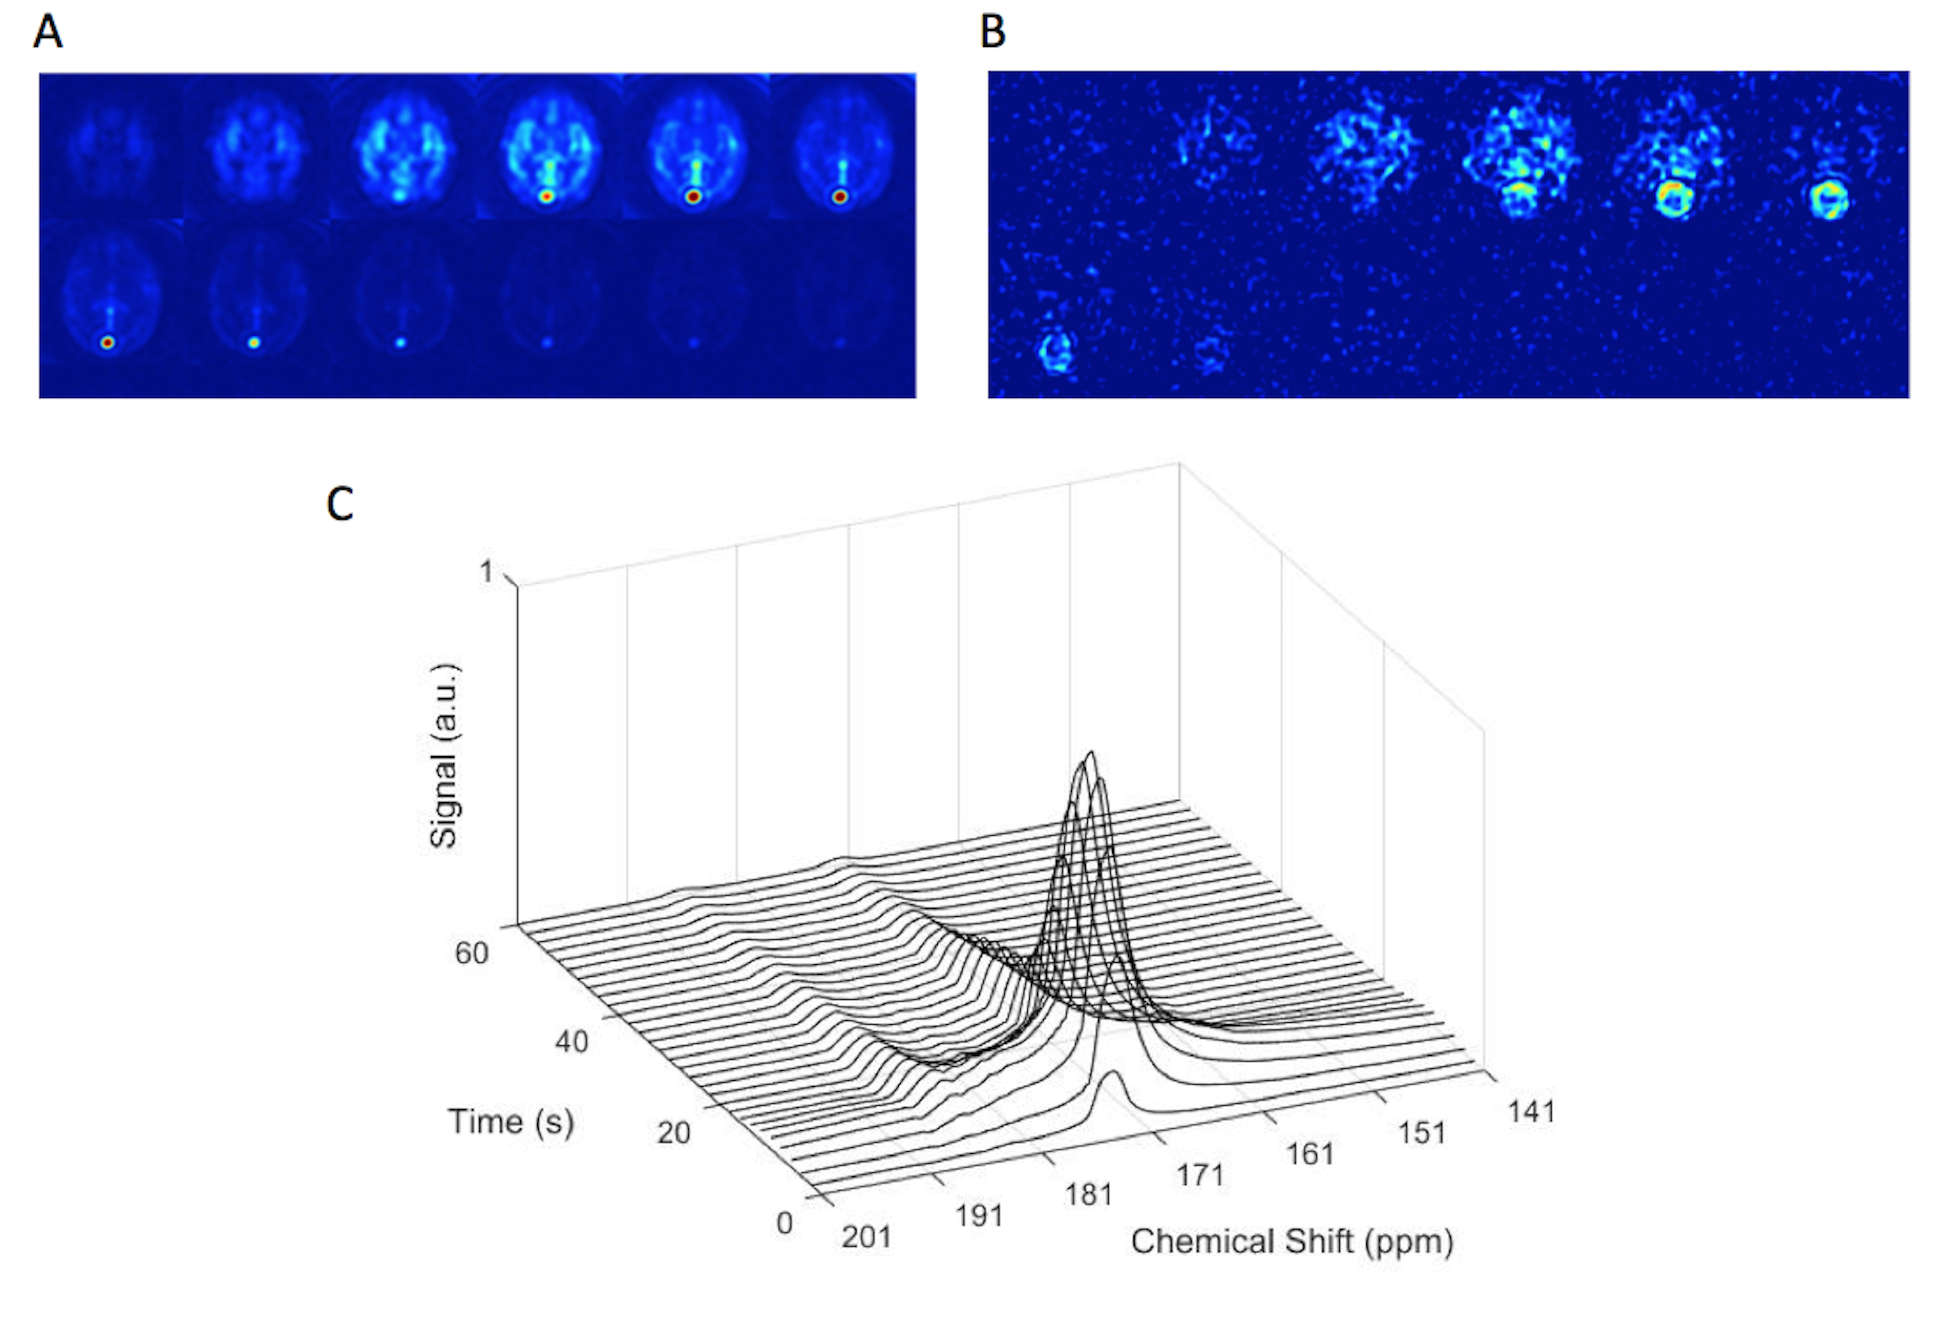
Dynamic spectroscopy and imaging of 13C pyruvate in the human brain.
A, B: Example IDEAL imaging shows perfusion of pyruvate (A) and formation of lactate (B) in the healthy human brain. A small spiral artefact is observed around the sagittal sinus in B.
C: Localised spectroscopic acquisitions reveal formation of lactate after injection of pyruvate, six seconds after the appearance of pyruvate in the brain.
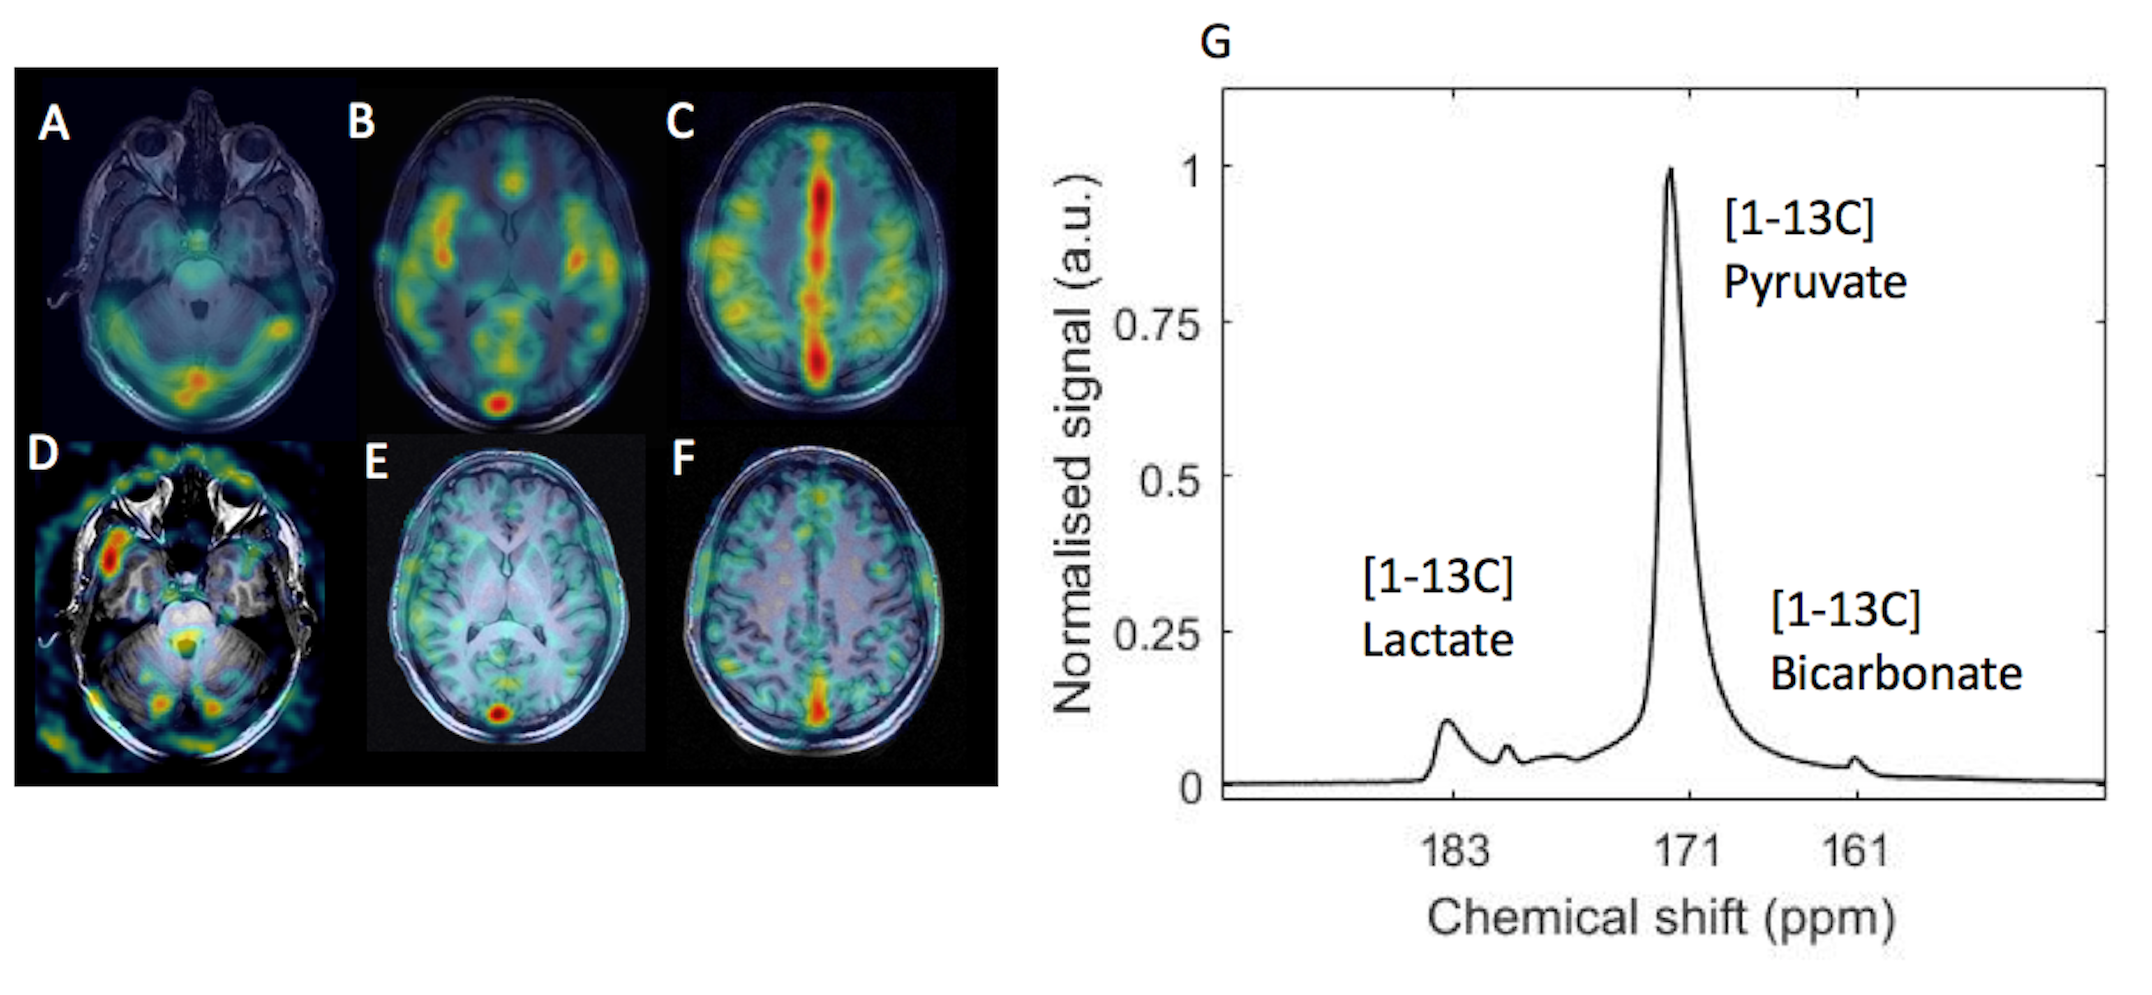
Imaging 13C pyruvate metabolism to form both lactate and bicarbonate
Time averaged pyruvate (A-C) and lactate (D-F) maps superimposed on T1-weighted imaging in three slices through the brain.
G: Summed spectra over the whole brain reveals production of lactate and bicarbonate in the brain, shown in G.