0276
Hyperpolarized 13C Metabolic Imaging of Human Hypertrophic Cardiomyopathy1Physical Sciences Platform, Sunnybrook Research Institute, Toronto, ON, Canada, 2Medical Biophysics, University of Toronto, Toronto, ON, Canada, 3GE Healthcare, Toronto, ON, Canada, 4Pharmacy, Sunnybrook Health Sciences Centre, Toronto, ON, Canada, 5Schulich Heart Program, Sunnybrook Health Sciences Centre, Toronto, ON, Canada, 6Cardiology, St. Michael's Hospital, Toronto, ON, Canada
Synopsis
The feasibility of using hyperpolarized 13C to interrogate in vivo human metabolism in the healthy heart has recently been demonstrated. In this abstract we demonstrate the feasibility of using hyperpolarized 13C imaging to detect metabolic alterations in human hypertrophic cardiomyopathy. Results show significantly elevated 13C-bicarbonate-to-pyruvate ratio near the apex of the heart, corresponding to the known location of disease. The 13C-bicarbonate images also show a different spatial distribution from those observed in healthy volunteers. These results show good prospects for imaging the altered cardiac energetics in the diseased heart using this technology.
Introduction
Hyperpolarized 13C MRI is a promising tool for non-invasive characterization of in vivo metabolism[1]. The feasibility of acquiring hyperpolarized 13C data from human hearts following injections of HP [1-13C]pyruvate solution has been recently demonstrated[2,3]. Altered cardiac energetics play an important role in the progression towards heart failure, and using HP 13C MRI to study this patient population would provide insight into development of novel therapeutics that target metabolism. In this study we demonstrate the feasibility of using hyperpolarized 13C MRI to image metabolic alterations in human hypertrophic cardiomyopathy (HCM).Methods
One patient with non-obstructive apical hypertrophic cardiomyopathy (HCM) and six healthy male subjects (N=6) were recruited and gave written informed consent under a protocol approved by the institutional Research Ethics Board and approved by Health Canada as a Clinical Trial Application. An oral carbohydrate load (35g Gatorade powder in water) was administered approximately 1 hour before the pyruvate injection.
Imaging was performed with a GE MR750 3T. 1H-SSFP-CINE images were acquired using the body coil for anatomical reference and cardiac functional assessment.
The substrate [1-13C]pyruvic acid was polarized in a SpinLab DNP polarizer (GE Healthcare) as previously described[3]. Following dissolution, neutralization, and quality control checks, the pyruvate dose (0.1 mmol/kg) was injected at a rate of 5 mL/s, followed by 25 mL saline flush. 13C imaging was started at the end of the saline flush. Short-axis images of 13C-bicarbonate, [1-13C]lactate, and [1-13C]pyruvate were obtained using a multi-slice, spectrally-selective sequence covering the left ventricle (1x1x1 cm3 resolution, 6 slices, scan time 18 cardiac cycles, volume transmit coil, 8 channel 13C receive coil)[4]. Following 13C imaging, dynamic 13C MRS was used to monitor residual metabolic signals from the entire heart.
Images were manually segmented according to left ventricular (LV) and myocardial components. Mean myocardial 13C-bicarbonate and 13C-lactate signals were used to index PDH and LDH activity. Metabolite ratios (Bic/Pyr and Lac/Pyr) were calculated by normalizing to the mean LV pyruvate signal within each slice to remove inter-subject variations in coil positioning, polarization, excitation flip angle, and perfusion.
Hypertrophic cardiomyopathy is characterized by increased glucose metabolism. We hypothesized that metabolic ratios (Bic/Pyr and Lac/Pyr) within the region of disease would reflect altered metabolism, relative to the hearts of healthy subjects. For each slice, disease Bic/Pyr and Lac/Pyr signals were compared to pooled control values from the same slice.
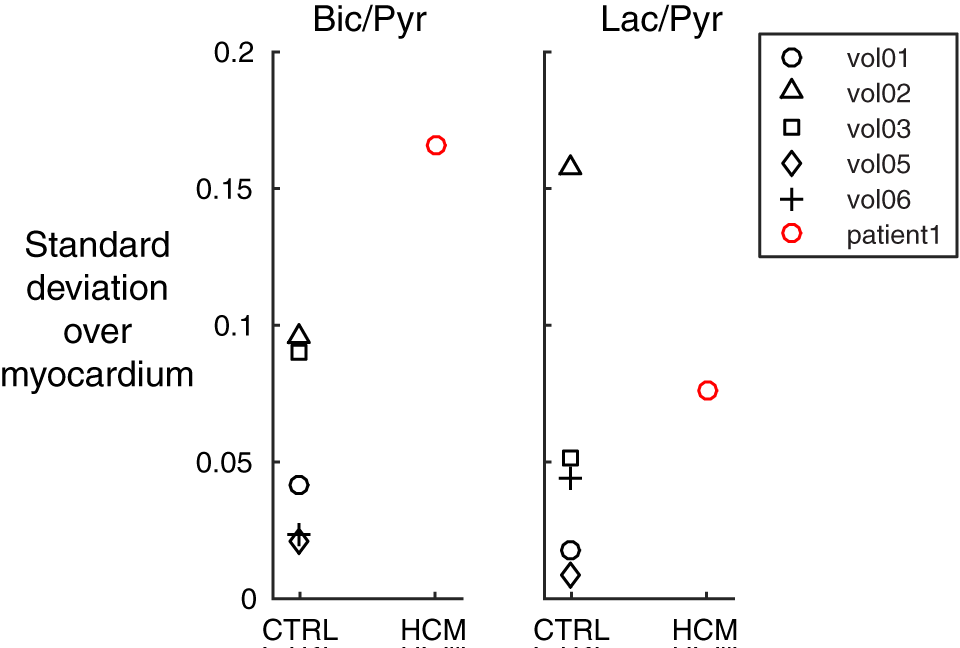
In general, we hypothesized that the presence of disease would be linked with greater dispersion of metabolic ratio across the different slices of the heart. To test this, SD(Bic/Pyr) and SD(Lac/Pyr) were computed across the different image slices, for each subject. SD is known to be sensitive to the presence of outliers.
Signals (Bic/Pyr, Lac/Pyr, and SDs) were modeled as normally distributed across subjects. P-values corresponding to null hypothesis rejection were obtained using the difference between disease and control values, expressed in SDs from the mean.
Results and Discussion
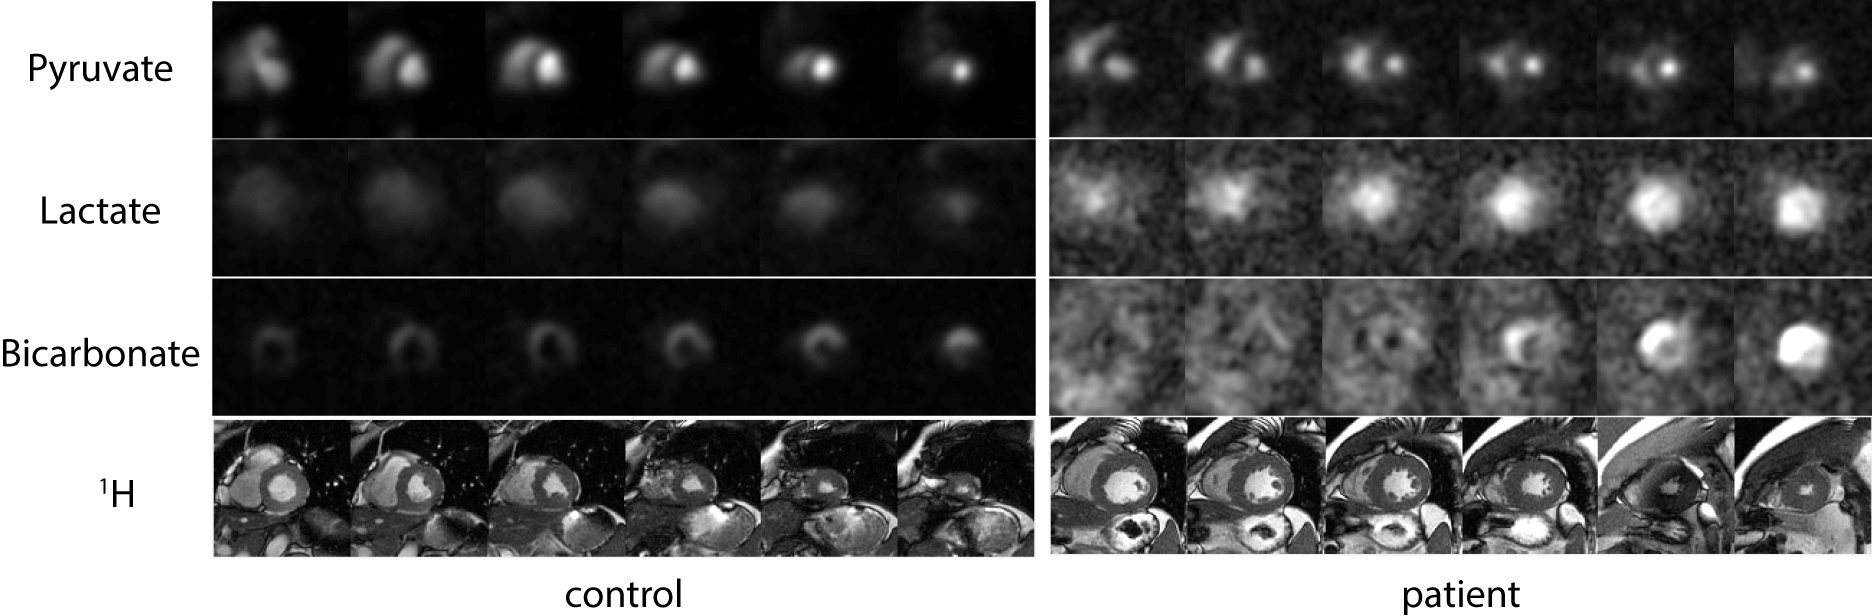
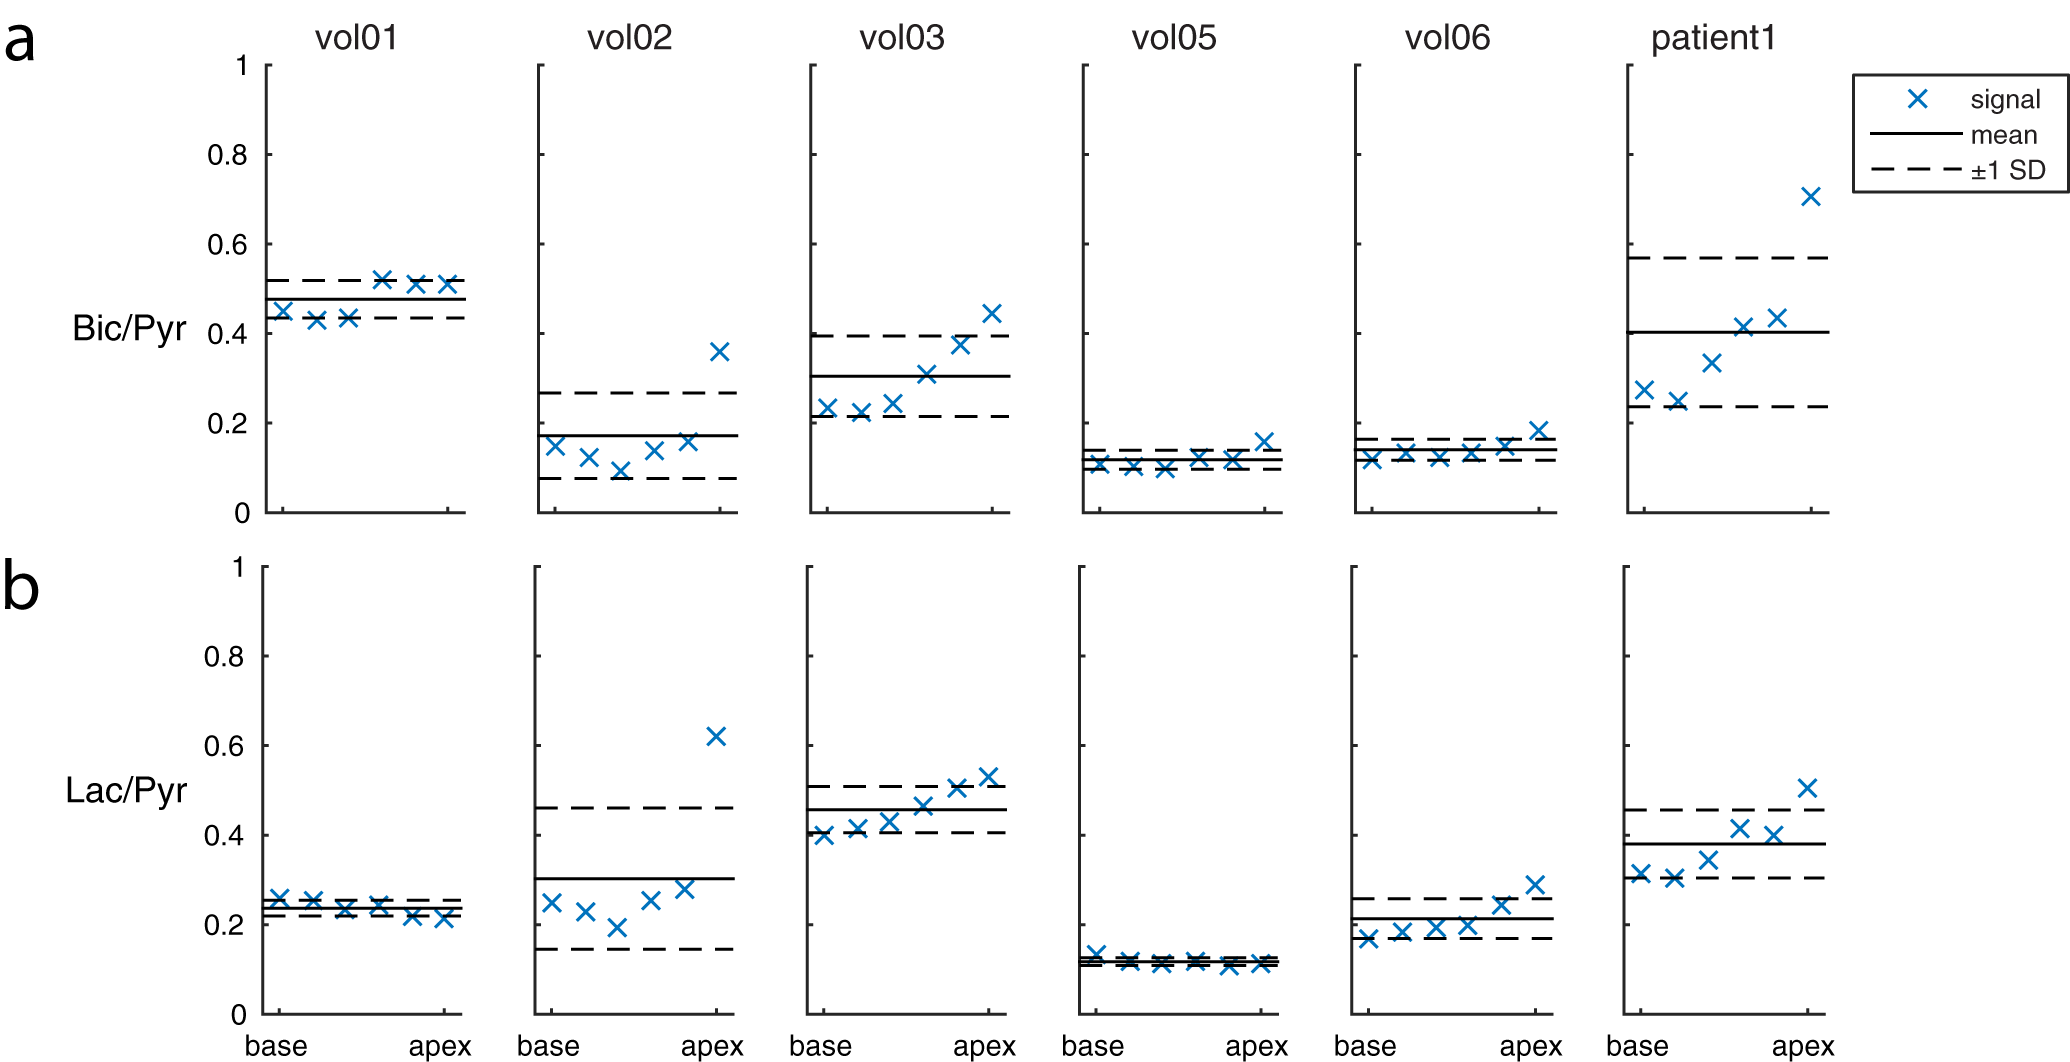
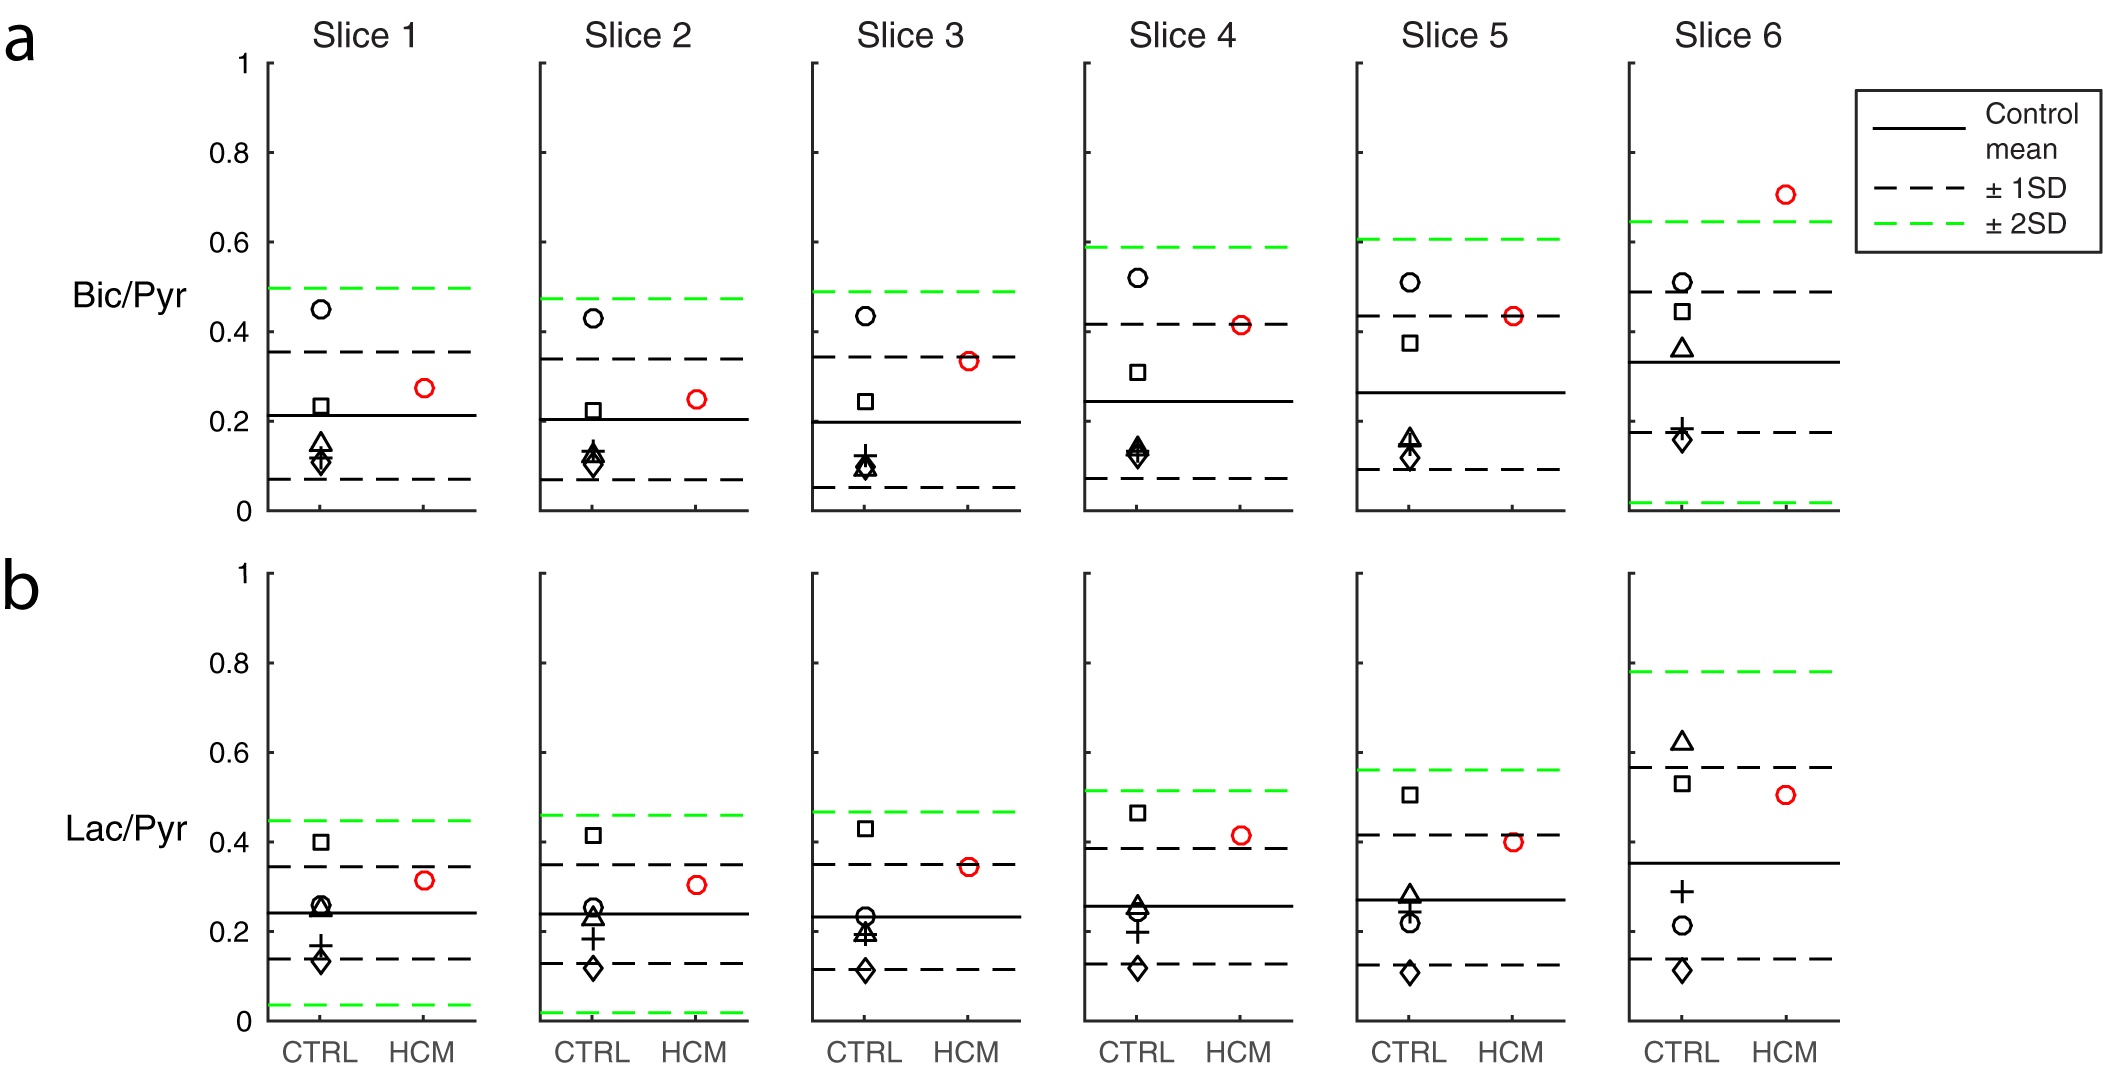
Figure 1 shows summed 13C images from both healthy volunteers and a HCM patient. The images show pyruvate distributed within the blood pool, and 13C-bicarbonate spatially localized to the myocardium. In the HCM patient, bicarbonate signal was highest towards the apex of the heart, which corresponded to the apical hypertrophy (Figure 2). Figure 3 demonstrates that the apical Bic/Pyr is 2.4 SDs above the mean (p=0.017). All other ratios lie at most 1 SD above the mean value in their respective slices. Figure 4 shows that the standard deviation of Bic/Pyr across slices in the HCM patient was 3.1 SDs above the mean (p=0.0019). A significant difference in Lac/Pyr was not detected between control and disease groups.
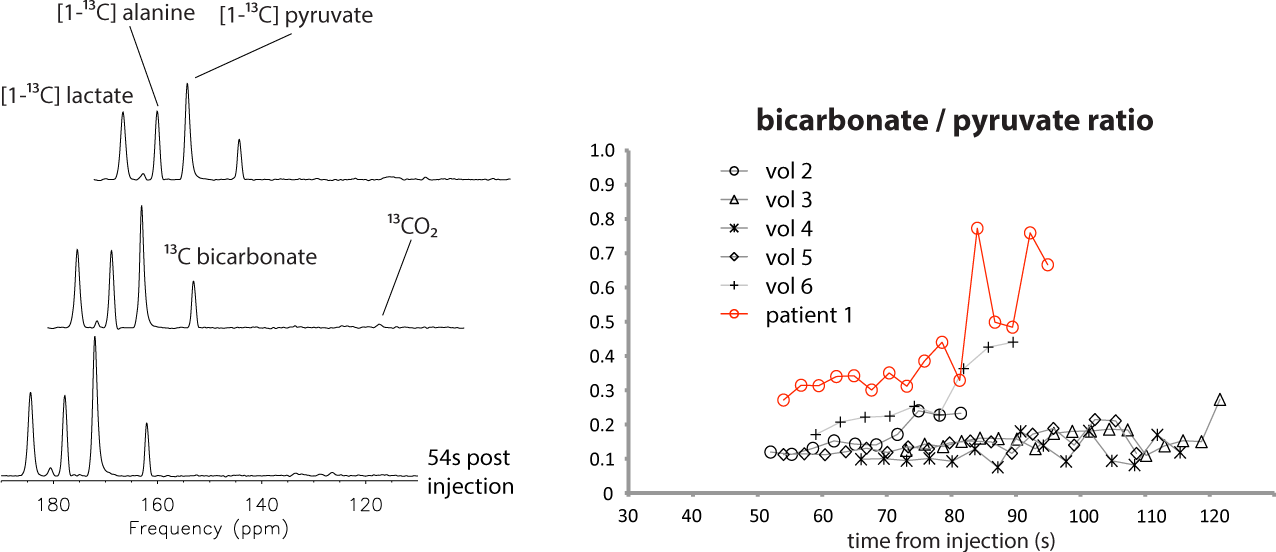
The 13C MRS data (Figure 5) agree with elevated Bic/Pyr in the HCM patient relative to control. A diffuse pattern was also observed in the bicarbonate images; this was due to an off-resonance mis-setting of the transmitter frequency by 90 Hz, which resulted in contamination by pyruvate hydrate signal within the bicarbonate image.
Conclusions
Hyperpolarized 13C metabolite imaging and spectroscopy data were acquired from a patient diagnosed with apical hypertrophic cardiomyopathy and compared with data from normals. The 13C-bicarbonate to pyruvate ratio was significantly elevated near the apex of the heart, corresponding to the known location of disease. The 13C-bicarbonate images also show a different spatial distribution from those observed in healthy volunteers. These results show good prospects for imaging the altered cardiac energetics in the diseased heart using this technology.Acknowledgements
Heart and Stroke Foundation of Canada G-14-005743 and Kathrine M. Nau for advice on statistical testing.References
- Ardenkjaer-Larsen JH et al. Increase in signal-to-noise ratio of > 10,000 times in liquid-state NMR. PNAS 2003 Sep 2;100(18):10158-63.
- Nelson SJ et al. Metabolic imaging of patients with prostate cancer using hyperpolarized [1-¹³C]pyruvate. Sci Transl Med. 2013 Aug 14;5(198):198ra108.
- Cunningham CH et al. Hyperpolarized 13C Metabolic MRI of the Human Heart: Initial Experience. Circ Res. 2016 Sep 15.
- Lau AZ et al. Rapid multislice imaging of hyperpolarized 13C pyruvate and bicarbonate in the heart. Magn Reson Med. 2010 Nov;64(5):1323-31.
Figures