0271
Explicit mathematical expression for the Cramér-Rao lower bound for experimental design and parameter estimation in parallel imaging1National Institutes of Health, Baltimore, MD, United States
Synopsis
The Cramér-Rao lower bound (CRLB) is widely used in the design of magnetic resonance (MR) experiments for parameter estimation. Previous work has considered only Gaussian or Rician noise distributions in this calculation. However, the noise distribution for multiple-coil acquisitions, such as in parallel imaging, obeys the noncentral χ-distribution under many circumstances. Here, we present the general mathematical expression for the CRLB calculation for parameter estimation from multiple-coil acquisitions. Our results indicate that the CRLB calculation must account for the noncentral χ-distribution of noise in multi-coil acquisitions, especially in the low-to-moderate signal-to-noise ratio (SNR) regime.
PURPOSE
The Cramér-Rao lower bound (CRLB) defines the best achievable precision of any unbiased estimator for a deterministic parameter, given a data model (1-2), and is widely used in the design of MR experiments for parameter estimation (3-6). The purpose of this work is to present the explicit mathematical expression for the CRLB in multiple-coil acquisitions, such as parallel imaging.THEORY
Noncentral χ-distribution
The probability density function (PDF) for signal intensity within a given voxel of a magnitude image reconstructed from multiple-coil acquisitions is given by (7):
$$P_χ (M,A,σ,m)=\frac{A^{1-m}}{σ^2}\ M^m\ exp(-\frac{M^2+A^2}{2σ^2})\ I_{m-1}(\frac{MA}{σ^2}),\ \ \ \ [1]$$
where A is the magnitude of the underlying noise-free signal, M is the magnitude of the observed signal, m is the number of coils, σ2 is the noise variance, and Im is the modified mth order Bessel function of the first kind.
CRLB for the noncentral χ-distribution
Calculation of the CRLB requires inversion of the Fisher matrix (1-6). For N measured data values fit to a signal model defined by a parameter vector β, the Fisher matrix elements for the noncentral χ-distribution are:
$$F_{ij}=-E[\frac{∂}{∂β_i}\frac{∂}{∂β_j}\ log(L_χ (M,A,σ,m))]=-E[\frac{∂}{∂β_i}\frac{∂}{∂β_j}\log(\prod_{n=1}^NP_χ (M_n,A_n,σ,m))],\ \ \ [2]$$
where E stands for expectation value, and Lχ is the likelihood function. The CRLB for the standard deviation (SD) of an unbiased parameter βi is:
$$SD(β_i )=\sqrt{F_{ii}^{-1}}.\ \ \ \ [3]$$
After some algebra, Eq.2 reduces to
$$F_{ij}=\frac{1}{σ^2} \sum_{n=1}^N\frac{∂A_n}{∂β_i}\frac{∂A_n}{∂β_j}\ R_n,\ \ \ [4]$$
where
$$R_n=-\frac{A_n^2}{σ^2}+\frac{A_n^{1-m}}{σ^4} \int_{0}^{∞}M_n^{m+2}\ \frac{I_m^2(z_n)}{I_{m-1}(z_n)}\ exp(-\frac{M_n^2+A_n^2}{2σ^2})\ dM\ \ \ [5]$$
and must be calculated numerically.
METHODS
PDF and Rn as a function of SNR and number of coils
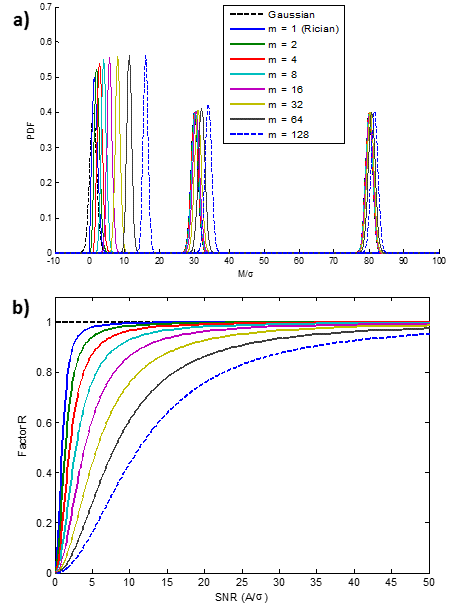
The PDF of voxel intensity, given by Eq.1, was calculated for different values of m as a function of M/σ and for A=1, 40 and 80. Results were also obtained using a Gaussian PDF, appropriate for single coil acquisition at high SNR. Note that m=1 represents the conventional Rician noise model. In addition, the factor given by Eq.5 was calculated as a function of SNR for different values of m.
CRLB of diffusion kurtosis signal model
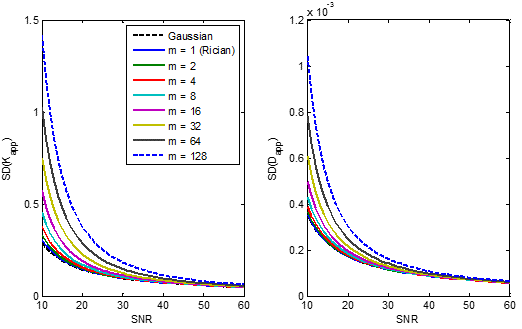
We consider a model, $$$A(β,b_n )=A_0\ exp(-b_n D_{app}+(b_n^2 D_{app}^2 K_{app})⁄6)$$$, describing diffusion kurtosis as a function of b-value and parameter set β=(A0, Dapp, Kapp), where Dapp and Kapp are the apparent diffusion coefficient and kurtosis, and A0 is the weighted signal obtained at b= 0 s/mm2. We evaluated the minimum SDs (i.e. CRLB) in the estimation of Dapp and Kapp as a function of SNR and for different m. Four b-values of 0, 1000, 2000, and 3000 s/mm2 were considered.
Monte Carlo (MC) simulation
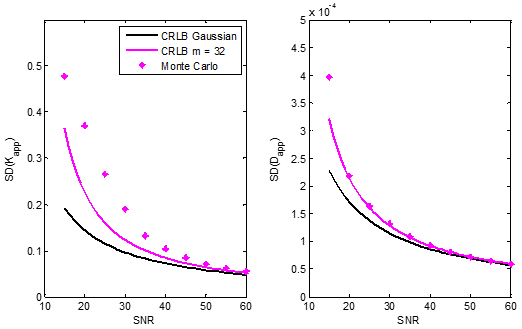
MC simulations were used to assess the SDs in the estimation of Dapp and Kapp as a function of SNR. This approach mimics actual experimental implementation, as opposed to the calculated CRLB, which is a theoretical bound. Input parameters were identical to those used above, with analysis restricted to m=32. For each SNR, 10000 noisy signals were created and reconstructed using the sum-of-squares method (7) and fit to the expectation value of the noncentral χ-distribution (7-8).
RESULTS & DISCUSSION
Fig.1a shows that while at high SNR the noncentral χ-distribution approaches a Gaussian, at low-to-moderate SNR it deviates substantially from the Gaussian distribution. This departure is more pronounced for larger values of m. Fig.1b shows that for A>>σ (high SNR), the value of Rn approaches 1, in which case the Fisher matrix for the noncentral χ-distribution becomes identical to that of the Gaussian distribution for any m. At low-to-moderate SNR, the deviation from Rn=1 increases as m increases; we see that at low-to-moderate SNR, the Fisher matrix for the noncentral χ-distribution cannot be approximated by the Gaussian distribution.
Fig.2 shows that for all m, the SDs in the estimation of Kapp and Dapp decrease roughly exponentially with increasing SNR. Furthermore, the SDs increase with increasing m, indicating that the Gaussian approximation in the CRLB calculation is overly optimistic, especially at low-to-moderate SNR. At high SNRs, SDs in derived parameter estimates from both Gaussian- and noncentral χ-distributions converge, as expected, to the same values.
Fig.3 shows that the minimal theoretical SDs as defined by the CRLB can be achieved at moderate-to-high SNR. Most importantly, the CRLB assuming a noncentral χ-distribution for noise provided a closer match to the MC simulations as compared to the Gaussian CRLB results, as expected.
CONCLUSIONS
We have provided a general expression for the Fisher matrix, as used in the CRLB calculation, for imaging data described by noncentral χ-distributions, and demonstrated that the Gaussian assumption in the CRLB calculations may not hold in the setting of low-to-moderate SNR regime. These results have immediate application to experimental design for parallel imaging.Acknowledgements
This work was supported by the Intramural Research Program of the National Institute on Aging of the National Institutes of Health.References
1. Rao CR. Information and the Accuracy Attainable in the Estimation of Statistical Parameters. In: Kotz S, Johnson NL, editors. Breakthroughs in Statistics: Foundations and Basic Theory. New York, NY: Springer New York; 1992. p. 235-47.
2. Cramér H. Mathematical methods of statistics. Princeton University Princeton, NJ: Princeton University Press; 1946.
3. Bouhrara M, Reiter DA, Celik H, Bonny JM, Lukas V, Fishbein KW, Spencer RG. Incorporation of rician noise in the analysis of biexponential transverse relaxation in cartilage using a multiple gradient echo sequence at 3 and 7 tesla. Magnetic resonance in medicine. 2015;73(1):352-66.
4. Karlsen OT, Verhagen R, Bovee WM. Parameter estimation from Rician-distributed data sets using a maximum likelihood estimator: application to T1 and perfusion measurements. Magnetic resonance in medicine. 1999;41(3):614-23.
5. Celik H, Bouhrara M, Reiter DA, Fishbein KW, Spencer RG. Stabilization of the inverse Laplace transform of multiexponential decay through introduction of a second dimension. Journal of magnetic resonance (San Diego, Calif : 1997). 2013;236:134-9.
6. Alexander DC. A general framework for experiment design in diffusion MRI and its application in measuring direct tissue-microstructure features. Magnetic resonance in medicine. 2008;60(2):439-48.
7. Aja-Fernández S, Vegas-Sánchez-Ferrero G. Statistical Analysis of Noise in MRI: Springer International Publishing; 2016.
8. Wang C, He T, Liu X, Zhong S, Chen W, Feng Y. Rapid look-up table method for noise-corrected curve fitting in the R2* mapping of iron loaded liver. Magnetic resonance in medicine. 2015;73(2):865-71.
Figures