0270
Silent T1-Mapping Using the Variable Flip Angle Method with Zero Echo Time1Neuroimaging, King's College London, London, United Kingdom, 2GE Healthcare, Munich, Germany, 3Medicine, University of British Columbia, Vancouver, BC, Canada, 4Physics and Astronomy, University of British Columbia, Vancouver, BC, Canada, 5Radiology, University of British Columbia, Vancouver, BC, Canada
Synopsis
In this work we present a silent whole brain T1-mapping technique with zero echo time using a variable flip angle (VFA) scheme with a 3D radial sequence (RUFIS). The technique is compared to a conventional Cartesian gradient-echo based sequence (DESPOT1-HIFI) in a quantitative T1 phantom as well as in vivo in a single subject. Phantom measurements showed good agreement between techniques with average difference of 28 ms. In vivo T1 maps showed good correspondence between RUFIS and DESPOT1-HIFI.
Introduction
The Variable Flip Angle (VFA) method is an efficient acquisition technique for T1-mapping1. Developments in scanner hardware now allow for acquisition of the Free Induction Decay (FID), with essentially zero echo time (ZTE). The Radial Ultra-Fast Imaging Sequence (RUFIS)2 is a ZTE sequence where the gradients are gradually increased between excitations, making the acquisition completely silent. In this work we investigate the potential of using RUFIS for silent VFA T1-mapping, discuss the benefits and limitations imposed by the RUFIS sequence, and present the achievable results in phantom and in vivo.Methods
Theory
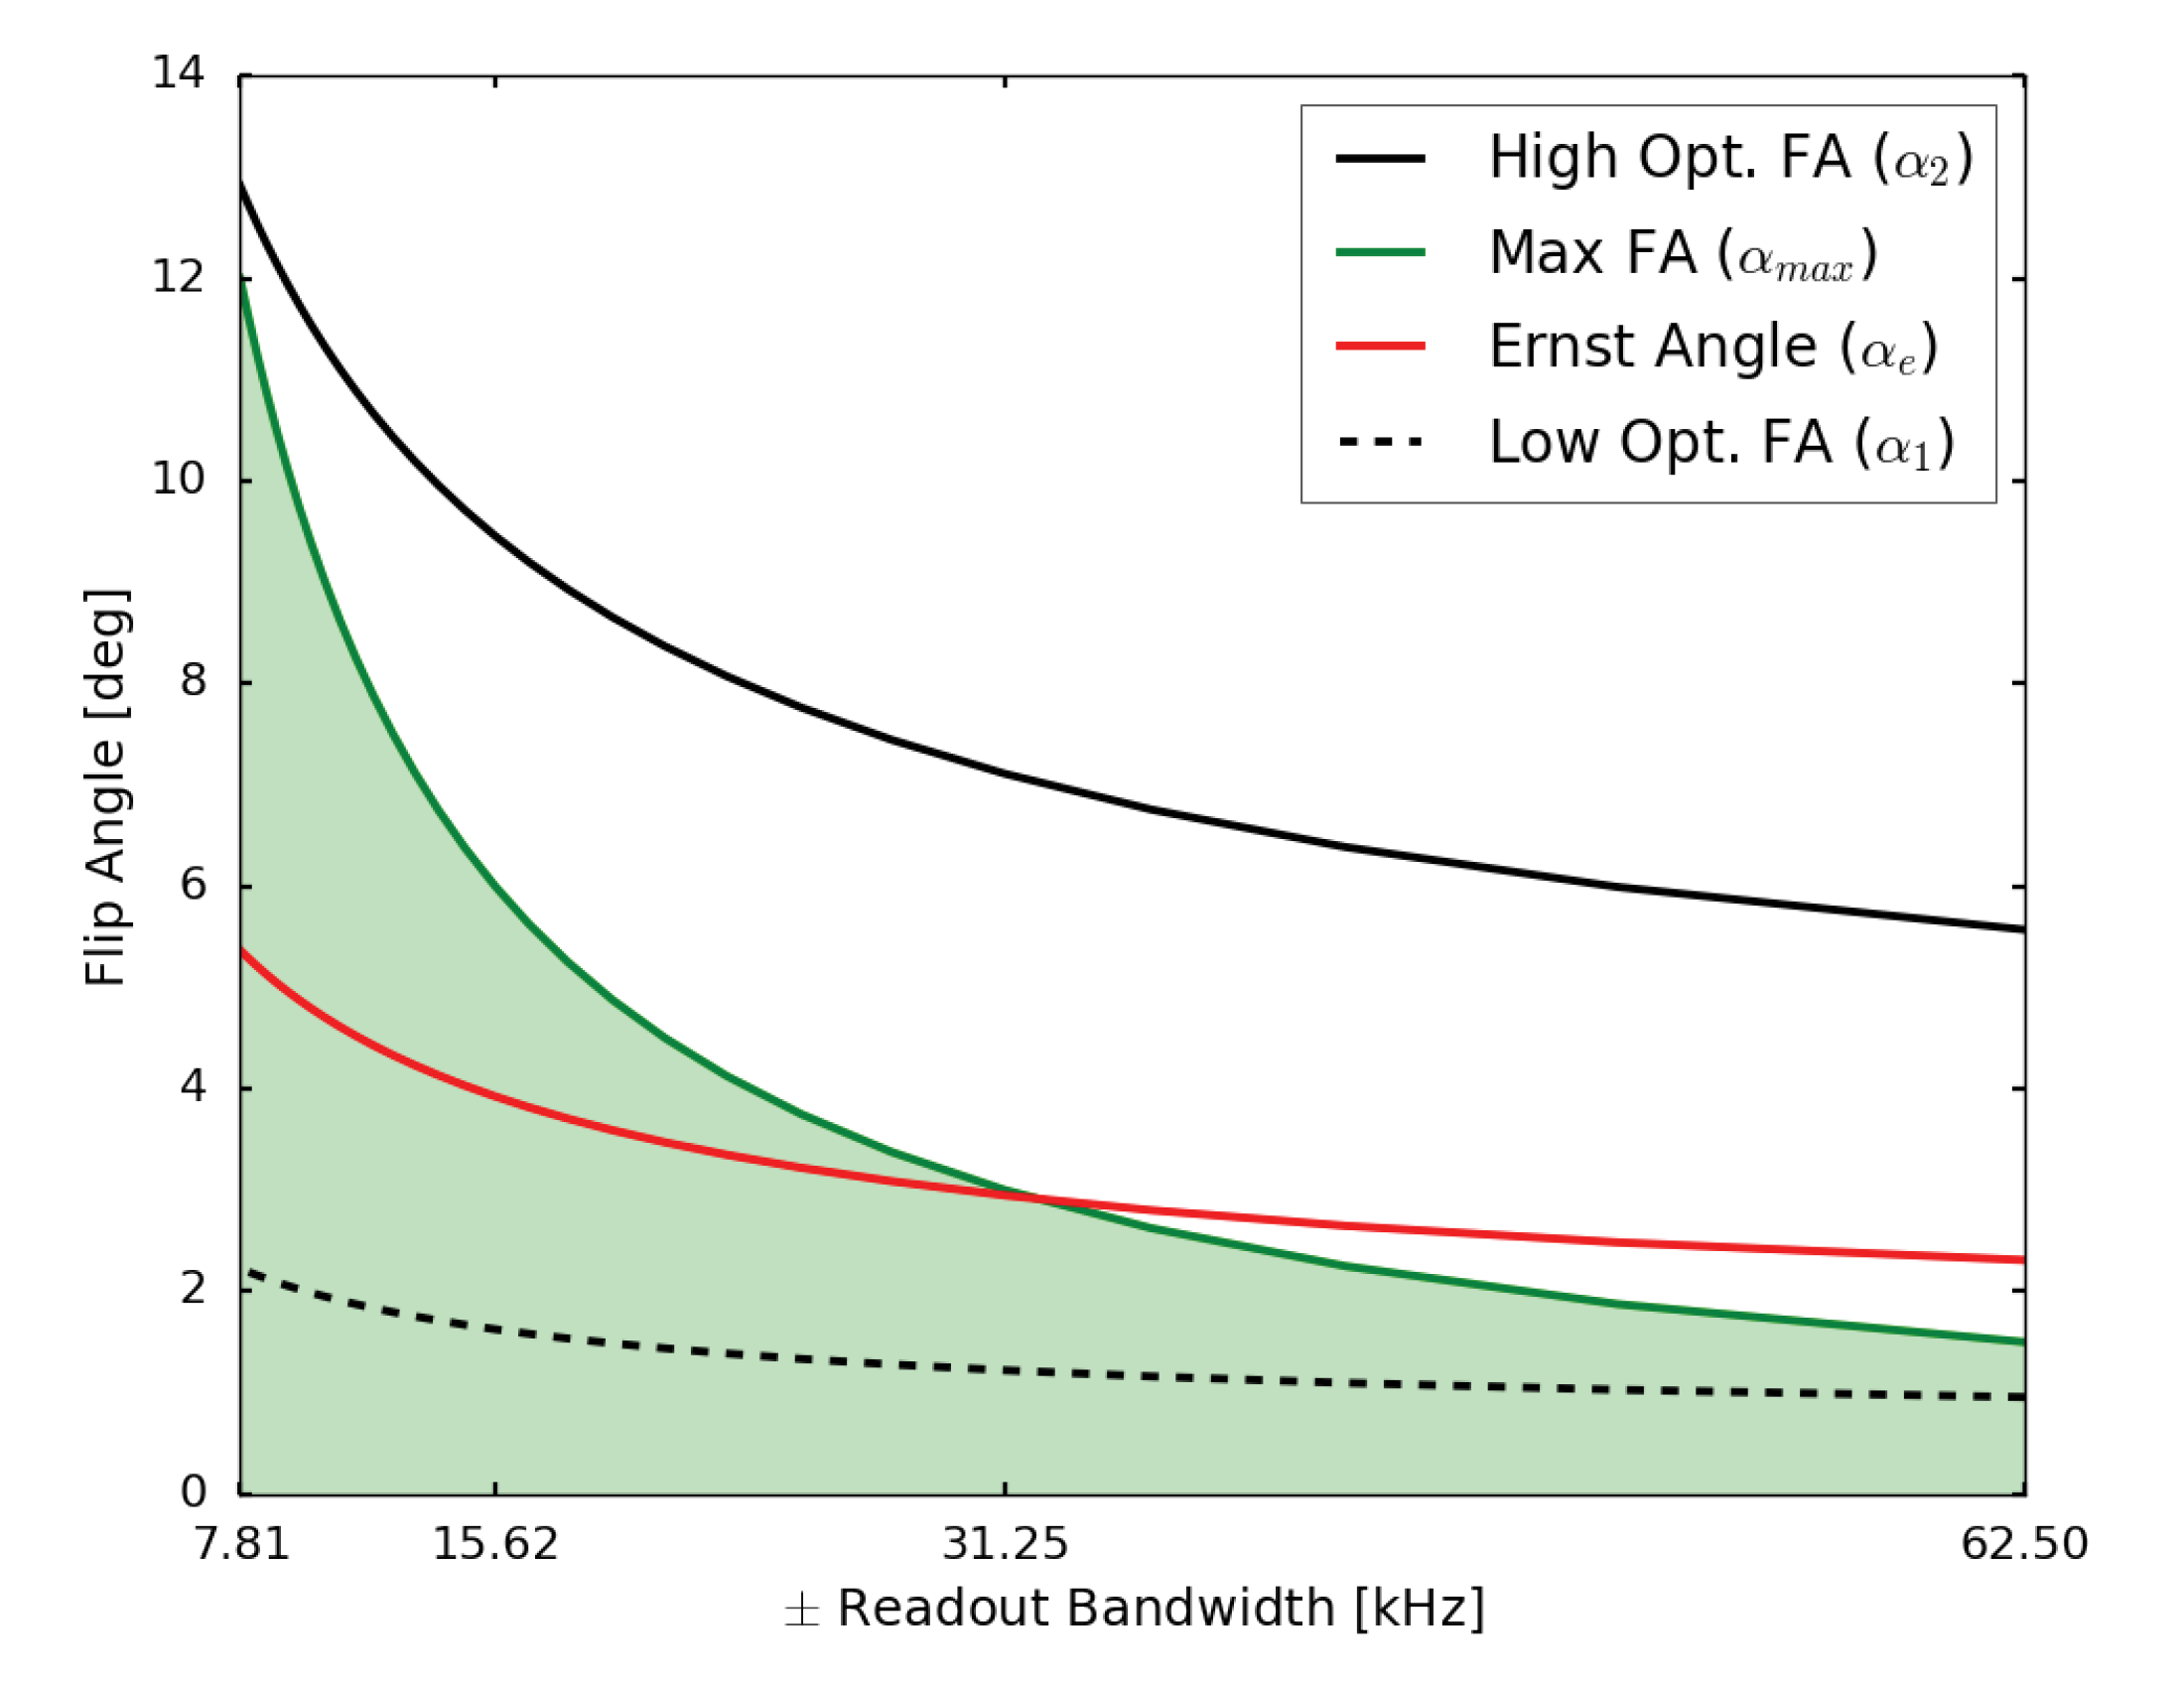
For VFA T1-mapping, at least one high flip angle beyond the Ernst angle is desirable. However, the RUFIS pulse sequence design restricts the choice of acquisition parameters in comparison to traditional Cartesian readout. First, the repetition time between spokes (TR) is limited by the product of the inverse receive bandwidth and matrix size. For a given bandwidth, the excitation pulse width is limited by the sinc-shaped slice profile produced, as the RF pulse is applied during the same gradient as data readout. Here we set pw·bw≤0.5 which limits the variation across the imaging volume to sinc(0.5)=0.64. With a set pulse width, the maximum flip angle (αmax) is then limited by the performance of the RF amplifier. Thus, using higher bandwidth to reduce the TR will also reduce αmax. This limits the performance of T1-mapping with regards to the Ernst angle (αe) and the optimal pair of flip angles (α1,α2)3 for a two-point approach (see Figure 1).
Sequence parameters
Data were acquired on a GE MR750w 3T scanner with the GEM Head-Neck coil array (GE Healthcare, Chicago, WI), using RUFIS and an optimized DESPOT1-HIFI4 protocol for comparison. Both datasets were acquired at 1.5 mm isotropic nominal voxel size. RUFIS parameters were chosen as: BW=±7.8 kHz yielding TR=4.44 ms, flip angles (α)=10,9,8,7,6,5,4,3,2,1˚, acquisition time=1:23 min/α. DESPOT1-HIFI protocol parameters; SPGR parameters: TR=10.8 ms, α=1.5,3,10,20˚, IR-SPGR parameters: α=5˚, TR=10.8 ms, TI=450 ms, total acquisition time=5:48 min. T1 and proton density maps were obtained using a non-linear least-squares fitting algorithm5. The RUFIS slice profile was simulated using a 3D sinc function6. Due to the low bandwidth for RUFIS, center of k-space was recovered during the gridding procedure in reconstruction7.
Phantom Experiment
T1 values were measured in the EUROSPIN TO5 phantom8 (T1 range: 450-1640 ms) and evaluated in each vial in a single slice. Acoustic noise measurements were performed at the isocenter center of the bore.
In vivo Experiment
A healthy volunteer was scanned with sequence parameters identical to the phantom scan. A high resolution 3D T1-weighted scan was also acquired for accurate tissue segmentation. White and gray matter (WM/GM) masks were obtained using FSL FAST9. The T1 map from RUFIS was analyzed using only 4 flip angles (1,4,7,10˚) to match the acquisition time of the DESPOT1-HIFI protocol.
Statistical Analysis
Bland-Altman analysis was used to evaluate differences in the T1 measurements obtained in the phantom. Whole brain WM and GM histograms were calculated for T1 in vivo.
Results
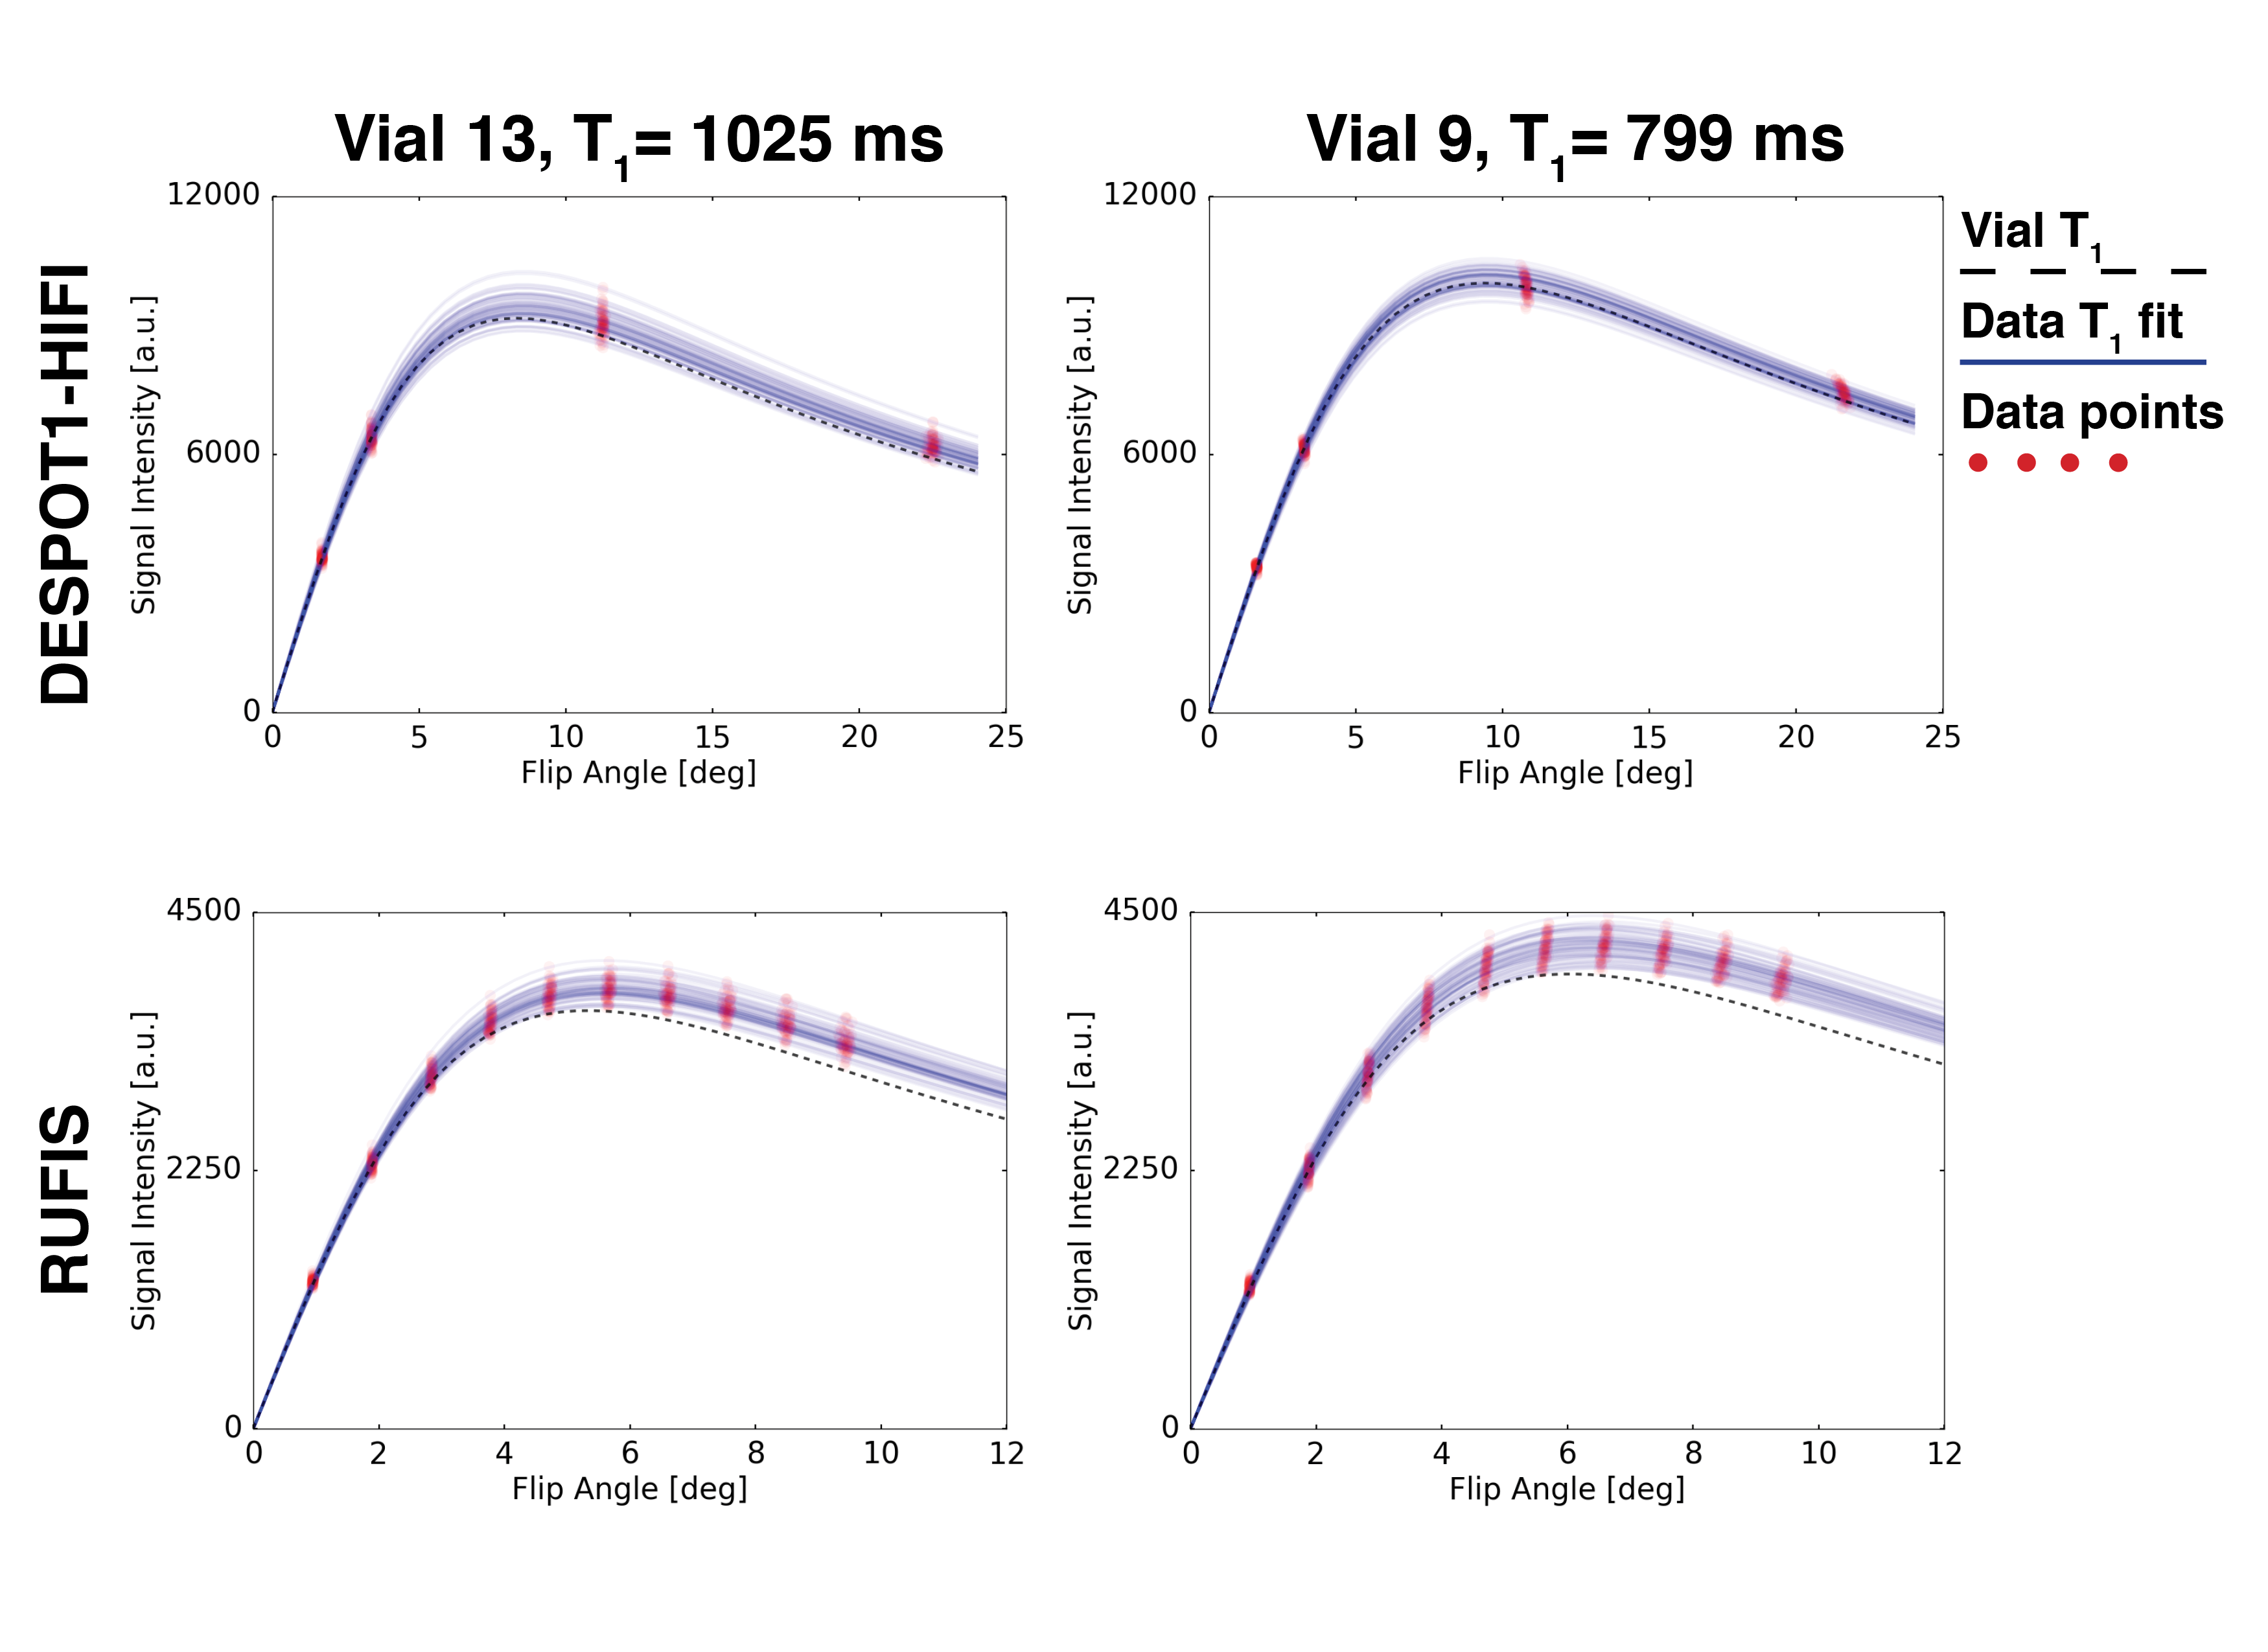
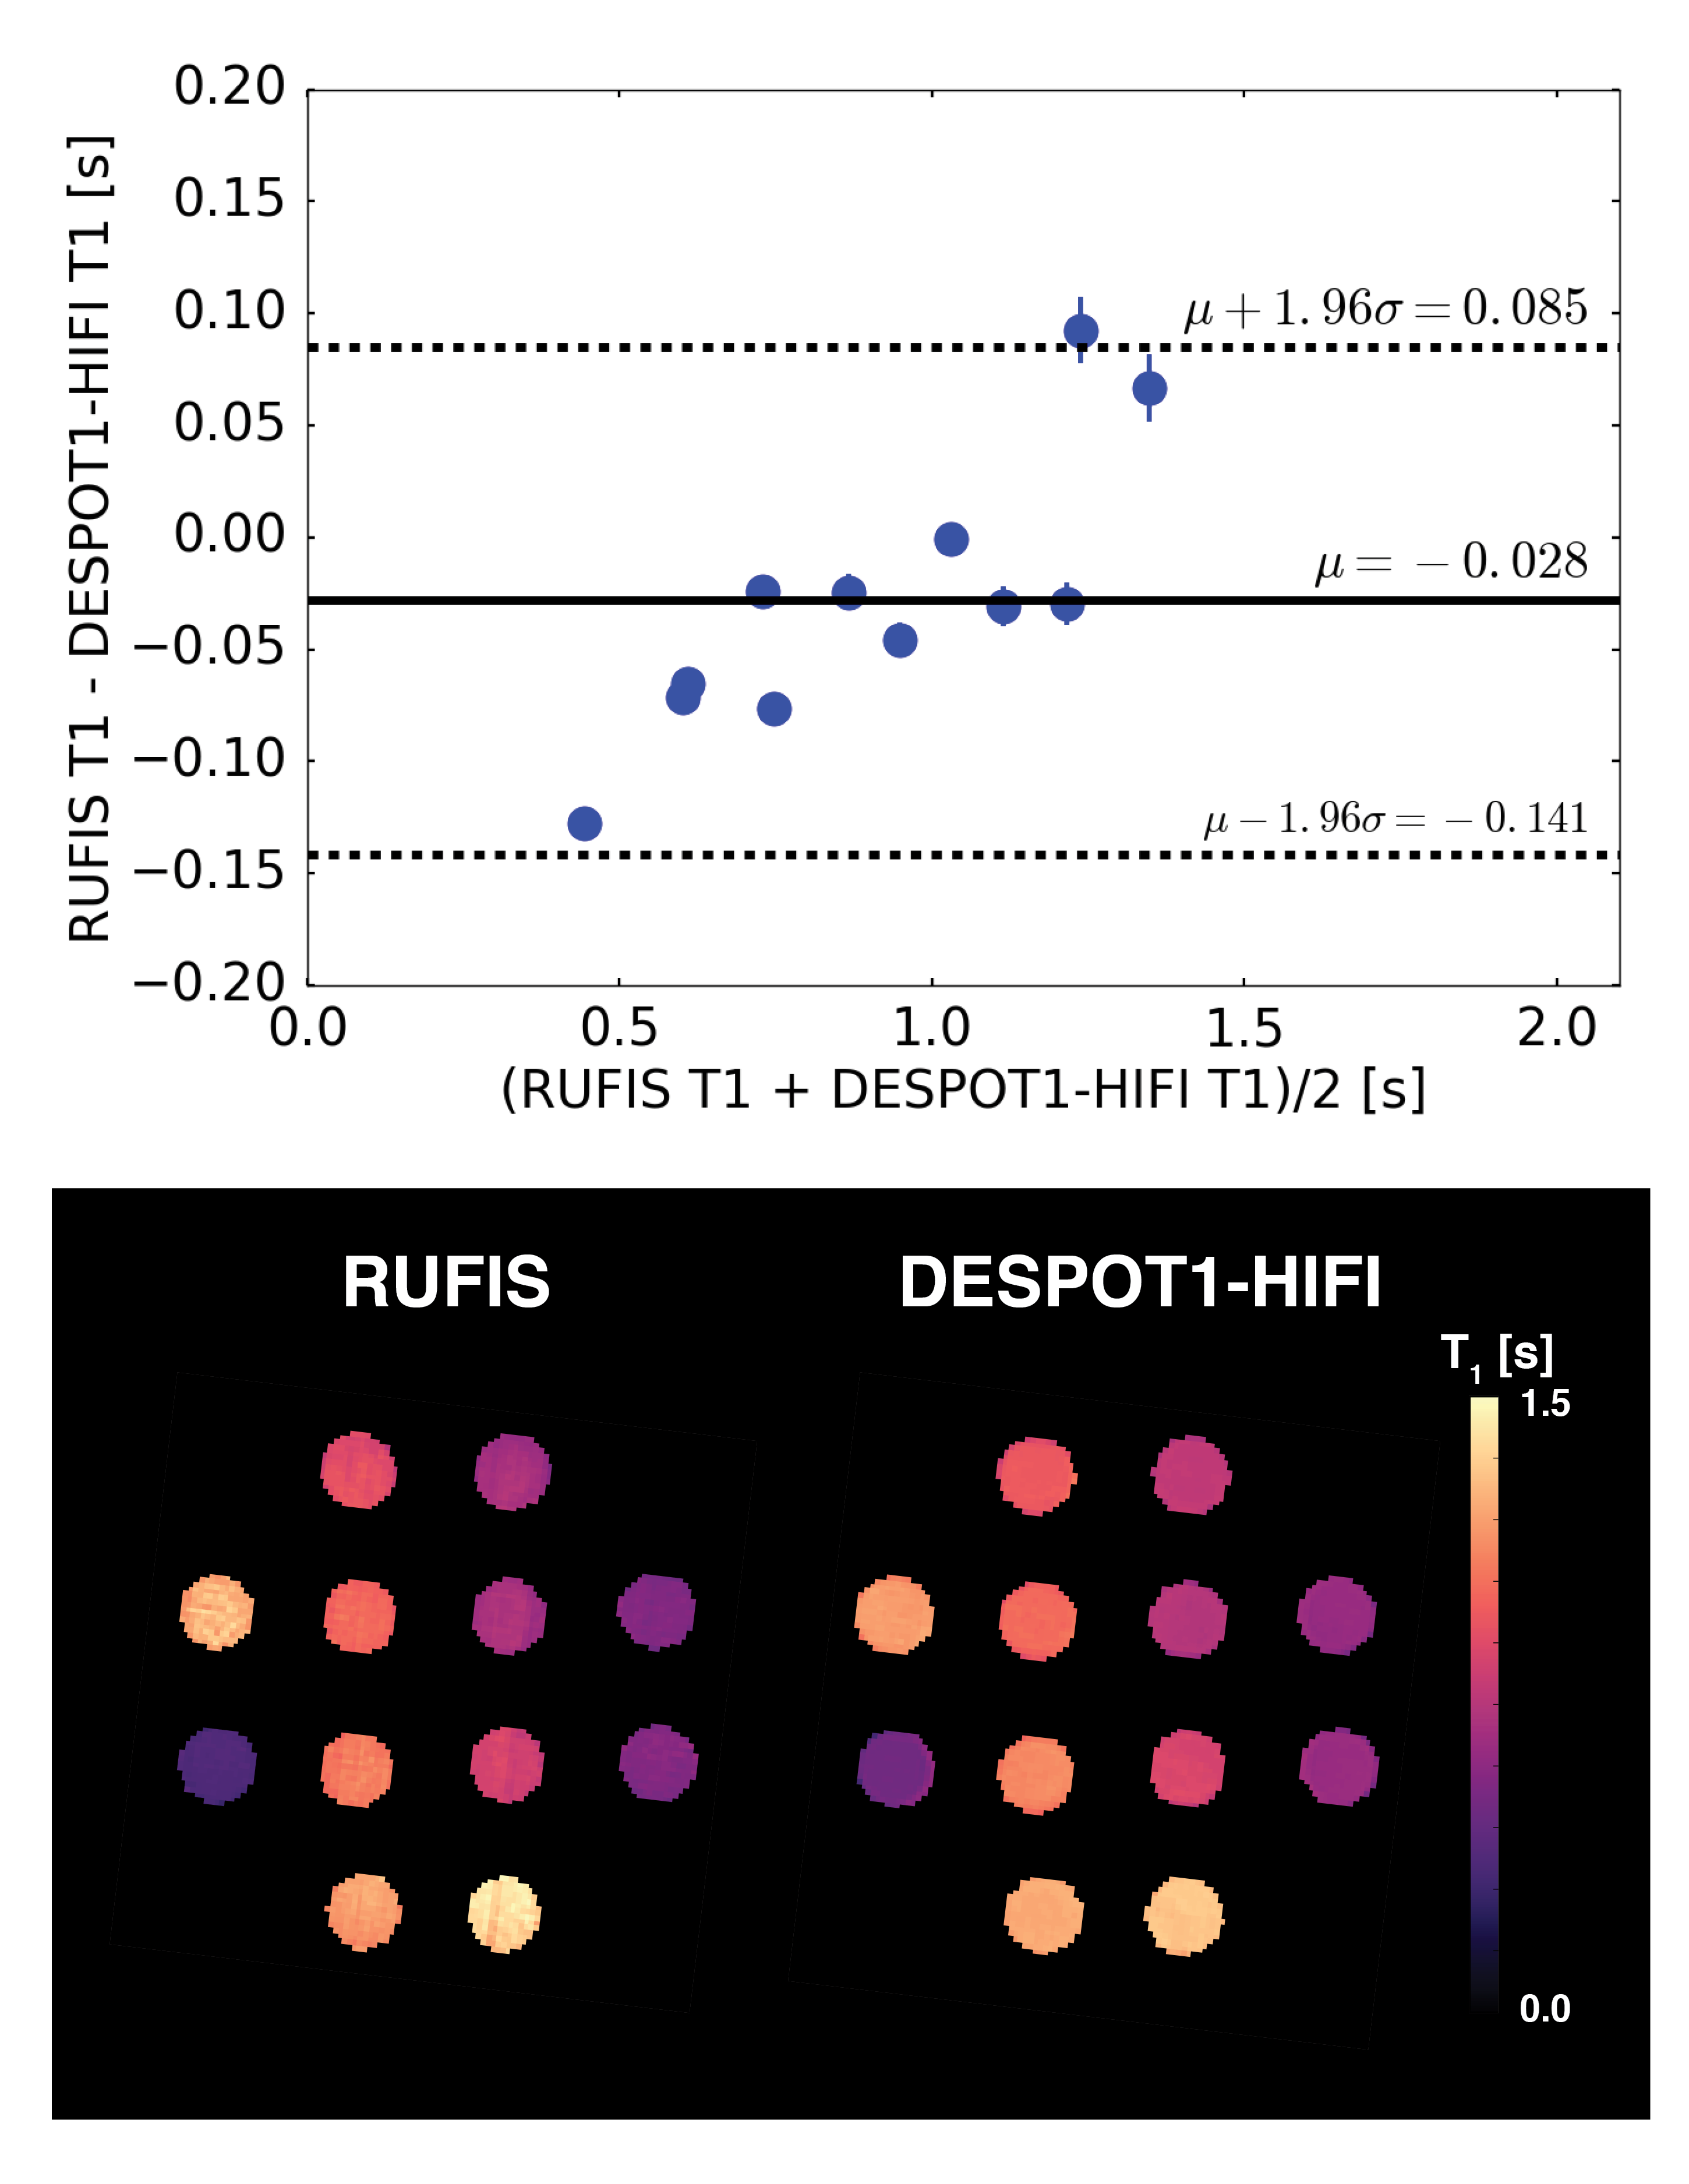
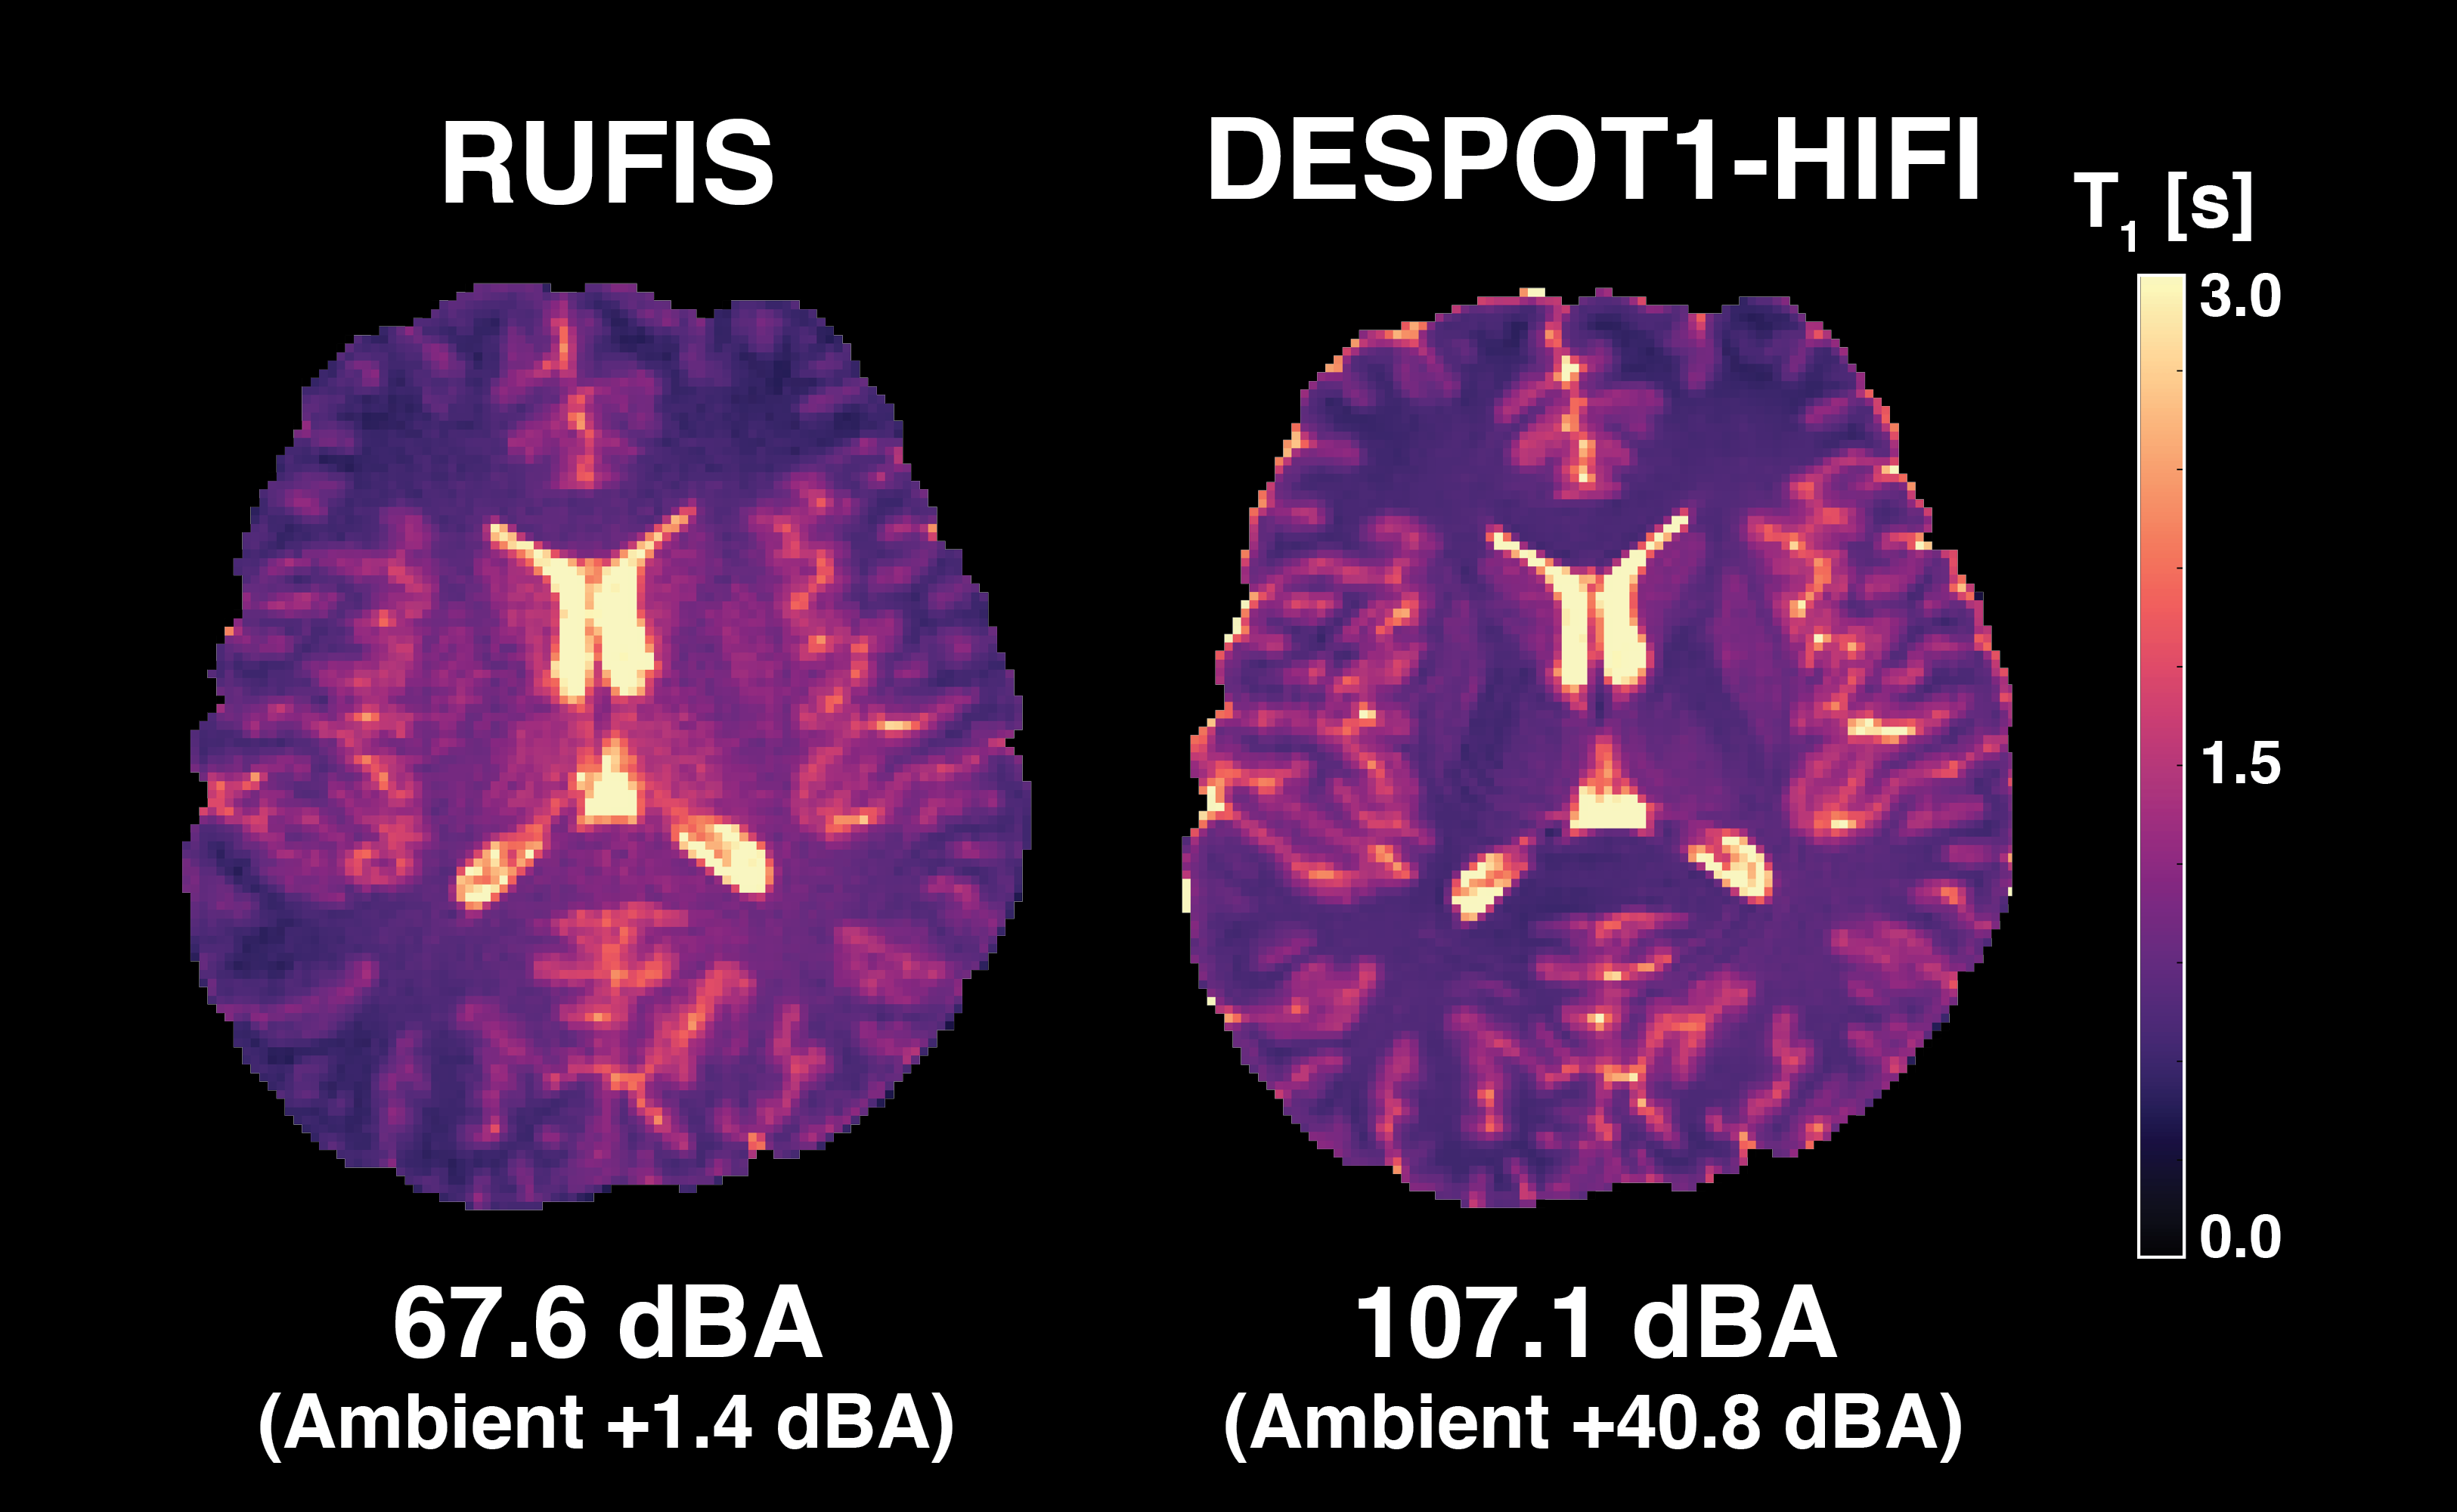
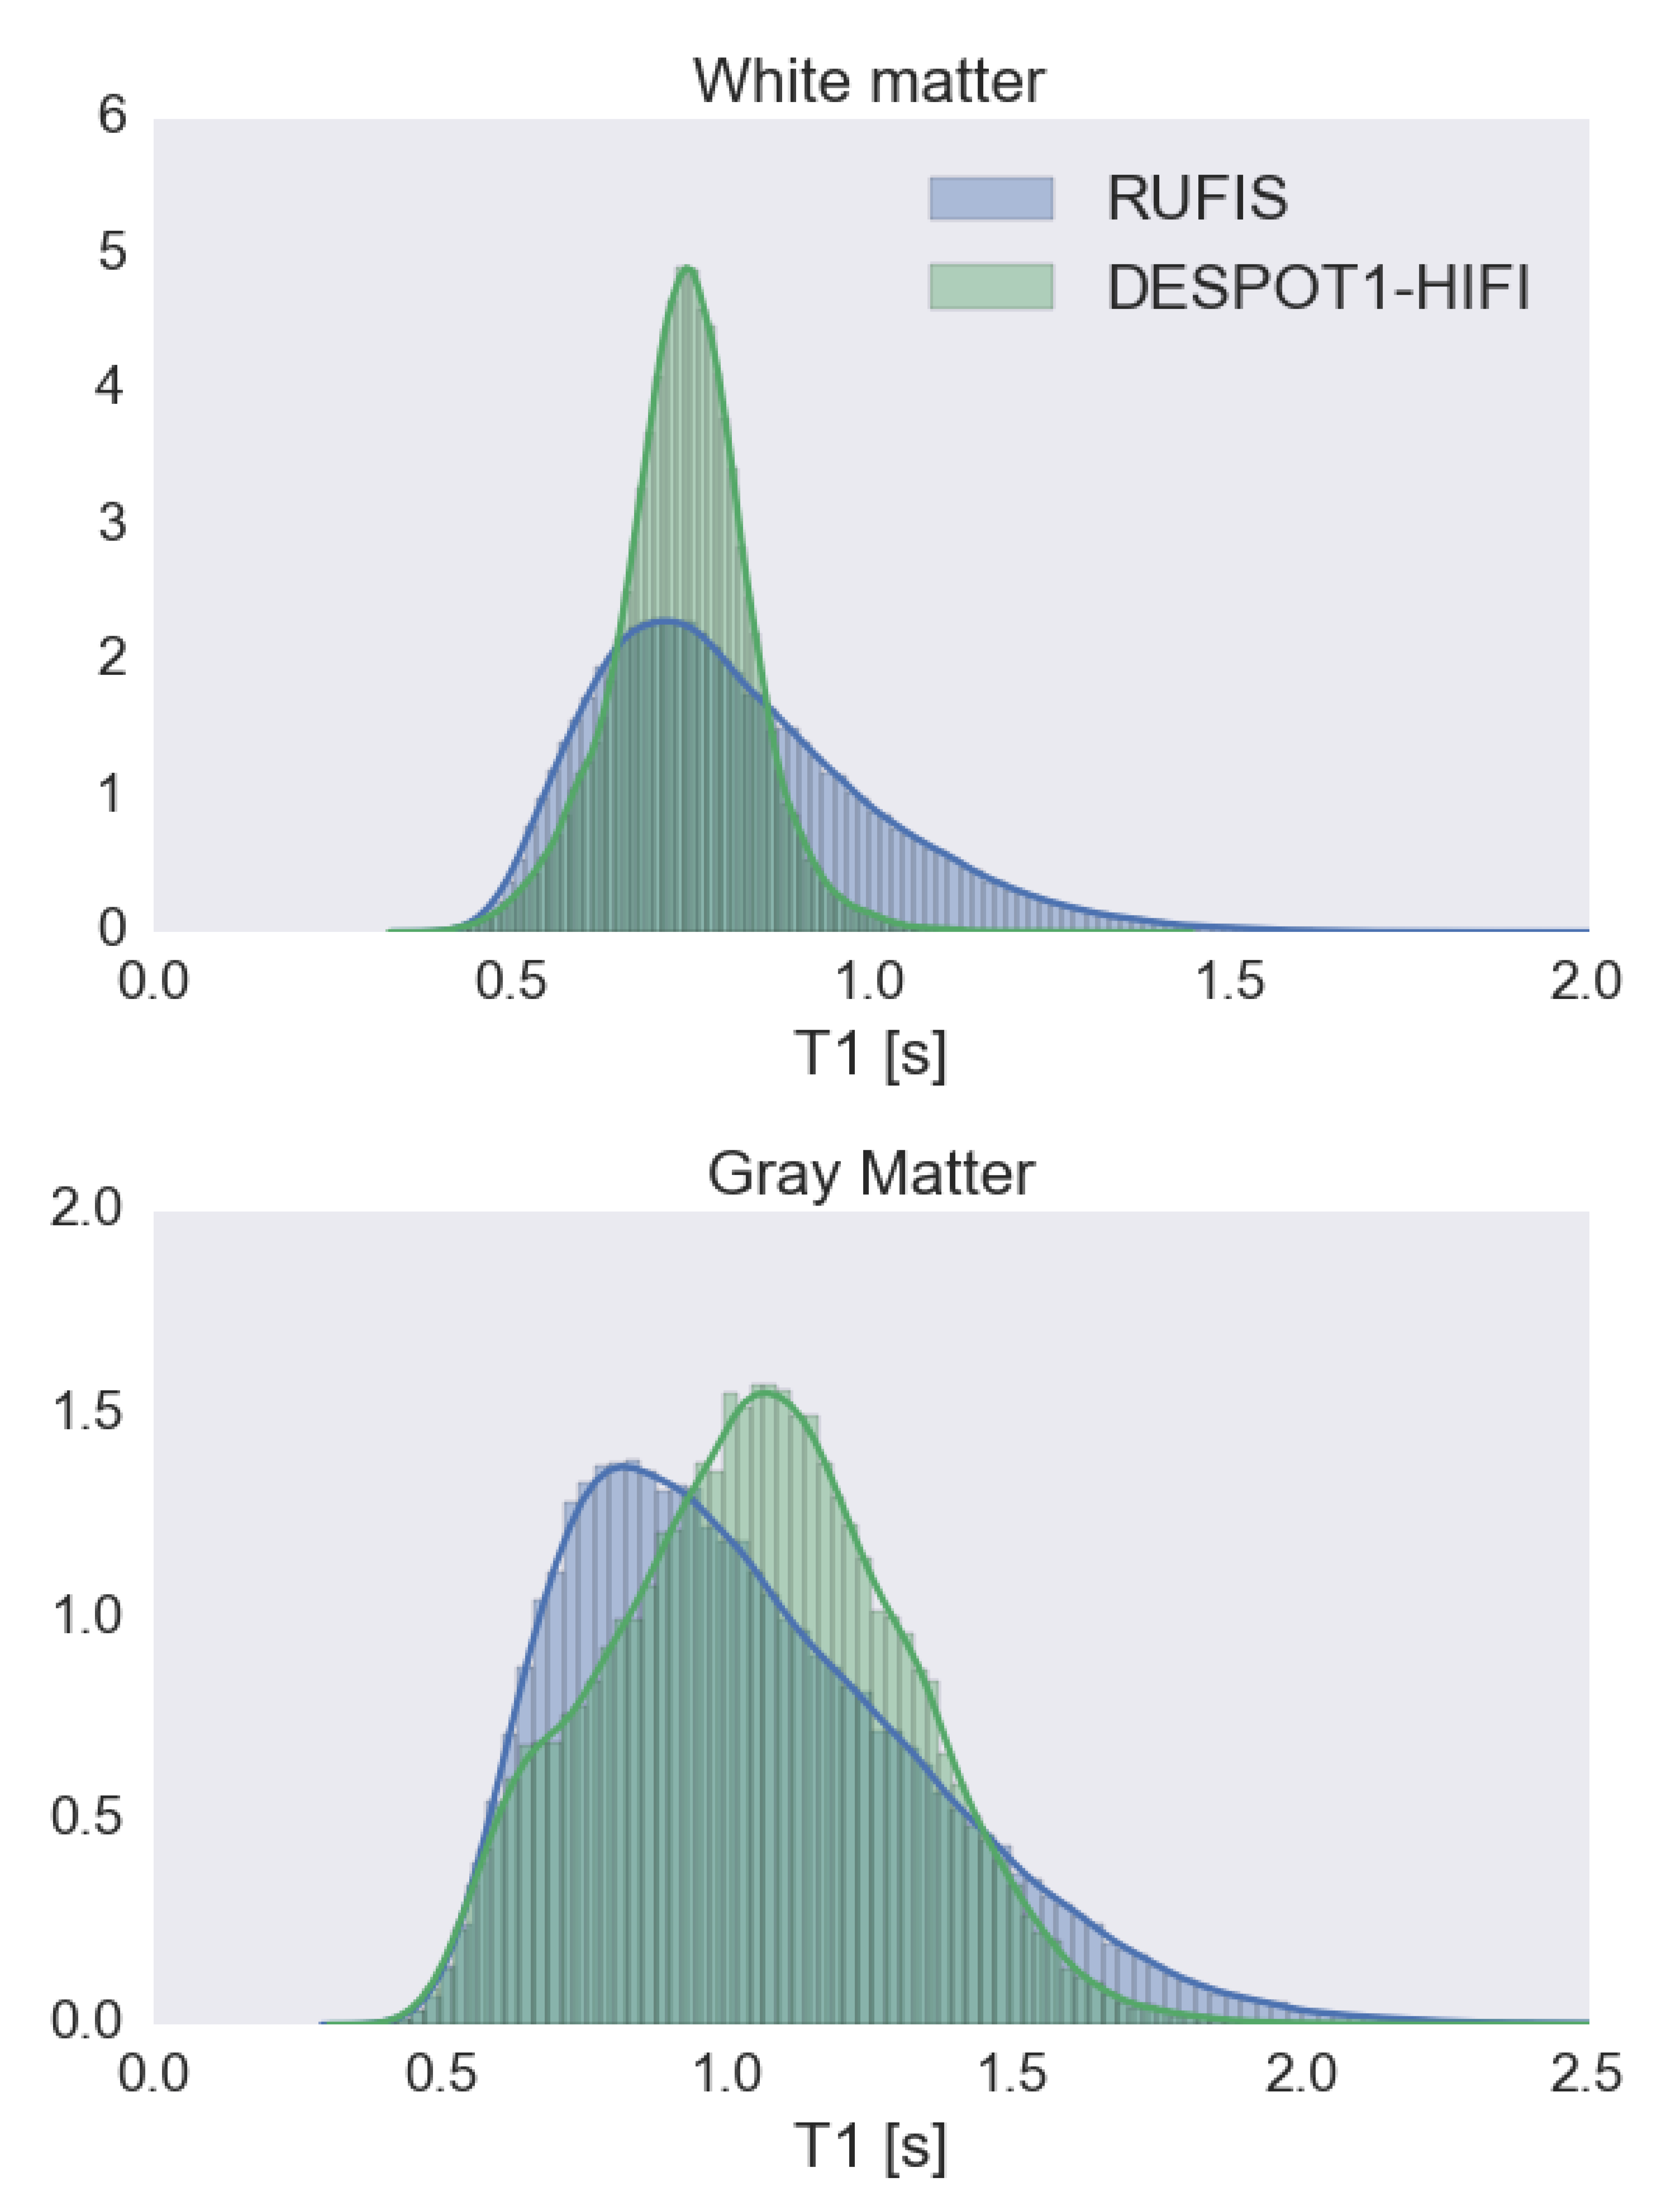
Signal curves for RUFIS and DESPOT1-HIFI are presented in Figure 2, demonstrating that the VFA model is valid for RUFIS1. Phantom measurements of T1 showed good correspondence between RUFIS and DESPOT1-HIFI as seen in Figure 3 (average difference of -28 ms). In vivo T1 maps are presented in Figure 4. Figure 5 shows whole brain histograms of T1 in WM and GM, where the T1 values from RUFIS appeared to be slightly lower than DESPOT1-HIFI. Average acoustic noise levels were 107.1 dBA for DESPOT1-HIFI and 67.6 dBA for RUFIS; ambient noise was 66.3 dBA.Discussion
Comparison between RUFIS and DESPOT1-HIFI showed good correspondence in both the phantom and in vivo. However, residual B1 effects were observed in the in vivo data from RUFIS, causing an increase in T1 in the center of the brain. This is also seen in the WM T1 histograms in Figure 5, which shows a longer tail for RUFIS. Further work will be dedicated to a direct in vivo measure of the slice profile as well as a B1-mapping technique for hard, ultrashort, RF pulses.
Given the different TEs we do not expect an exact correspondence between RUFIS and DESPOT1-HIFI, as RUFIS is expected to be sensitive to ultrashort T2-components invisible to DESPOT1-HIFI10. This will be subject to further investigation.
Conclusion
We have shown that RUFIS can be used for silent T1-mapping using the variable flip angle method. This makes quantitative imaging feasible in populations where acoustic noise is an issue such as pediatric cohorts.Acknowledgements
No acknowledgement found.References
- Cheng, H.-L. M. & Wright, G. A. Rapid High-Resolution T1 Mapping by Variable Flip Angles: Accurate and Precise Measurements in the Presence of Radiofrequency Field Inhomogeneity. Magn. Reson. Med. 55, 566–574 (2006).
- Madio, D. P. & Lowe, I. J. Ultra-Fast Imaging Using Low Flip Angles and FIDs. Magn. Reson. Med. 34, 525–529 (1995).
- Wood, T. C. Improved formulas for the two optimum VFA flip-angles. Magn. Reson. Med. 74, 1–3 (2015).
- Deoni, S. C. L. High-Resolution T1 Mapping of the Brain at 3T with Driven Equilibrium Single Pulse Observation of T1 with High-Speed Incorporation of RF Field Inhomogeneities (DESPOT1-HIFI). J. Magn. Reson. Imaging 26, 1106–1111 (2007).
- Wood, T. C. QUIT. (2017). at <https://github.com/spinicist/QUIT>
- Grodzki, D. M., Jakob, P. M. & Heismann, B. Correcting slice selectivity in hard pulse sequences. J. Magn. Reson. 214, 61–67 (2012).
- Froidevaux, R. et al. Filling the dead time gap in zero echo time MRI: principles compared. Magn. Reson. Med. 0, 1–10 (2017).
- Lerski, R. A. & de Certaines, J. D. II. Performance assessment and quality control in MRI by Eurospin test objects and protocols. Magn. Reson. Imaging 11, 817–833 (1993).
- Zhang, Y., Brady, M. & Smith, S. Segmentation of brain MR images through a hidden Markov random field model and the expectation-maximization algorithm. Med. Imaging, IEEE Trans. 20, 45–57 (2001).
- Du, J. et al. Measurement of T1 of the Ultrashort T2* Components in White Matter of the Brain at 3T. PLoS One 9, (2014).
Figures