0269
Quantitative Measurements of Deep Medullary Vein Caliber and Oxygenation Level Using MRI Phase and Complex Images1Biomedical Research Imaging Center and Department of Radiology, University of North Carolina at Chapel Hill, Chapel Hill, NC, United States
Synopsis
Collagenosis-induced narrowing of deep medullary vein (DMV) caliber has been implicated as one of the main causes of small vessel disease. However, a non-invasive imaging method for monitoring the DMV narrowing is still lacking. We present an MRI method for non-invasive measurement of DMV caliber and oxygenation level base on MRI phase and complex images acquired using a double echo gradient echo sequence at 7 T. The measured DMV caliber distribution agreed well with earlier report. Our approach can serve as an invaluable tool for studying the role of venous lumen narrowing in the pathogenesis of small vessel disease.
Introduction
Collagenosis induced narrowing of deep medullary vein (DMV) caliber can reduce arteriovenous pressure differences and thus blood flow. Therefore, collagenosis may be a potential contributor of cerebral small vessel diseases (SVD).1-3 Non-invasive measurements of DMV caliber may serve as an early imaging biomarker of SVD. However, such a technique is still lacking. Although the CISSCO4 method can simultaneously estimate vessel size and susceptibility in the presence of partial volume effects, it is not applicable to the DMVs due to the small DMV diameters (100 – 250 μm).5 Here, we propose to estimate DMV caliber using magnetic moment of DMVs measured from extravascular spatial phase patterns and venous blood-tissue susceptibility difference (Δχ) measured on larger ventricular veins, assuming an equal Δχ in DMV and downstream ventricular veins. Under the same assumption, the DMV oxygenation level (Yv) can also be obtained from Δχ.6Theory
The phase shift (Φ) resulting from magnetic field generated by a long blood vessel in a voxel is: Φ=γB0Δχa2sin2θcos(2φ)TE/2r2, where γ is the gyromagnetic ratio, B0 the main magnetic field strength, a the vessel radius, θ the angle between the vessel and B0, φ the angle between B0 projection to the perpendicular plane and the line from the voxel to the vessel centerline, TE the echo time, and r the distance from the voxel to the vessel centerline. The magnetic moment is defined as m=B0Δχπa2and can be calculated from the slope of the Φ vs cos(2φ)/2r2 plot. To calculate a from m, Δχ is needed which can be obtained from large downstream veins where sufficient intravascular SNR is present by fitting the complex-valued image around a vessel with a model image calculated using the signal equations described in Hsieh et al.4 From Δχ, Yv can be calculated based on the linear relationship between them.6Methods
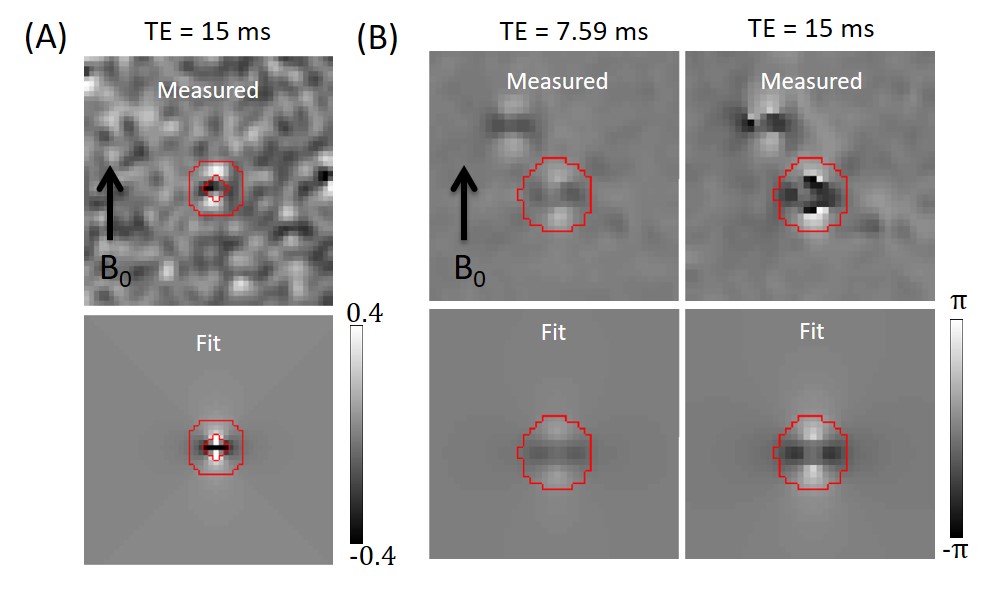
Experiments were performed on a 7T Siemens Magneton MRI scanner. A Nova RF coil with 8 channels for transmitting and 32 channels for receiving was used. Images were acquired with a flow-compensated double echo gradient echo sequence with the following imaging parameters: TR = 21 ms; TE1/TE2 = 7.59/15 ms; resolution = 0.43×0.43×0.4 mm3; matrix = 512×416×208; FA = 10o. Four healthy volunteers (ages 21 – 28) were recruited for the study after obtaining informed consents. About 50 DMVs were manually delineated in each subject using the simple neurite tracer plugin in imageJ.7 For each DMV voxel, a 2D image perpendicular to the vessel was obtained by trilinear interpolation of the 3D complex image to a resolution of 0.2×0.2×0.2 mm3. Afterwards, the Φ vs cos(2φ)/2r2 scatter plot at TE2 of voxels in a concentric ring as shown in Fig. 1A was fitted with a straight line to obtain m. To measure Δχ and Yv, anterior septal veins (ASV) were manually delineated and the complex value 2D images in the plane perpendicular to the vein were generated in the same manner as above. The images of both TEs were fitted simultaneously with model images calculated numerically with Δχ, a, background phase, blood and tissue signal intensities, and vessel center position as free parameters. The effect of blurring due to finite k-space sampling was also taken into account during the calculation. Only voxels within a circle centered at the vessel as shown in Fig 1B were included in the fitting. Our method differed from that of Hsieh el al.4 such that the signals within the circle were not summed which improved fitting stability due to increased number of data points.Results
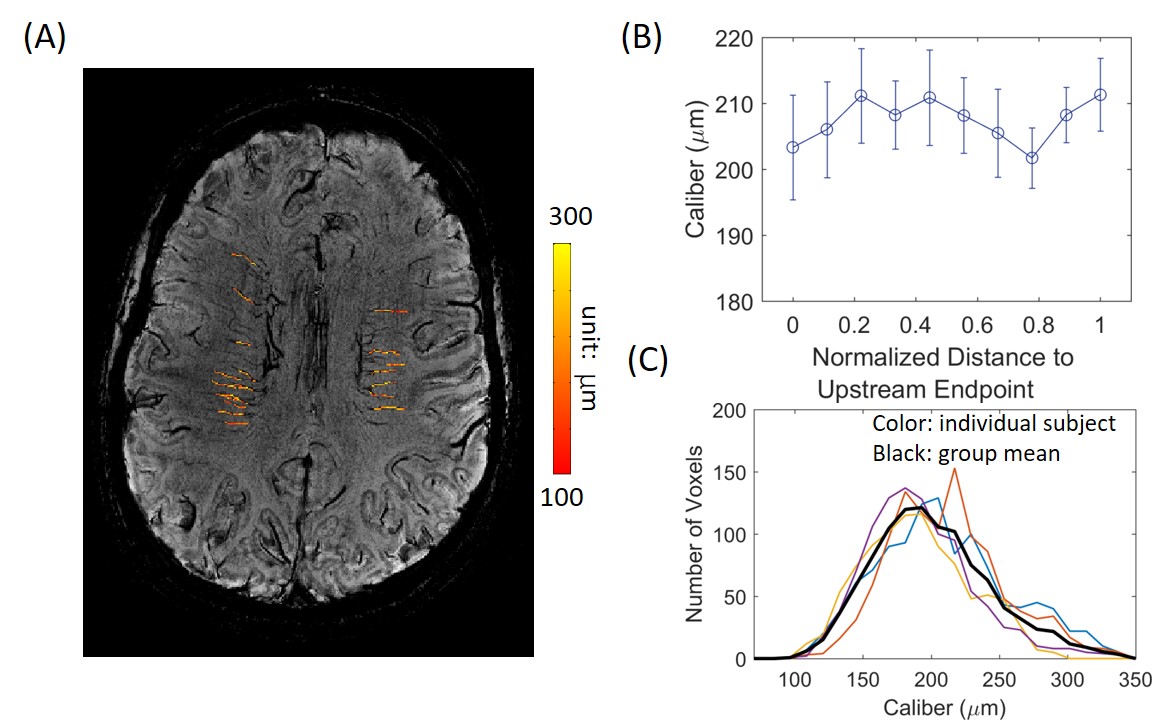
The top and bottom panels of Figure 1 show the phase maps of the resampled 2D images and the corresponding fitting results, respectively at the DMV (1A) and ASV (1B). From the fitted ASV images, mean Δχ of 0.41±0.11 ppm (mean±std; SI unit) and a diameter of 0.73±0.21 mm were obtain across all subjects, consistent with earlier results.8, 9 The fitted Δχ gave a Yv value of 0.55±0.11, assuming an average hemocrit level of 0.4.6 Using the fitted Δχ and m, DMV calibers were obtained and are displayed as an overlay in Fig. 2A from a representative subject. No significant increase of caliber along the draining path was observed as shown in Fig. 2B. The distribution of DMV calibers is shown in Fig. 2C which has a range of 100 to 350 μm with a peak at ~200 μm, in good agreement with earlier reports.5CONCLUSION
A non-invasive approach for measuring the DMV caliber and oxygenation level was presented. The new approach can serve as an invaluable tool for studying the role of DMV lumen narrowing in the pathogenesis of small vessel disease, which has been implicated as one of the main phenotypes of vascular dementia.10Acknowledgements
The work was supported by NIH grant 5R21NS095027-02.References
1. Hartmann DA, Hyacinth HI, Liao FF, Shih AY. Does pathology of small venules contribute to cerebral microinfarcts and dementia? J Neurochem. 2017
2. Brown WR, Moody DM, Challa VR, Thore CR, Anstrom JA. Venous collagenosis and arteriolar tortuosity in leukoaraiosis. J Neurol Sci. 2002;203-204:159-163
3. Keith J, Gao FQ, Noor R, Kiss A, Balasubramaniam G, Au K, et al. Collagenosis of the deep medullary veins: An underrecognized pathologic correlate of white matter hyperintensities and periventricular infarction? Journal of neuropathology and experimental neurology. 2017;76:299-312
4. Hsieh CY, Cheng YN, Xie H, Haacke EM, Neelavalli J. Susceptibility and size quantification of small human veins from an mri method. Magn Reson Imaging. 2015;33:1191-1204
5. Hooshmand I, Rosenbaum AE, Stein RL. Radiographic anatomy of normal cerebral deep medullary veins: Criteria for distinguishing them from their abnormal counterparts. Neuroradiology. 1974;7:75-84
6. Weisskoff RM, Kiihne S. Mri susceptometry: Image-based measurement of absolute susceptibility of mr contrast agents and human blood. Magn Reson Med. 1992;24:375-383
7. Schindelin J, Arganda-Carreras I, Frise E, Kaynig V, Longair M, Pietzsch T, et al. Fiji: An open-source platform for biological-image analysis. Nature methods. 2012;9:676-682
8. Haacke EM, Mittal S, Wu Z, Neelavalli J, Cheng YC. Susceptibility-weighted imaging: Technical aspects and clinical applications, part 1. AJNR Am J Neuroradiol. 2009;30:19-30
9. Ono M, Rhoton AL, Jr., Peace D, Rodriguez RJ. Microsurgical anatomy of the deep venous system of the brain. Neurosurgery. 1984;15:621-657
10. Brown WR, Moody DM, Thore CR, Anstrom JA, Challa VR. Microvascular changes in the white mater in dementia. J Neurol Sci. 2009;283:28-31
Figures