0265
Multi-atlas tool for automated magnetic susceptibility quantification in brain nuclei1Radiology, Johns Hopkins University, Baltimore, MD, United States, 2Kennedy Krieger Institute, Johns Hopkins University, Baltimore, MD, United States, 3Biomedical Engineering, Johns Hopkins University, Baltimore, MD, United States, 4Siemens Healthineers, Baltimore, MD, United States
Synopsis
Quantitative magnetic susceptibility offers a non-invasive measure of important brain tissue molecules, such as iron complexes and myelin, potentially providing significant information about normal and pathological conditions during aging. We developed an automated process to quantify tissue susceptibility in a biologically meaningful set of structures, thereby generating universal and sharable quantitative susceptibility measures. Our susceptibility-based multi-atlas outperformed the single atlas and the T1-weighted multi-atlases. Our tool and normalization algorithm offered consistent measures of magnetic susceptibility over different image protocols and platforms. Automatic and reliable quantitative susceptibility mapping measures will facilitate individual analyses and studies on aging and neurodegeneration.
Introduction
Physiologically significant molecules including iron complexes and myelin are dominant tissue sources that influence the bulk magnetic susceptibility in brain tissue (1,2,3). Since non-invasive measurement of these molecules give important insight into the normal and pathological processes during aging (4,5,6), quantitative magnetic susceptibilities may become a measure to monitor neurodegenerative diseases. However, automated resources to reliably quantify tissue susceptibility in a biologically meaningful set of structures, with the goal of generating universal and sharable susceptibility measures (7,8), are still not available. This is due to complicated reconstruction and calibration for quantitative susceptibility mapping (QSM), plus challenges on automated segmentation, normalization and quantification. Here, we report on the development of a magnetic susceptibility human brain multi-atlas quantification tool with robust performance among different imaging protocols and anatomical variation.Methods
Our multi-atlas pipeline was developed using a collection of 10 individuals, age: 26-73 years old, with variable anatomic patterns, expressed by different degrees and locations of brain atrophy. The data was acquired using a multi-echo GRE sequence with 1.0 mm isotropic resolution (TE1/ΔTE/TR=6/6/40 ms, 6 unipolar echoes, FOV=224x224x140 mm3, flip angle 18°, bandwidth 207 Hz/px, SENSE factor of 2x1x2, scan time 7 min 19 sec) on a 3T Philips scanner. The channels used for mapping were the QSM and the average of the T2* weighted GRE magnitude images. For the multi-atlas pipeline we used a combination of linear and large deformation diffeomorphic mapping (LDDMM) similar to our single-atlas7. The target brain, however, is mapped not to a single template but multiple, and the final labels are defined by regionally weighting the results of each atlas9. Using leave-one-out, we calculated the indices of agreement (Dice) between the manual delineations and the ones obtained with the multi-atlas. We also compared the mutli-atlas QSM/GRE mapping results with those obtained by single-atlas QSM/GRE and T1-based multi-atlas.
In order to test the reproducibility of QSM measures over scan protocols and platforms and the robustness of the multi-atlas pipeline, we scanned 6 subjects using two different protocols and two different platforms. The first protocol (Philips Protocol A) was similar to what is described above; the second scan (Philips Protocol B) was acquired using a single echo SWI protocol with 0.9x0.9x1.5mm3 resolution (TE/TR=20/27ms, FOV=220x220x168mm3, flip angle 15°, bandwidth 120Hz/px, SENSE factor 2) on the same scanner; the third scan was on a 3T Siemens with parameters matched to protocol B (Siemens Protocol B).
Results
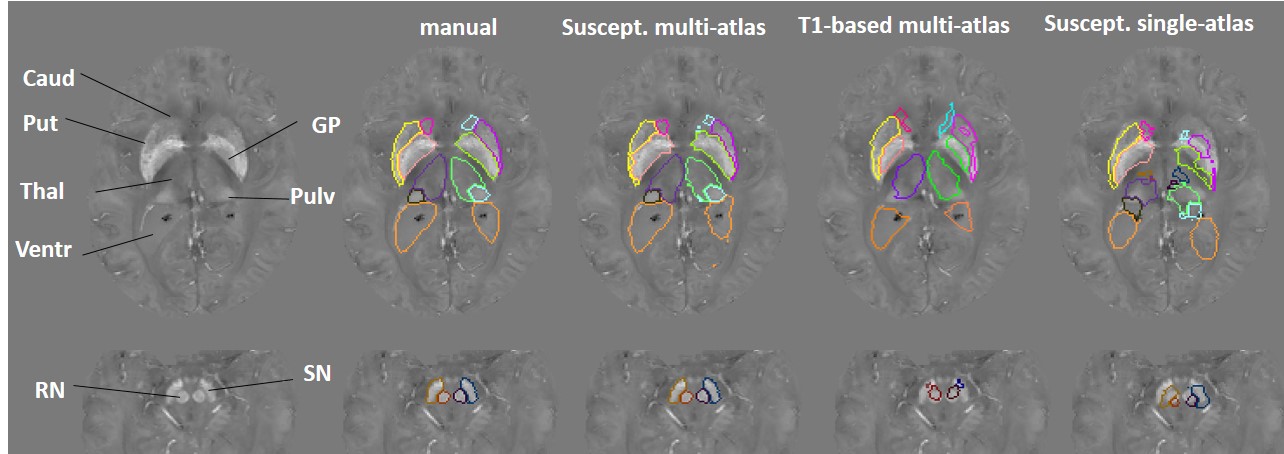
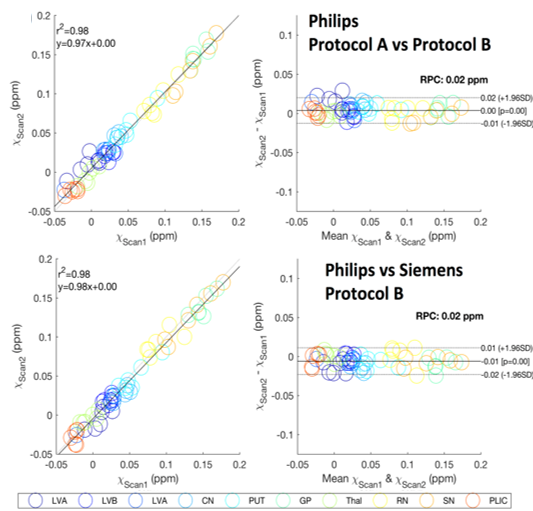
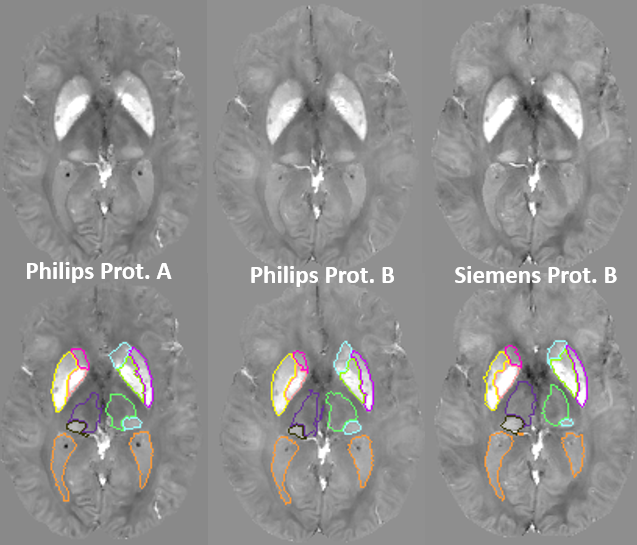
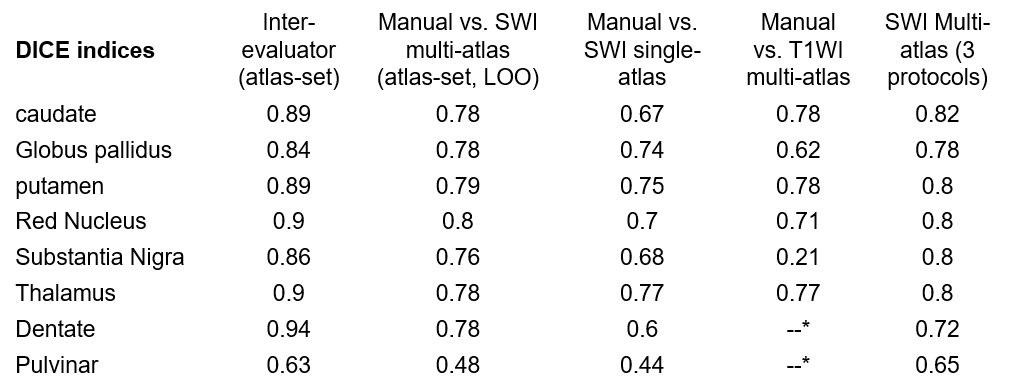
Figure 1 illustrates our parcellation map overlaid on one of the individuals with the largest degree of atrophy and asymmetry, in which all kinds of mapping show worse results, compared to the manual delineation. The QSM/GRE multi-atlas outperformed the single atlas and the T1-based multi-atlas in all cases (Table 1) by showing better agreement with the gold-standard manual delineations. Susceptibility measures in selected ROIs showed good agreement between-protocols and between-platforms with excellent correlation (R2=0.98), mean difference smaller than ±0.006 ppm and reproducibility coefficient (RPC, 1.96*standard deviation indicating 95% limit of agreement) of less than 0.018 ppm (Fig. 2). The segmentation resultant from the QSM/GRE multi-atlas pipeline showed high reproducibility among protocols and platforms (Figure 3 and Table 1).Discussion
Previously, we were successful on developing a single-susceptibility atlas for automated segmentation. The accuracy of single atlases, however, declines when the anatomy of the target distances from the template. In this situation, multi-atlas libraries including brains with different anatomical patterns become critical9,10. The multi-atlas efficacy also depends on the contrast for mapping the structure in question. For instance, the T1-based multi-atlas has poor performance for segmenting of iron-rich gray matter nuclei on QSM due to the low T1-weighted contrast in these structures (7,8). It is therefore reasonable that the susceptibility multi-atlas showed higher performance compared to single atlas and T1-based multi-atlas. While the Dice index of the automated segmentation is in general inferior to the inter-evaluator agreement, they are both relatively low in areas of poor contrast (i.e., the pulvinar), an issue intrinsic to the method. Prospectively, by calculating surface-based agreements, we will identify critical areas for more precise mapping. Possible solutions are the addition of extra-channels of contrast, which we successfully achieved in other pipelines (10), other algorithms for intensity scaling, and the expansion of the atlas libraries. The susceptibility multi-atlas and the normalization algorithm were stable enough among platforms and protocols to allow the combination of data from different sources into big databases, providing universal and generalizable metrics.Conclusion
The susceptibility multi-atlas tool will provide automatic and reliable quantification of QSM, which is expected to greatly facilitate individual analyses and studies on aging and neurodegeneration.Acknowledgements
NIH/NIBIB grant P41 EB015909References
[1] Wang, Y. & Liu, T. Quantitative susceptibility mapping (QSM): Decoding MRI data for a tissue magnetic biomarker. Magn Reson Med 73, 82-101 (2015).
[2] Liu, C., Li, W., Tong, K.A., Yeom, K.W. & Kuzminski, S. Susceptibility-weighted imaging and quantitative susceptibility mapping in the brain. J Magn Reson Imaging 42, 23-41 (2015).
[3] Duyn, J.H. & Schenck, J. Contributions to magnetic susceptibility of brain tissue. NMR Biomed (2016).
[4] Acosta-Cabronero, J., et al. In vivo quantitative susceptibility mapping (QSM) in Alzheimer's disease. PLoS One 8, e81093 (2013)
[5] Lotfipour, A.K., et al. High resolution magnetic susceptibility mapping of the substantia nigra in Parkinson's disease. J Magn Reson Imaging 35, 48-55 (2012)
[6] Dumas, E.M., et al. Elevated brain iron is independent from atrophy in Huntington's Disease. NeuroImage 61, 558-564 (2012)
[7] Lim, I.A., et al. Human brain atlas for automated region of interest selection in quantitative susceptibility mapping: application to determine iron content in deep gray matter structures. Neuroimage 82, 449-469 (2013)
[8] Cobzas, D., et al. Subcortical gray matter segmentation and voxel-based analysis using transverse relaxation and quantitative susceptibility mapping with application to multiple sclerosis. J Magn Reson Imaging (2015)
[9 Tang, X., et al. Bayesian Parameter Estimation and Segmentation in the Multi-Atlas Random Orbit Model. PLoS One 8, e65591 (2013)
[10] Tang, X., et al. Multi-contrast multi-atlas parcellation of diffusion tensor imaging of the human brain. PLoS One 9, e96985 (2014)
Figures