0264
Myelin water atlas: a template for myelin distribution in the brain1Physics, University of British Columbia, Vancouver, BC, Canada, 2International Collaboration on Repair Discoveries, Vancouver, BC, Canada, 3Rehabilitation Sciences, University of British Columbia, Vancouver, BC, Canada, 4Pediatrics, University of British Columbia, Vancouver, BC, Canada, 5UBC MRI Research Centre, University of British Columbia, Vancouver, ON, Canada, 6IoPPN, King's College London, London, United Kingdom, 7Radiology, University of British Columbia, Vancouver, BC, Canada, 8Medicine, University of British Columbia, Vancouver, BC, Canada, 9MR Clinical Science, Philips Healthcare Canada, Markham, ON, Canada, 10UBC MRI Research Centre, University of British Columbia, Vancouver, BC, Canada, 11ImageTech Lab, Simon Fraser University, Surrey, BC, Canada, 12University of British Columbia, Vancouver, BC, Canada, 13Physical Therapy, University of British Columbia, Vancouver, BC, Canada, 14Kinesiology, University of British Columbia, Vancouver, BC, Canada
Synopsis
In-vivo information about myelin content in the brain is desirable for studying brain diseases and injuries. Normative information is key for determining what is abnormal when assessing neurological conditions that affect myelin. We used myelin water imaging to create a template specific to myelin, the myelin water atlas, for healthy brains. The resulting atlas shows strong agreement with well-known anatomical features that have demonstrated that different brain regions have distinct amounts of myelin. Our work shows one of the potential applications of using the myelin water atlas as a reference to visualize demyelination in the brain of individual subjects.
Introduction
Myelin is the protective sheath around axons that enables faster signal transmission within the central nervous system. Damage to myelin drives the severity and progression of many neurodegenerative diseases of the brain and spinal cord1. Several imaging techniques have been developed to monitor changes in myelination2, but clinical use on an individual patient level is challenging for several reasons. Beyond sequence standardization and multi-vendor implementation hurdles, interpreting individual patient imaging outcomes is difficult due to the fact that myelin content varies with age and sex.1 In addition, while group comparisons between disease and control cohorts often detect differences in myelin3,4, it can be challenging to detect abnormalities or changes over time in an individual patient due to measurement noise of quantitative myelin imaging methods. Finally, collecting control data for every study is costly, diverting funds from acquiring more patient data, and is not feasible in a clinical setting to always also scan a sex/age-matched healthy control for every individual patient. Creating a normative myelin imaging atlas, to which patients can be compared to, can address the above challenges, and has been successfully implemented in the spinal cord.5 To our knowledge, no such myelin atlas exists for the brain. Our objective was to make a template specific to normal myelin content in the brain, a ‘myelin water atlas’, which will serve as a myelin reference of healthy adults.
To create a myelin water atlas we used the histologically-validated MRI technique myelin water imaging (MWI)6, which measures the signal from water trapped in myelin bilayers. The fraction of the myelin water signal relative to the total signal is defined as the myelin water fraction (MWF), which is a quantitative metric for myelin content. By overlaying MWF maps from many healthy subjects, a myelin water atlas can be created, depicting the population mean and variability of myelin content in key regions of the brain.
Method
MRI: 46 healthy subjects (21M/25F, mean age 25yrs, range: 17-38yrs) were scanned at 3T using an 8-channel phase-array head coil (Achieva, Philips, Best, The Netherlands). Data included myelin water imaging (3D gradient and spin echo (GRASE), 32-echo, TE/TR=10/1000ms, slices=40, reconstruction resolution=1x1x2.5mm3) and a 3DT1 whole brain turbo field echo (flip angle=6°, TE/TR=3.7/7.4ms, slices=160, resolution=1x1x1mm3).
Myelin Water Fraction: GRASE data voxel-wise T2 decay curve analysis was performed using in-house MATLAB software to generate MWF maps.7 MWF was defined as the fractional signal with T2 < 40ms.
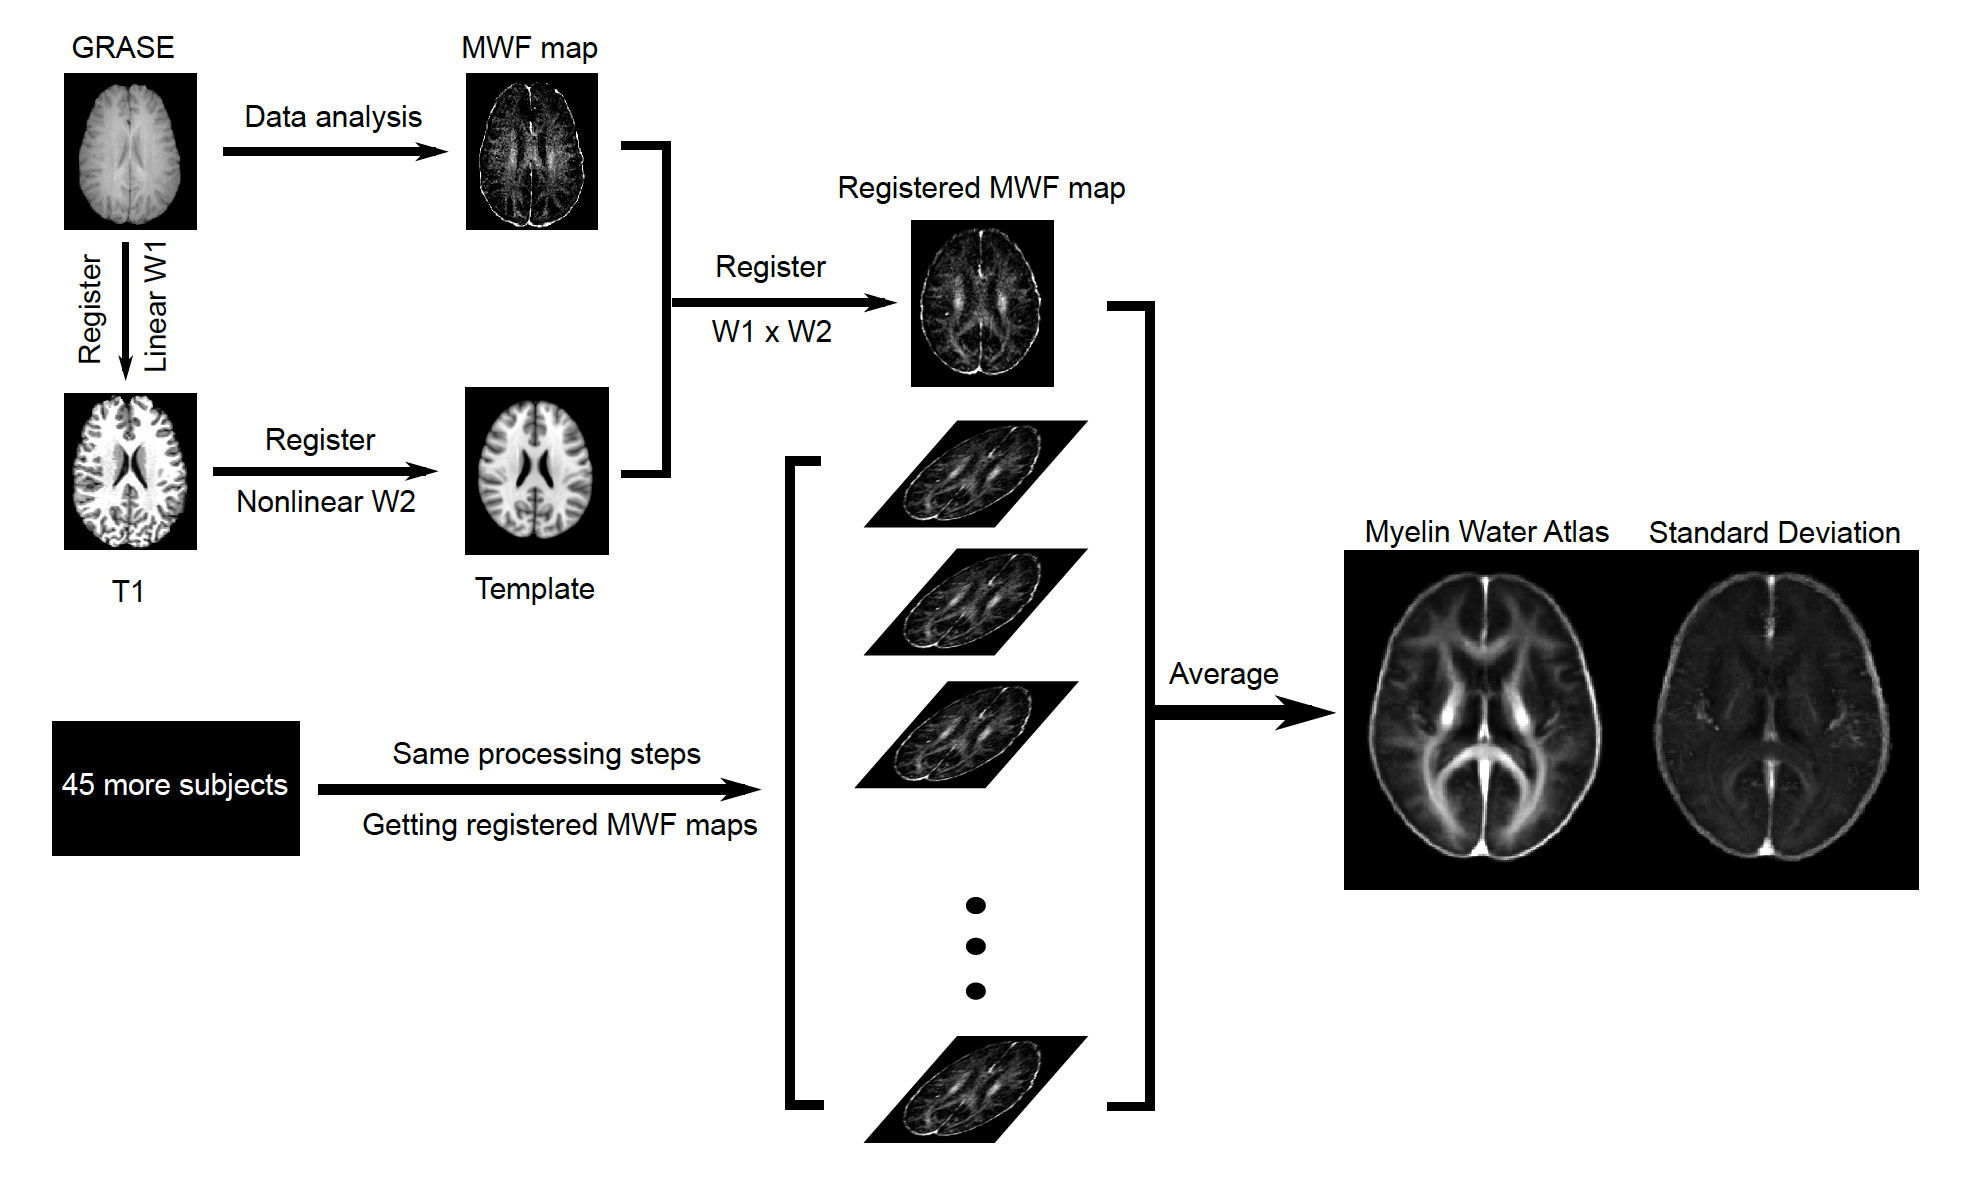
Myelin water atlas: Individual MWF maps were first registered to 3DT1 images (linear, 6 degrees of freedom (DOF)) and subsequently registered to the standard 1mm MNI152 space (nonlinear, >12 DOF) using FSL.8 The myelin water atlas was created by averaging the registered MWF maps in the standard space from all healthy subjects and voxel-wise standard deviation was obtained. Figure 1 depicts the workflow.
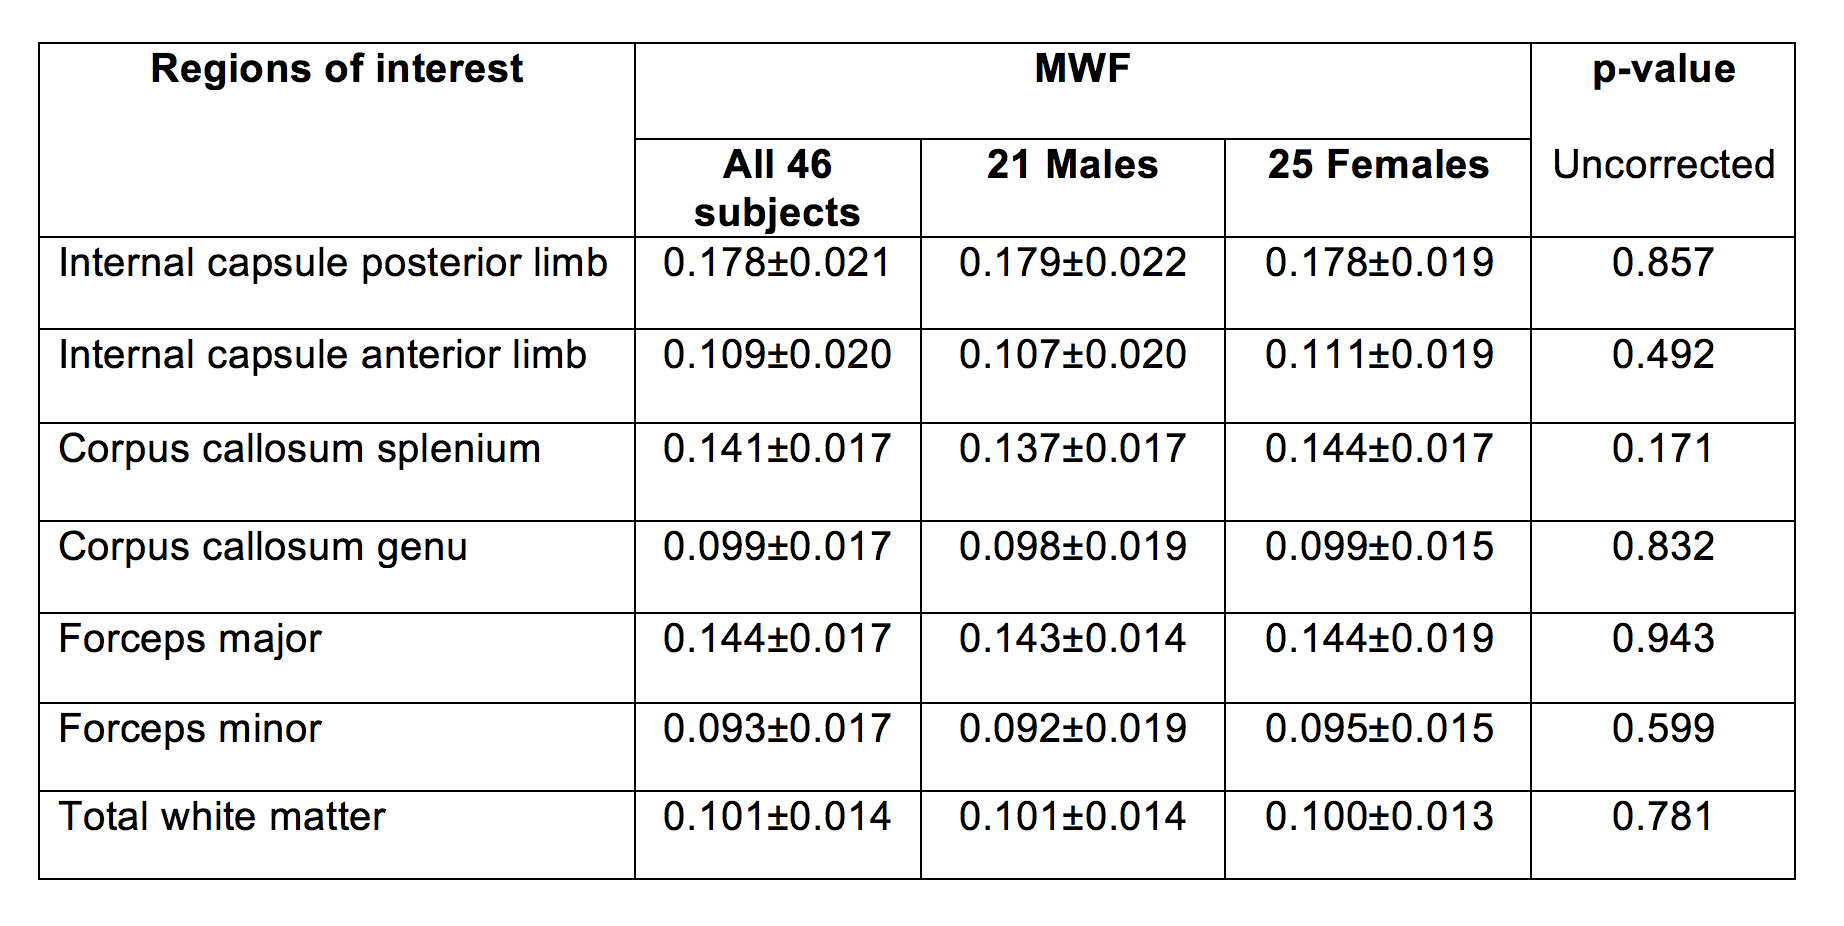
Data analysis: Using the white matter atlas in FSL, average MWF was extracted from 7 regions of interest (ROIs): internal capsule anterior and posterior limbs, corpus callosum splenium and genu, forceps major, forceps minor, total white matter. An unpaired t-test (uncorrected) compared male and female MWF.
Results
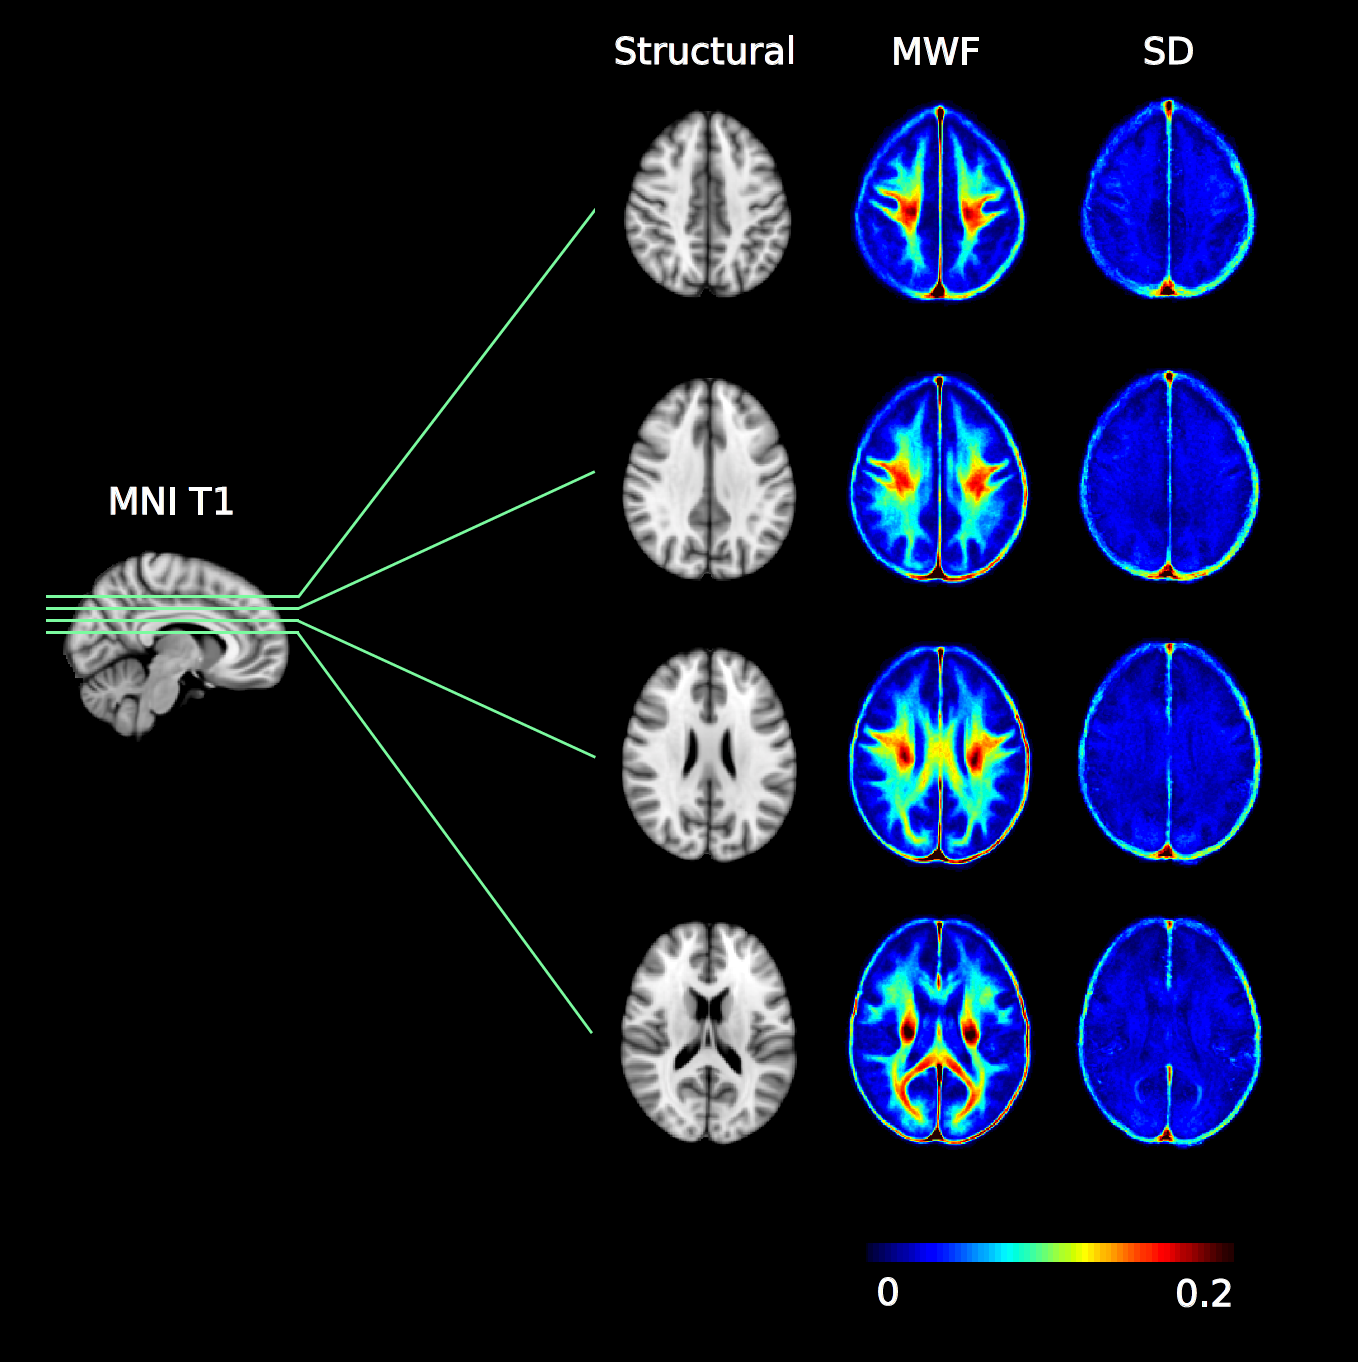
Figure 2 shows four axial slices from the atlas. Table 1 highlights regional variation of MWF with, for example, the internal capsule posterior limb being 63% higher than the anterior limb, the splenium being 42% higher than the genu, and a 54% difference between the forceps major and forceps minor. No significant differences were found between male and female white matter MWF.Discussion
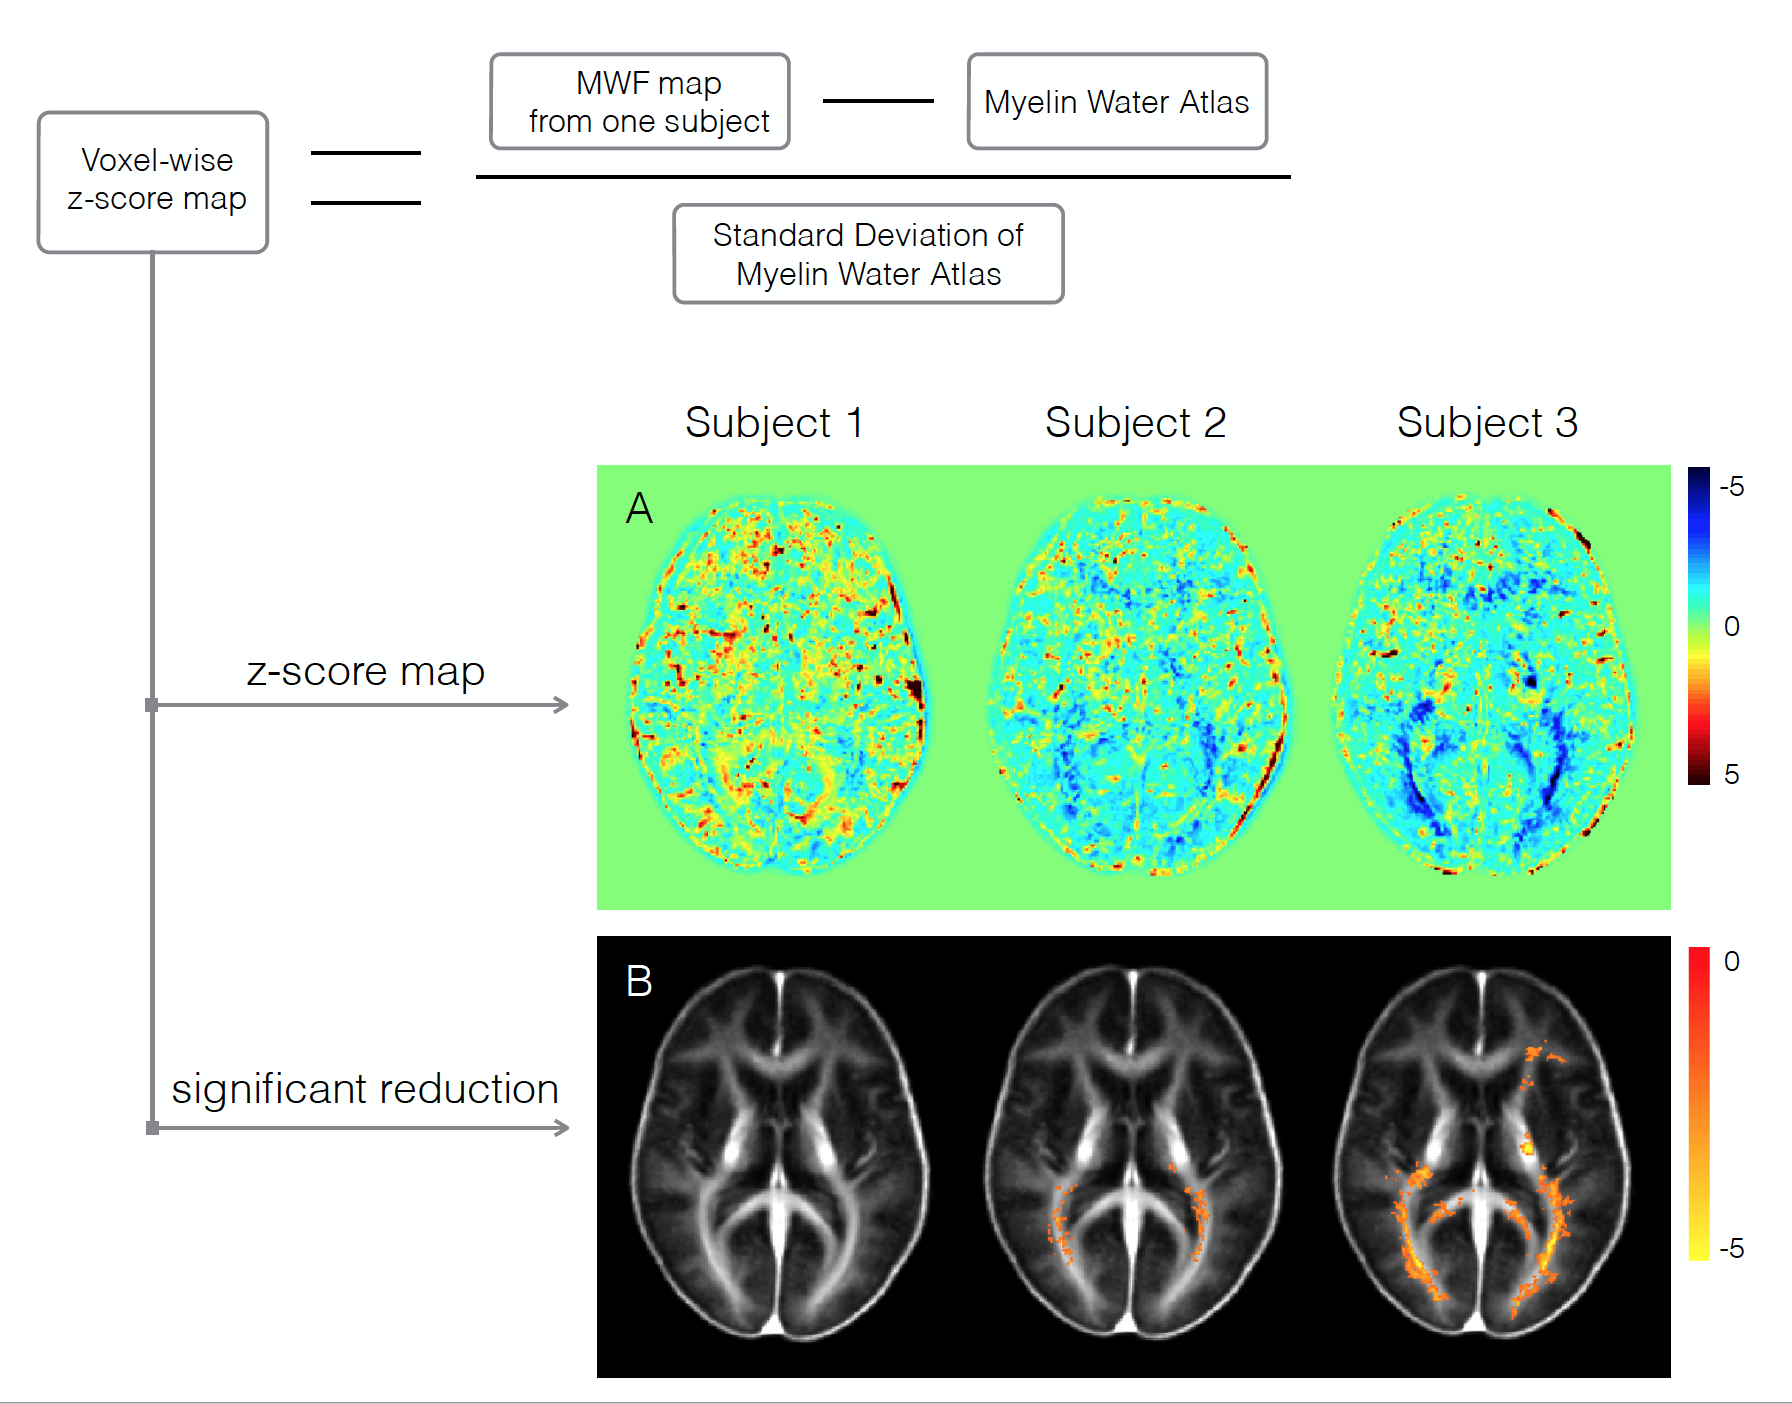
Our regional myelin water fraction results demonstrate strong agreement with well-known anatomical features of the brain9-11, indicating that different brain regions may have distinct myelin abundance, an observation supported by biochemical and histological analysis from human tissue and animal models.12-15 The voxel-wise standard deviation of the atlas provides an estimation of myelin variation among people. Figure 3 illustrates an example of using the atlas to carry out voxel-wise z-score maps of three female subjects with relapsing remitting multiple sclerosis (expanded disability status score (EDSS) = 0, 2.0, 2.0 respectively). Subjects did not have obvious lesions, but Subject 3 showed diffusely abnormal white matter (DAWM) on conventional MRI. Visual inspection demonstrates that demyelination is more severe when EDSS is higher and DAWM is present.Conclusion
Our myelin water atlas can be used as a reference for in-vivo studies of myelin, and to visually demonstrate areas of demyelination in a single individual. Future studies to expand the myelin water atlas to include all age groups, as well as other factors (e.g. education) which may have effects on myelin content, are warranted.Acknowledgements
We thank the study participants and the excellent MRI technologists at the UBC MRI Research Centre. Funding support was provided by the Multiple Sclerosis Society of Canada, Natural Sciences and Engineering Research Council Discovery Grant.References
1. Filley C. The behavioural neurology of white matter. New York: Oxford University Press; 2001.
2. Laule C, Vavasour IM, Kolind SH, et al. Magnetic resonance imaging of myelin. Neurotherapeutics. 2007;4(3):460-484.
3. Laule C, Vavasour IM, Moore GR, et al. Water content and myelin water fraction in multiple sclerosis. A T2 relaxation study. J Neurol. 2004;251(3):284-293.
4. Sirrs SM, Laule C, Madler B, et al. Normal-appearing white matter in patients with phenylketonuria: Water content, myelin water fraction, and metabolite concentrations. Radiology. 2007;242(1):236-243.
5. Liu H, Ljungberg E, MacMillan E, et al. Myelin water atlas for cervical spinal cord: A template for spinal cord pathway myelin microstructure. . 2017.
6. Laule C, Leung E, Lis DK, et al. Myelin water imaging in multiple sclerosis: Quantitative correlations with histopathology. Mult Scler. 2006;12(6):747-753.
7. Prasloski T, Mädler B, Xiang Q, MacKay A, Jones C. Applications of stimulated echo correction to multicomponent T2 analysis. Magnetic Resonance in Medicine. 2012;67(6):1803-1814.
8. Smith SM, Jenkinson M, Woolrich MW, et al. Advances in functional and structural MR image analysis and implementation as FSL. Neuroimage. 2004;23 Suppl 1:S208-19.
9. Aboitiz F, Scheibel AB, Fisher RS, Zaidel E. Fiber composition of the human corpus callosum. Brain Res. 1992;598(1-2):143-153.
10. Riise J, Pakkenberg B. Stereological estimation of the total number of myelinated callosal fibers in human subjects. J Anat. 2011;218(3):277-284.
11. Stikov N, Campbell JS, Stroh T, et al. In vivo histology of the myelin g-ratio with magnetic resonance imaging. Neuroimage. 2015;118:397-405.
12. Trotter JL, Wegescheide CL, Garvey WF. Regional studies of myelin proteins in human brain and spinal cord. Neurochem Res. 1984;9(1):133-146.
13. Berlet HH, Volk B. Studies of human myelin proteins during old age. Mech Ageing Dev. 1980;14(1-2):211-222.
14. Kinney HC, Karthigasan J, Borenshteyn NI, Flax JD, Kirschner DA. Myelination in the developing human brain: Biochemical correlates. Neurochem Res. 1994;19(8):983-996.
15. Hartman BK, Agrawal HC, Agrawal D, Kalmbach S. Development and maturation of central nervous system myelin: Comparison of immunohistochemical localization of proteolipid protein and basic protein in myelin and oligodendrocytes. Proc Natl Acad Sci U S A. 1982;79(13):4217-4220.
16. Kolind S, Matthews L, Johansen-Berg H, et al. Myelin water imaging reflects clinical variability in multiple sclerosis. Neuroimage. 2012;60(1):263-270.
Figures