0263
Rapid simultaneous acquisition of QSM and MTV1Radiology, Athinoula A. Martinos Center for Biomedical Imaging, Charlestown, MA, United States, 2Institute of Biomedical Engineering, Ecole Polytechnique de Montreal, Montreal, QC, Canada, 3Athinoula A. Martinos Center for Biomedical Imaging, Charlestown, MA, United States
Synopsis
Quantitative susceptibility mapping (QSM) and macromolecular tissue volume (MTV) represent quantitative methods that improve characterization of neurodegenerative diseases. MTV involves acquisition of 3D-Gradient Echo (GRE) at multiple flip angles with long TR and short TE. High-quality QSM requires 3D-GRE at multiple head orientations with long TE. We exploit (i) unused time due to long TR in MTV to collect additional late echoes that allow QSM processing, (ii) acquire each of the multiple flip angles at a different head orientation. These permit simultaneous acquisition of QSM and MTV, whereby two maps are obtained at the scan time of a single contrast.
Introduction
Single orientation quantitative susceptibility mapping (QSM) allows quantification of tissue magnetic susceptibility. Unfortunately, its biological interpretation is limited as it receives contributions from iron as well as myelin , and its image quality is severely hampered by streaking artifacts and over-smoothing due to the ill-conditioned reconstruction (1). To facilitate the solution of the difficult inverse problem and substantially improve image quality, QSM data can be acquired in three or more different head positions (COSMOS)(2). The separate acquisition of a more myelin-specific metric such as macromolecular tissue volume fraction (MTVF) can help to disentangle the contributions of myelin to susceptibility (3). While both sequences are based on 3D-GRE acquisitions, they are usually acquired separately, which can lead to misregistration and lengthy scan times. Here, we exploit inherent redundancies in these sequences, and propose a strategy for simultaneous acquisition of co-registered, whole-brain QSM and MTVF images at the scan time cost of only one of these contrasts. Further, we employ these simultaneously acquired quantitative maps and propose a model to differentiate contributions from iron and myelin to tissue susceptibility, and generate additional iron and myelin maps.
Methods
MTVF relies on multiple 3D-GRE acquisitions made at different flip angles, with long TR and short TE. On the other hand, COSMOS QSM requires 3D-GRE data acquired at multiple-head orientations with long TE to improve contrast. We exploit the unused sequence time in MTVF acquisition due to the long TR and collect additional late echoes that lend themselves to QSM processing. Further, we collect each of the flip angles at a different head orientation, thereby enabling simultaneous MTVF and COSMOS acquisition.
Data Acquisition: A healthy adult volunteer was scanned on a 3T system (Siemens Skyra) with a 64-channel head coil. 1mm isotropic multi-echo GRE (4 echoes, TE1 = 12ms, echo spacing = 6 ms, TR= 30 ms, FOV = 192 x 256 x 160, with R=2x2 acceleration) was acquired with pre-scan normalization at three different head orientations, with a different flip angle at each orientation (4°, 10°, 20°).
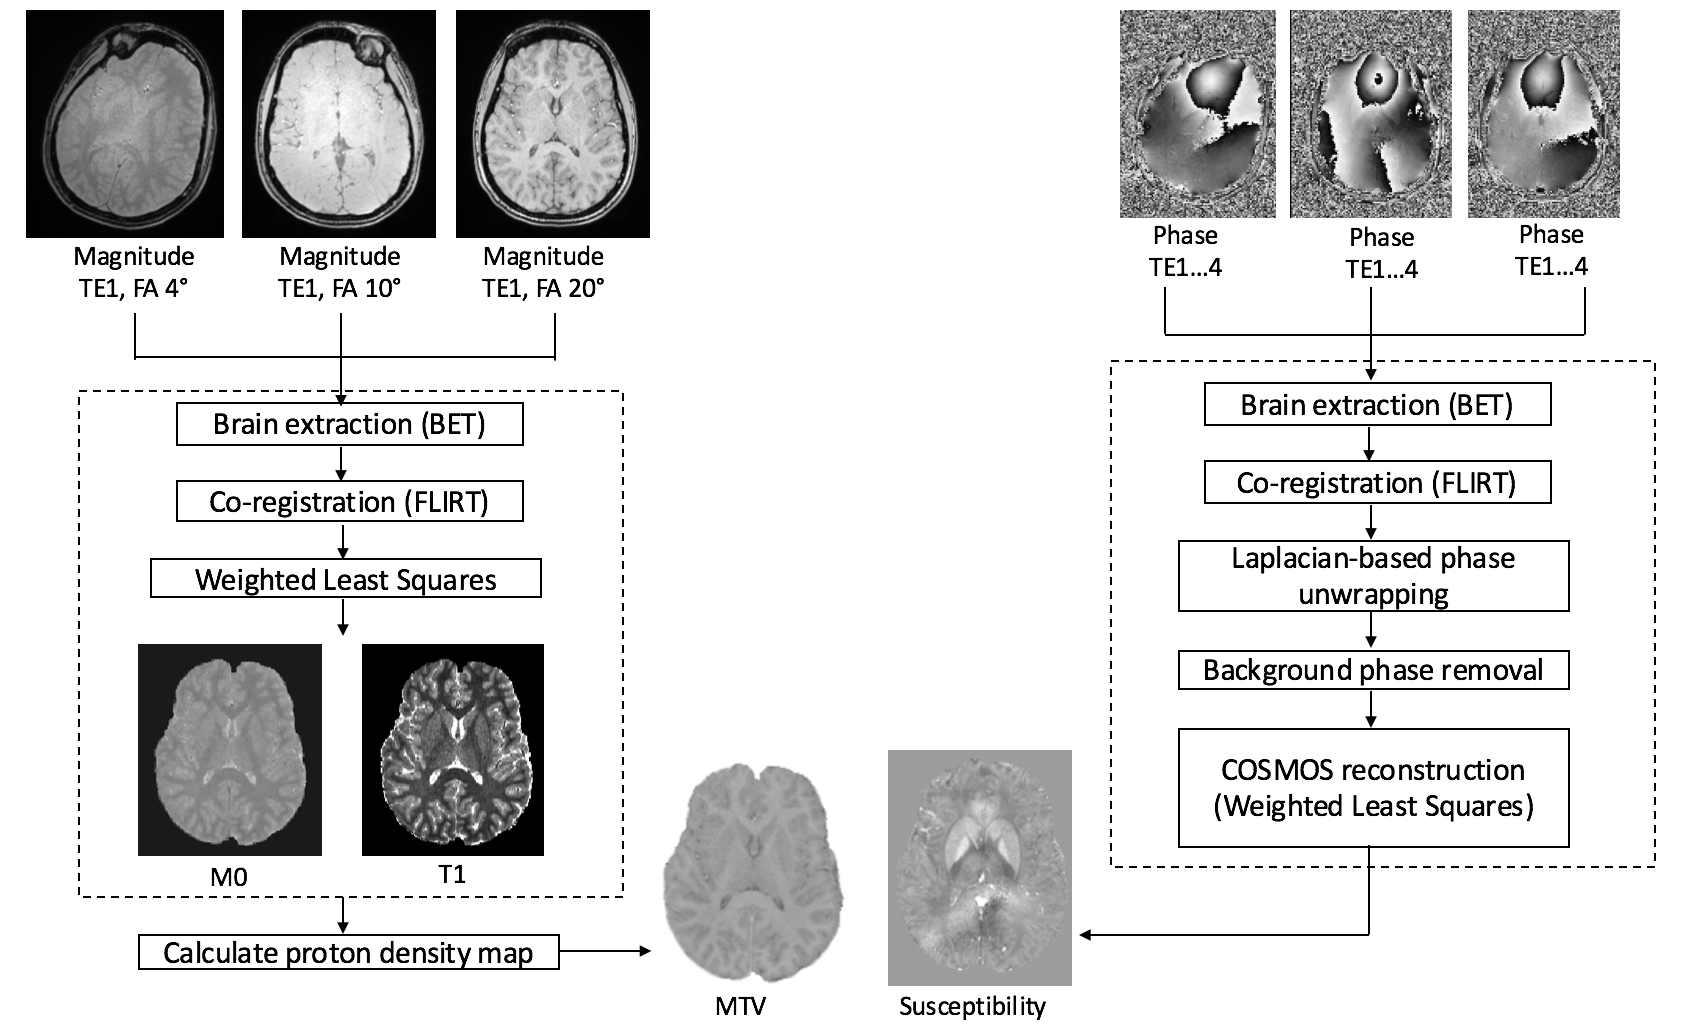
Data processing: The raw phase data were processed using Laplacian-based unwrapping and V-SHARP for background phase removal in STI-Suite (4). COSMOS reconstruction of the susceptibility maps was performed with least squares formulation (5). To generate the MTVF maps, the magnitude images from the first echo of each of the three flip angles were skull-stripped and co-registered. M0 and T1 maps were generated using weighted least squares fitting (3). Proton density maps were then calculated, with MTVF determined as MTVF=1-WVF (water volume fraction). An overview of the data processing steps is shown in Figure 1.
To determine the contributions of susceptibility from iron, we modeled tissue susceptibility as χ = a*CFe + b*MTVF + c, where the coefficients a, b, c are assumed to be constant within different brain tissues and CFe refers to the concentration of iron in fresh tissue (mg/100 g) in selected brain regions based on literature values (6)(7). Susceptibility maps for iron and myelin were then calculated as χFe= χ - b*MTVF – c and χmyelin= χ - a*CFe – c, respectively.
Results
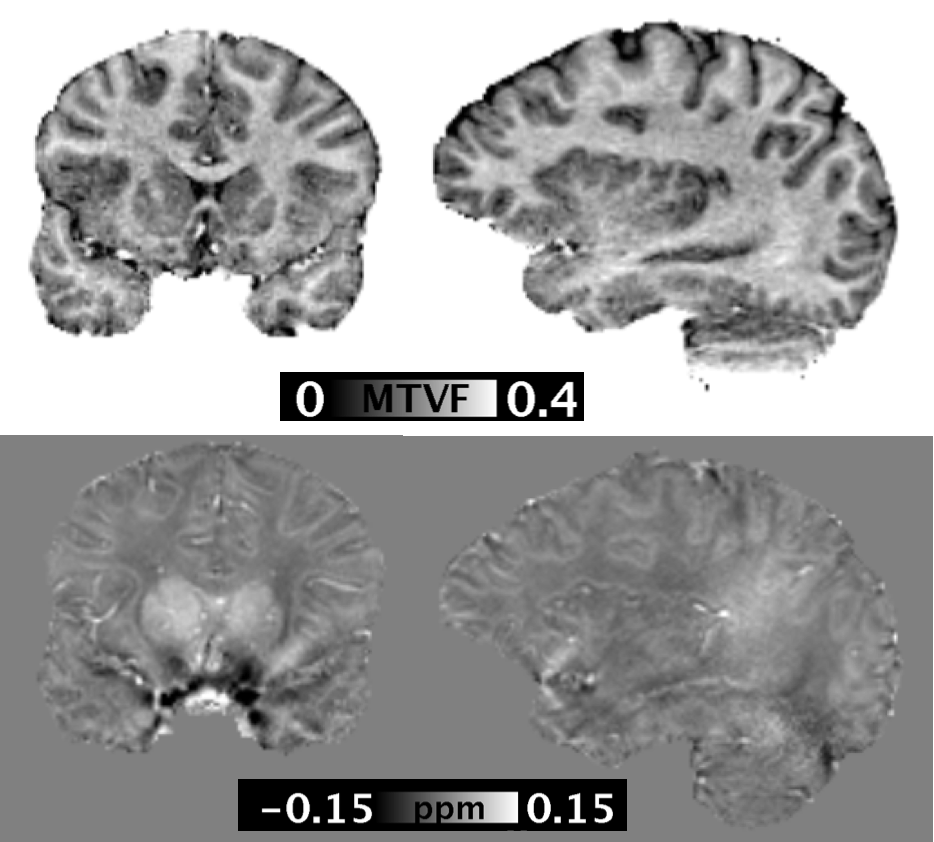
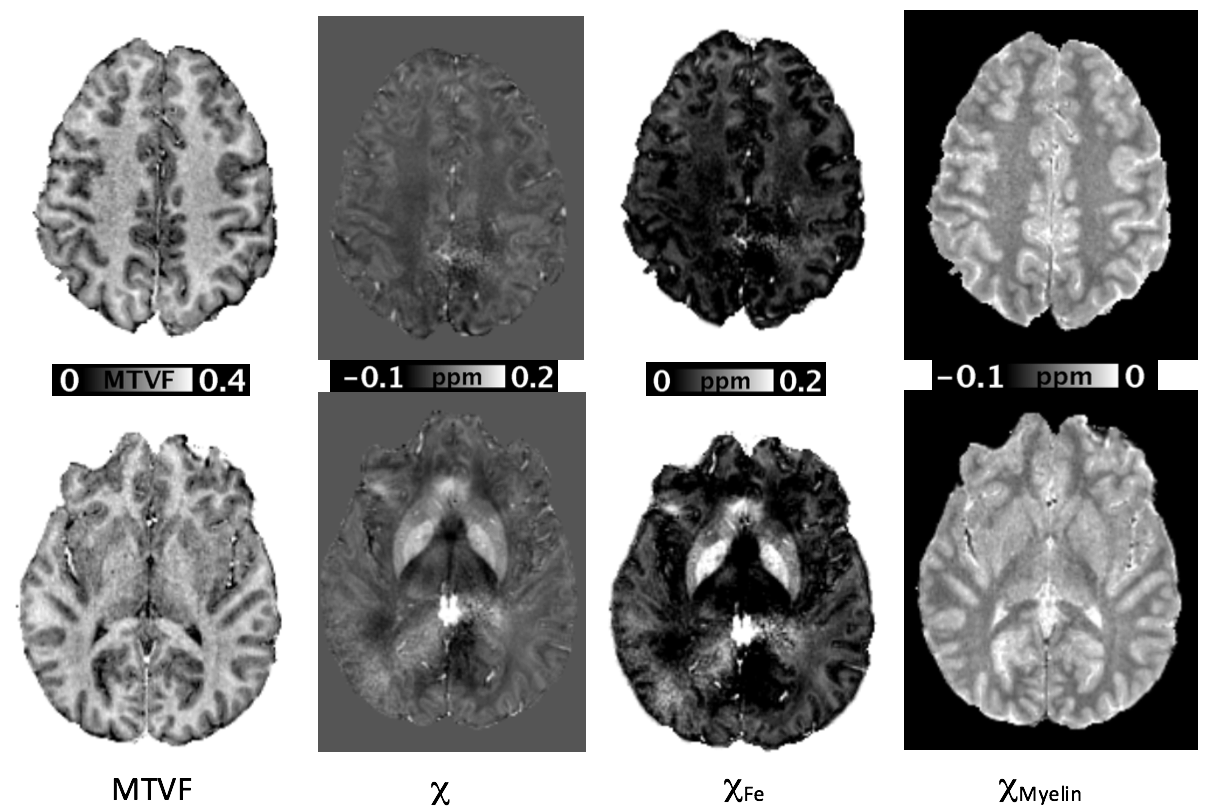
The calculated susceptibility and MTVF maps showed tissue contrast consistent with previous studies (3) (8). The reconstructed MTV and QSM images are shown in Figure 2. The iron and myelin susceptibility maps demonstrated the co-existence of these substrates within different brain tissues (Figure 3). Iron-specific susceptibility was greatest in the subcortical grey matter, particularly the globus pallidus. Myelin-specific susceptibility showed diamagnetic contributions concentrated within the white matter.Discussion/Conclusion
Our proposed method permits practical simultaneous acquisition of co-registered QSM and MTV data, allowing for quantitative evaluation of neurological diseases where myelin and iron content are perturbed. As we demonstrated, this approach can facilitate disentangling the contributions of myelin and iron to magnetic susceptibility. Future directions include employing joint reconstruction across flips angles and/or TEs to further accelerate the acquisition, generating R2* maps from the same data which could be incorporated into the proposed iron/myelin model, and applying this method to disease conditions such as multiple sclerosis.Acknowledgements
No acknowledgement found.References
1. Stüber C, Pitt D, Wang Y. Iron in Multiple Sclerosis and Its Noninvasive Imaging with Quantitative Susceptibility Mapping. Int J Mol Sci 2016;17:100.
2. Liu T, Spincemaille P, de Rochefort L, et al. Calculation of susceptibility through multiple orientation sampling (COSMOS): a method for conditioning the inverse problem from measured magnetic field map to susceptibility source image in MRI. Magn Reson Med 2009;61:196–204.
3. Mezer A, Yeatman JD, Stikov N, et al. Quantifying the local tissue volume and composition in individual brains with magnetic resonance imaging. Nat Med 2013;19:1667–72.
4. Li W, Avram AV, Wu B, et al. Integrated Laplacian-based phase unwrapping and background phase removal for quantitative susceptibility mapping. NMR Biomed 2014;27:219–27.
5. Bilgic B, Xie L, Dibb R, et al. Rapid multi-orientation quantitative susceptibility mapping. NeuroImage 2016;125:1131–41.
6. Hallgren B, Sourander P. The effect of age on the non-haemin iron in the human brain. 1958;3:41–51.
7. Schweser F, Sommer K, Deistung A, et al. Quantitative susceptibility mapping for investigating subtle susceptibility variations in the human brain. NeuroImage 2012;62:2083–100.
8. Wang Y, Liu T. Quantitative susceptibility mapping (QSM): Decoding MRI data for a tissue magnetic biomarker. Magn Reson Med 2015;73:82–101.
Figures