0262
Simultaneous B1 and T1 Mapping Using Spiral Variable-Flip-Angle Acquisitions for Whole-Brain Coverage in Less Than One Minute1Division of Radiological Physics, Department of Radiology, University of Basel Hospital, Basel, Switzerland, 2Department of Biomedical Engineering, University of Basel, Basel, Switzerland, 3High Field Magnetic Resonance, Max Planck Institute for Biological Cybernetics, Tübingen, Germany, 4Siemens Healthcare GmbH, Application Development, Erlangen, Germany, 5Department of Biomedical Engineering, University of Virginia, Charlottesville, VA, United States
Synopsis
Rapid variable-flip-angle T1 mapping techniques are frequently applied in clinical settings, but their accuracy is often impaired by incomplete spoiling or flip angle miscalibrations. To eliminate these two error sources simultaneously, a combined B1 and T1 mapping method is proposed based on spiral 2D multislice spoiled gradient echo imaging with high spoiling efficiency. The transition to steady state is minimized by an optimized single preparation pulse. A single-shot spiral readout during the preparation module enables ultrafast B1 mapping and as a result reproducible bias-free T1 mapping with whole-brain coverage at clinically relevant resolution in less than one minute.
Introduction
Fast and accurate T1
quantification based on variable-flip-angle (VFA) spoiled-gradient-echo (SPGR)
acquisitions is challenging due to the sensitivity of the acquired steady-state
signal to transmit field inhomogeneities and incomplete spoiling. Here, a
simultaneous spiral VFA B1 and T1 mapping method is
presented that allows accurate whole-brain tissue T1 quantification
in less than one minute a 1.5T and 3T.Methods
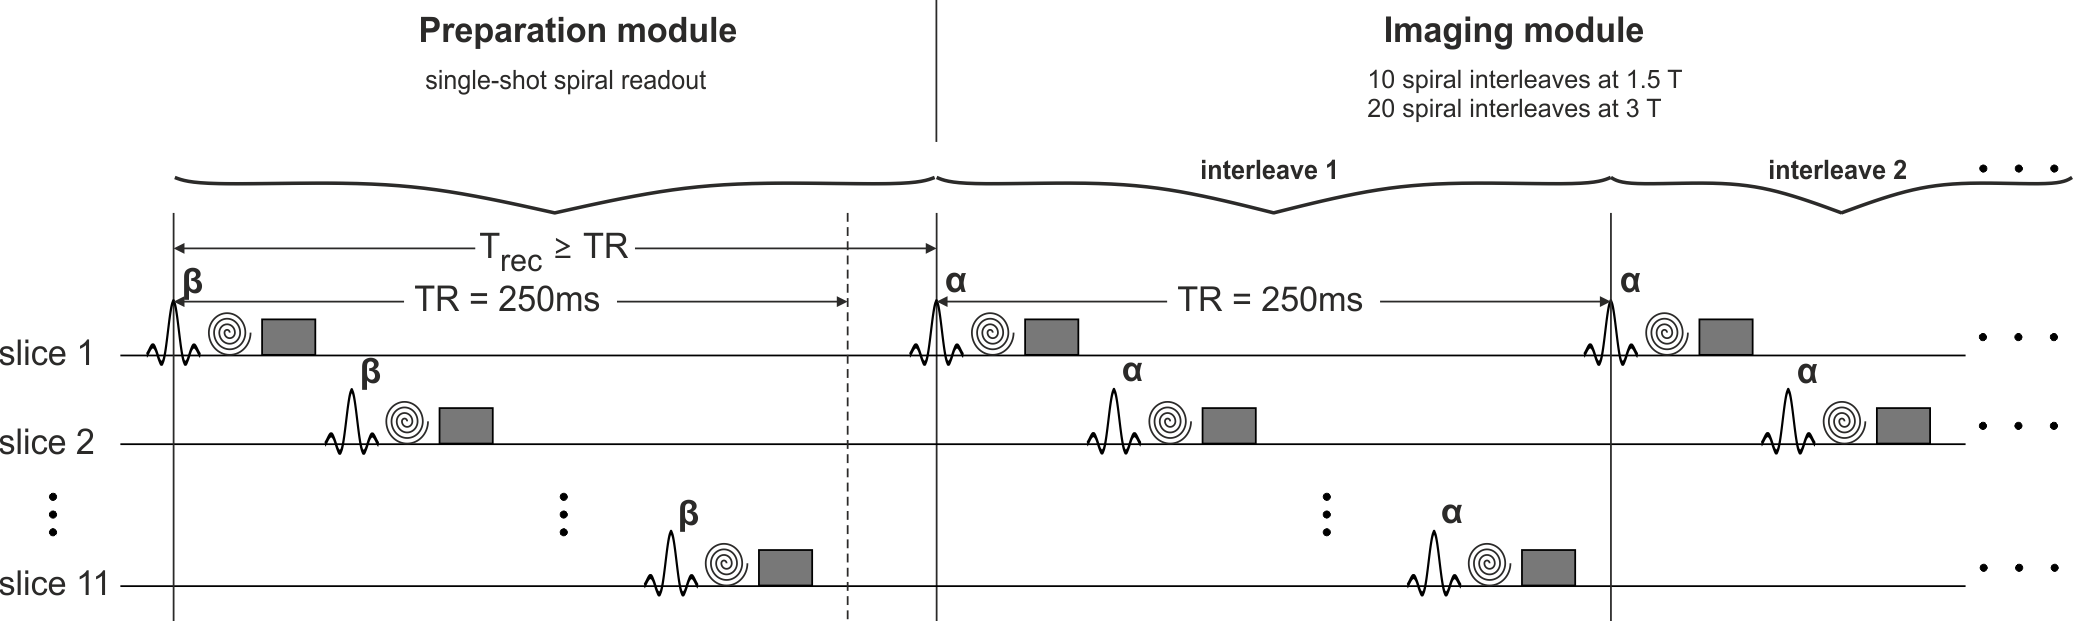
MR acquisition scheme.
Interleaved 2D multislice SPGR acquisitions using a prototype sequence were performed with efficient long-TR and diffusion spoiling at two different nominal flip angles (α) 1: TR=250ms, total spoiler gradient area per TR (AG) = 459 (mT/m)∙ms, α1=17°, and α2=80° (cf. Fig. 1). The k-space was sampled with a 2D spiral-out trajectory (receive bandwidth: 400kHz) 2. Ten spiral interleaves were acquired at 1.5T with a readout time of 10.7ms. At 3T, the number of interleaves was increased to 20 and the readout time consequently shortened to 6.6ms to reduce off-resonance sensitivity. A short scan time of 2.5s and 5s was yielded at 1.5T and 3T, respectively, to acquire one slice group (11 slices, in-plane resolution: 1.3x1.3mm2, slice thickness: 3mm).
The transition to steady state was minimized by a single preparation pulse with optimized nominal flip angle β and recovery period Trec (cf. Fig. 1). The following parameters were used 1: β1=34° / Trec,1=250ms (for α1=17°) and β2=102° / Trec,2=350ms (for α2=80°). The free induction decay (FID) signal during the preparation module was sampled with an in-plane resolution of 5.3x5.3mm2 by a single-shot spiral acquisition (readout time: 12.4ms / 12.1ms at 1.5T / 3T).
Five slice groups were measured with interleaved positioning to obtain whole-brain coverage (i.e., in total 55 slices, overall scan time: 28s / 53s at 1.5T / 3T). Obtained B1 and T1 values were compared to standard reference methods. The geometry of the reference B1 acquisition (duration: 12s) 3 was matched to one of the five acquired slice groups.
B1 and T1 calculation.
The distribution of the transverse magnetization across the slice was calculated for N discrete samples based on Bloch simulations. An actual flip angle at the center of the slice profile of βact = cB1·βnom / αact = cB1·αnom was assumed for the preparation and excitation pulses (cB1: B1 scaling factor, βnom / αnom: nominal flip angles). The x and y components of the FID sampled during the preparation module can be described as $$$S_{\beta,x}=K\cdot\sum_{i=1}^N\sin\beta_{i}\sin\theta_{i}$$$ and $$$S_{\beta,y}=K\cdot\sum_{i=1}^N\sin\beta_{i}\cos\theta_{i}$$$, respectively, yielding a total signal amplitude of $$$S_{\beta}=\sqrt{S_{\beta,x}^2+S_{\beta,y}^2}$$$ (K: factor including proton density, coil sensitivity, T2* relaxation; βi / θi: flip angle / phase at the location i across the slice calculated for βact). An estimate for B1 (cB1) was derived by numerical minimization based on the signal ratio $$$S_{\beta_{1}}/S_{\beta_{2}}$$$. The raw B1 maps were median filtered. Similarly, T1 was derived based on the signal ratio $$$S_{\alpha_{1}}/S_{\alpha_{2}}$$$ where $$$S_{\alpha_{1}}$$$ and $$$S_{\alpha_{2}}$$$ are ideally spoiled steady-state signal amplitudes calculated as the summation over the slice profile 4 with B1-corrected flip angles.
Results
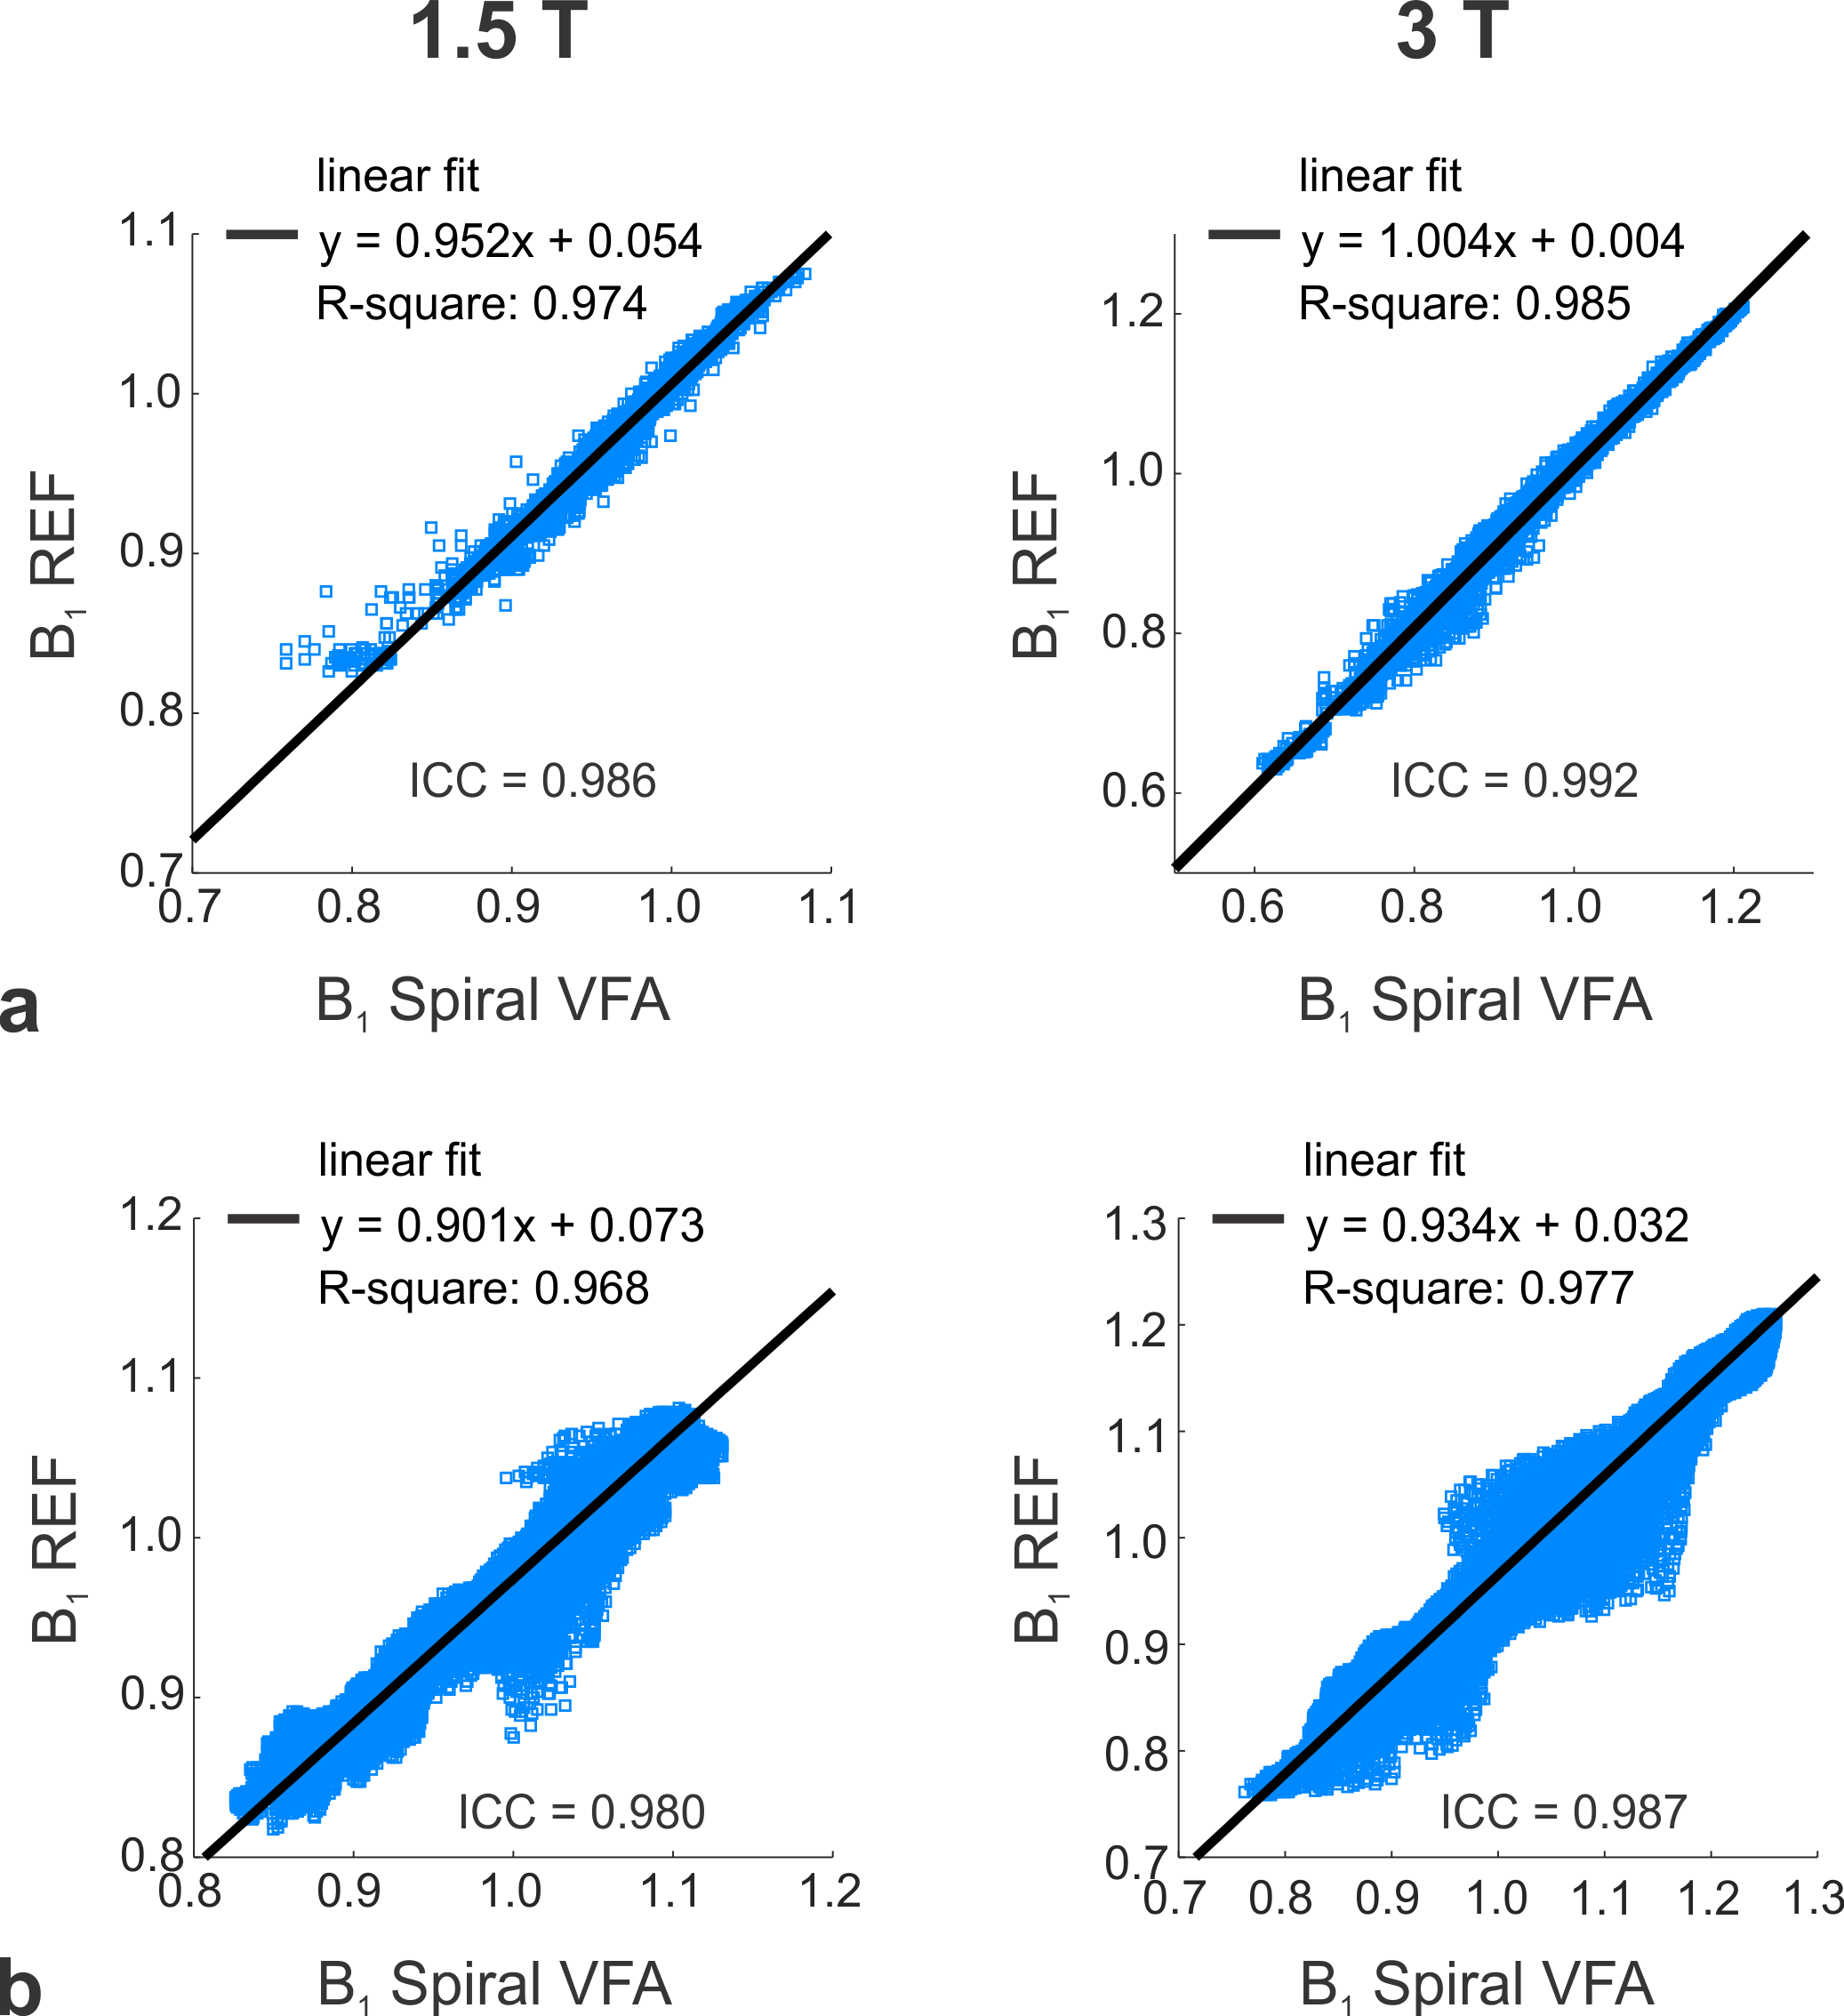
Excellent agreement with the reference B1 was observed both in
vitro (0.125mM MnCl2 in H2O, mimicking tissue T1
and T2 conditions) and in vivo (human brain) as reflected by
high intraclass correlation coefficients (ICC): 0.986 (1.5T) / 0.992 (3T) and 0.980
(1.5T) / 0.987 (3T) for the in vitro and in vivo scans,
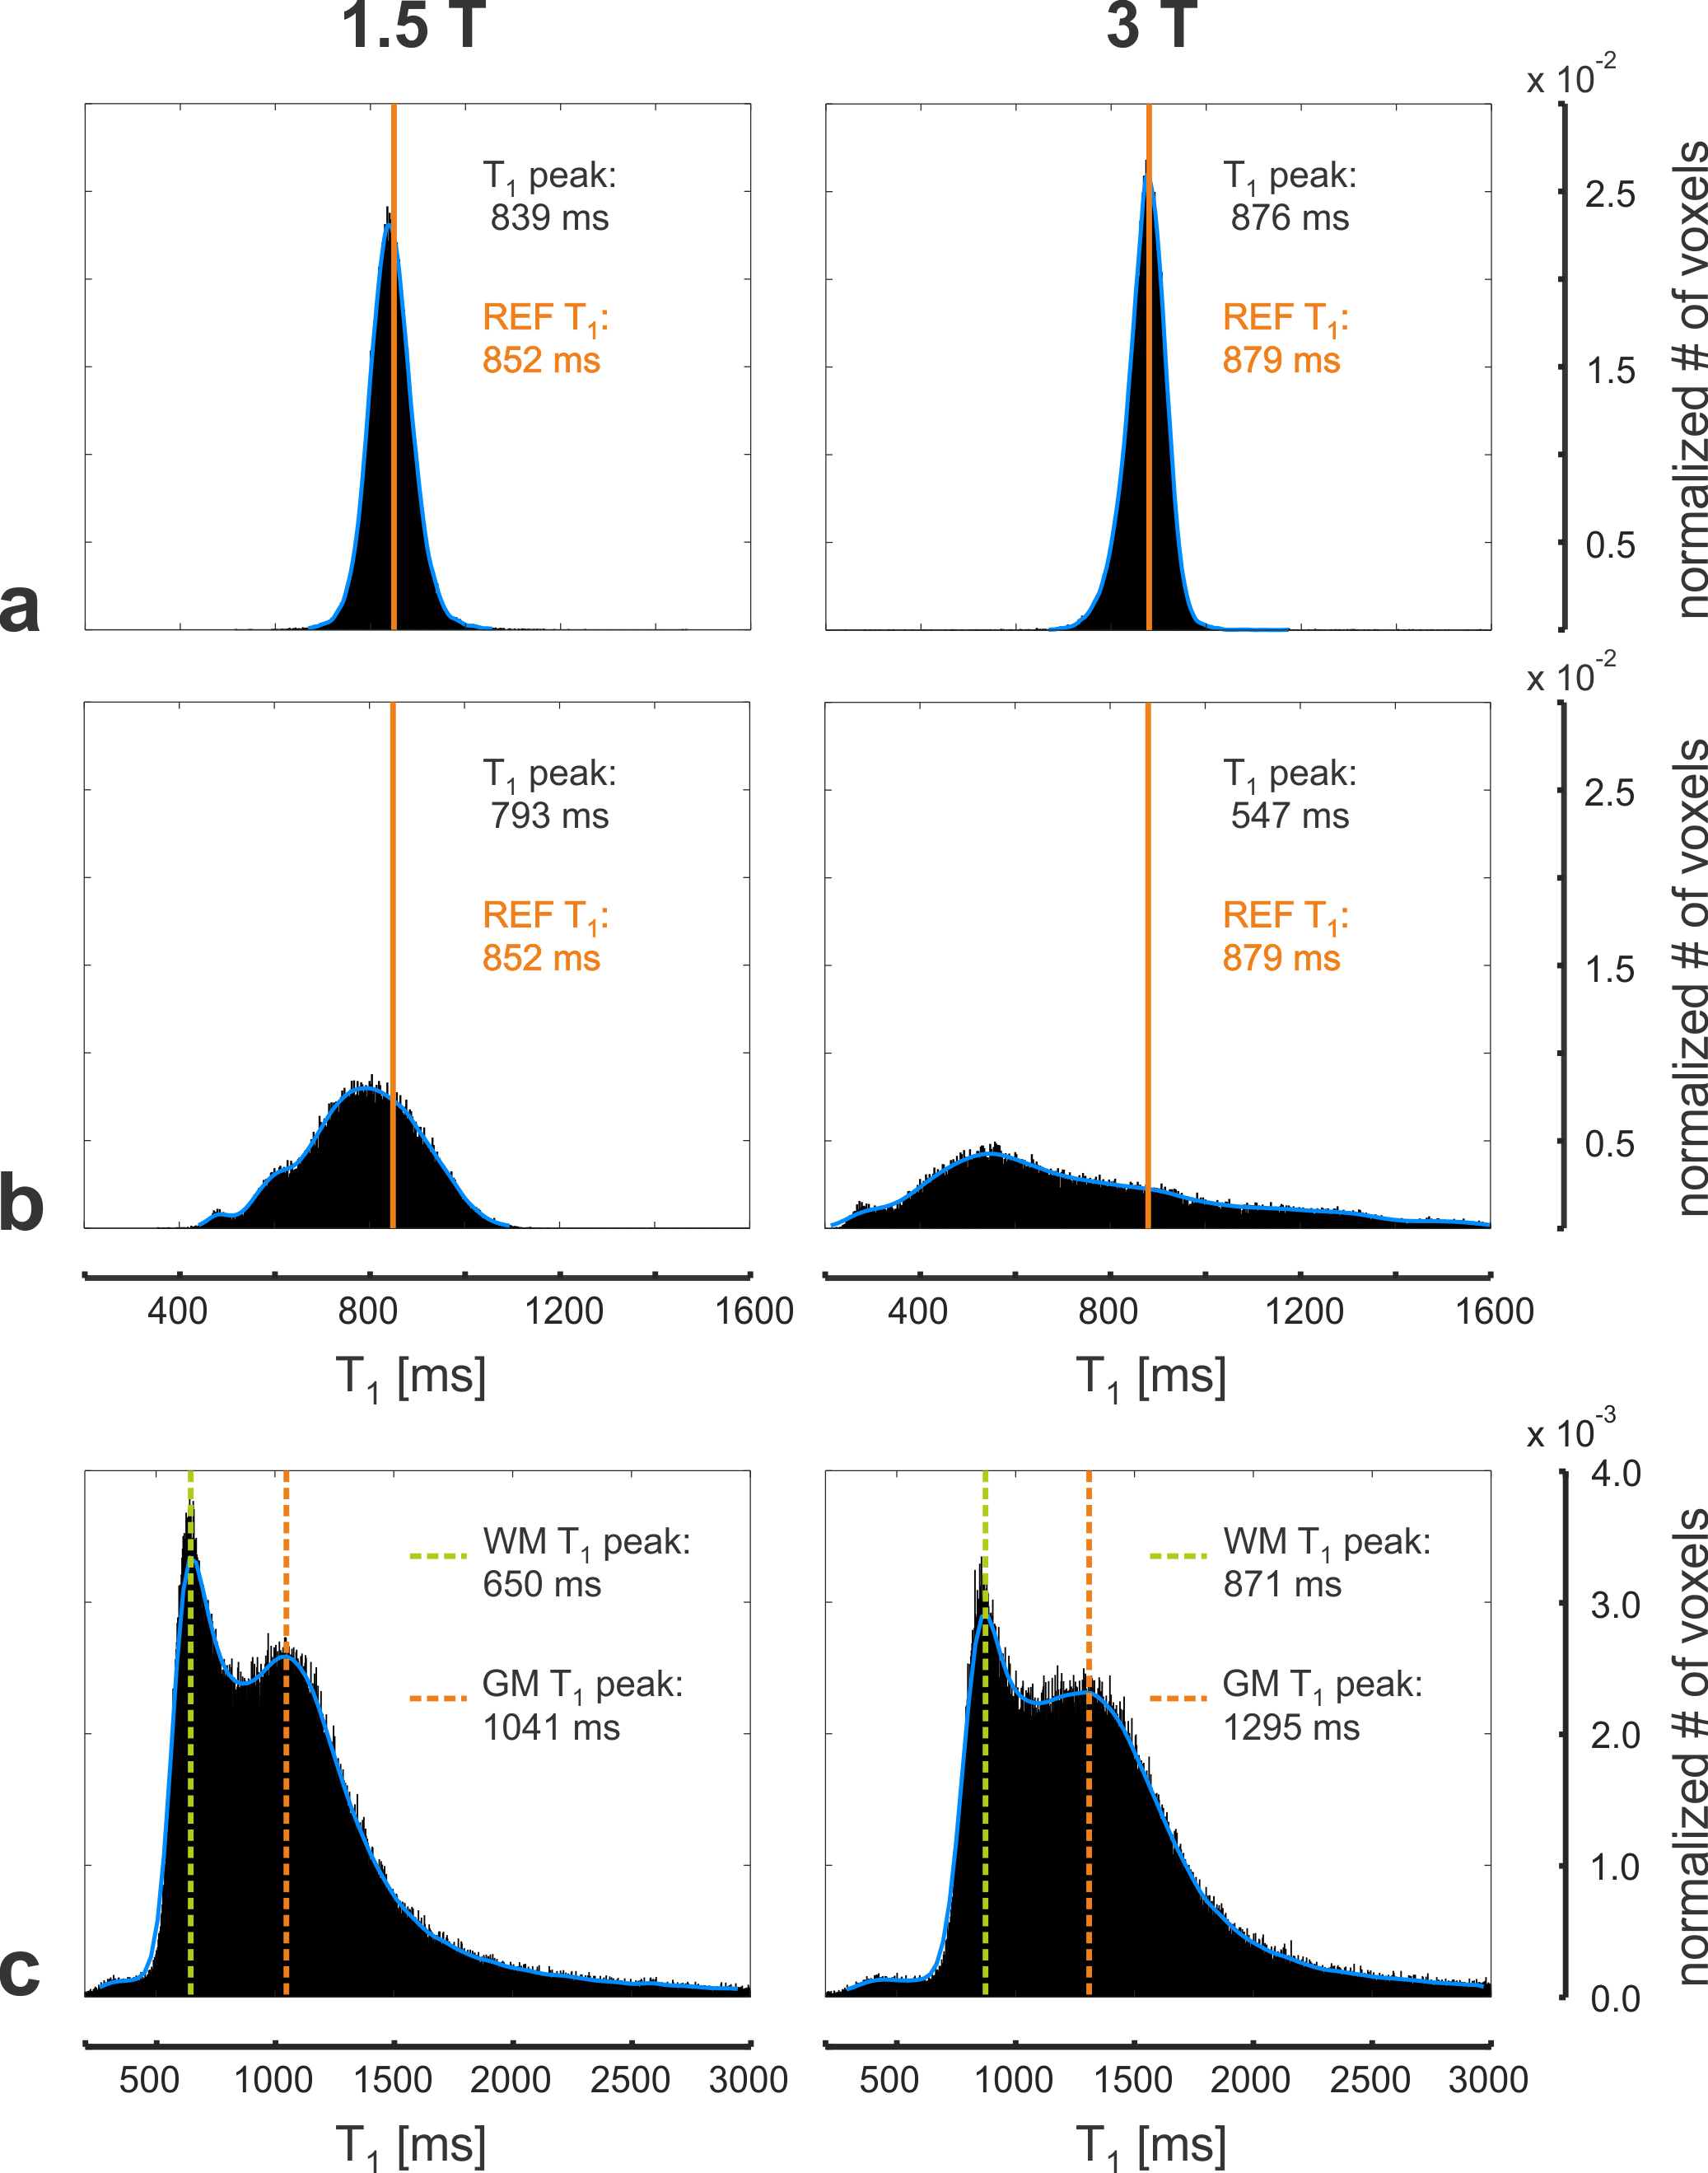
respectively (cf. Fig. 2). The peaks of the in vitro T1
histograms agree well with the reference T1 (cf. Fig. 3a), while the
corresponding histograms of the same data are highly degraded if B1
inhomogeneities are not corrected (cf. Fig. 3b). The B1-corrected whole-brain
T1 histograms obtained in a healthy volunteer at 1.5T and 3T show
clearly delineated WM and GM T1 peaks in good agreement with
literature values (cf. Ref. 5 and Fig. 3c). The corresponding B1 and
T1 maps appear artifact-free (cf. Fig. 4).Discussion and Conclusion
Reliable whole-brain
spiral VFA T1 mapping of human brain tissues is achieved in less
than one minute at both 1.5T and 3T. No additional scan time needs to be
invested for B1 mapping since flip angle miscalibrations can be
estimated in an ultrafast manner based on intrinsically coregistered contrasts
acquired during the preparation module (cf. Fig. 1). In conclusion, the fast
acquisition, volumetric coverage, and high accuracy accentuate the potential of
the presented technique for clinical applications.Acknowledgements
This work was supported by a grant from the Swiss National Science Foundation (SNF 325230-153332).References
1. Heule R, Pfeuffer J, Bieri O. Snapshot whole-brain T1 relaxometry using steady-state prepared spiral multislice variable flip angle imaging. Magn Reson Med 2017. doi: 10.1002/mrm.26746.
2. Meyer CH, Zhao L, Lustig M, Jilwan-Nicolas M, Wintermark M, Mugler JP, Epstein FH. Dual-density and parallel spiral ASL for motion artifact reduction. Proceedings ISMRM 2011. p 3986.
3. Chung S, Kim D, Breton E, Axel L. Rapid B1+ mapping using a preconditioning RF pulse with TurboFLASH readout. Magn Reson Med 2010;64(2):439-446.
4. Parker GJ, Barker GJ, Tofts PS. Accurate multislice gradient echo T1 measurement in the presence of non-ideal RF pulse shape and RF field nonuniformity. Magn Reson Med 2001;45(5):838-845.
5. Rooney WD, Johnson G, Li X, Cohen ER, Kim SG, Ugurbil K, Springer CS, Jr. Magnetic field and tissue dependencies of human brain longitudinal 1H2O relaxation in vivo. Magn Reson Med 2007;57(2):308-318.
Figures