0261
Non-Invasive Determination of Sodium Pump Activity In Vivo with DWI1Advanced Imaging Research Center, Oregon Health & Science University, Portland, OR, United States, 2Radiology, University of Washington, Seattle, WA, United States, 3Radiology, University of Colorado Denver, Aurora, CO, United States
Synopsis
Using a very simple model, Monte Carlo random walk simulated DWI b-space decays exhibit sensitivity to parameters measuring membrane Na+,K+-ATPase activity, cell density, and voxel average cell volume. Furthermore, the simulation matching the literature experimental in vivo human cerebral cortex b‑space decay has model parameters in near absolute agreement with the most pertinent literature values. The model parameters are: kio = 2 s-1, ρ = 80,400 cells/μL, and V = 9.2 pL. In addition, the ADC of this simulation agrees with published results.
INTRODUCTION
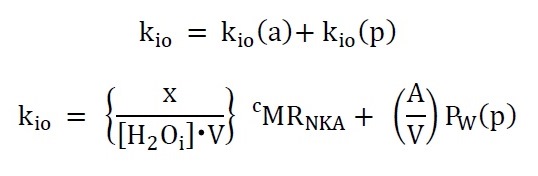
Perhaps biology’s most vital enzyme is the cell membrane Na+,K+-ATPase [NKA], which maintains the ion gradients and membrane potential. Yet, it has never been possible to measure the cellular metabolic NKA rate, cMRNKA, in vivo. Recent results1 suggest the steady-state cellular water efflux rate constant, kio, has a cMRNKA contribution, Figure 1. The fundamental tissue properties; mean cell volume, V, and cell density, ρ [cells/μL], have also not been measurable in vivo.METHODS
A straightforward Monte Carlo random walk approach2,3 can evaluate kio, ρ, and V. Accordingly, we simulated water molecule displacements within a 3D ensemble of 10,648 identical spheres having hexagonal close-packed symmetry;3 a primitively simple, parsimonious approach with no vasculature or intrinsic anisotropy. The 37oC pure water diffusion coefficient, D0 = 3.0 μm2/ms, was used for all particles, whether inside or outside cells.RESULTS
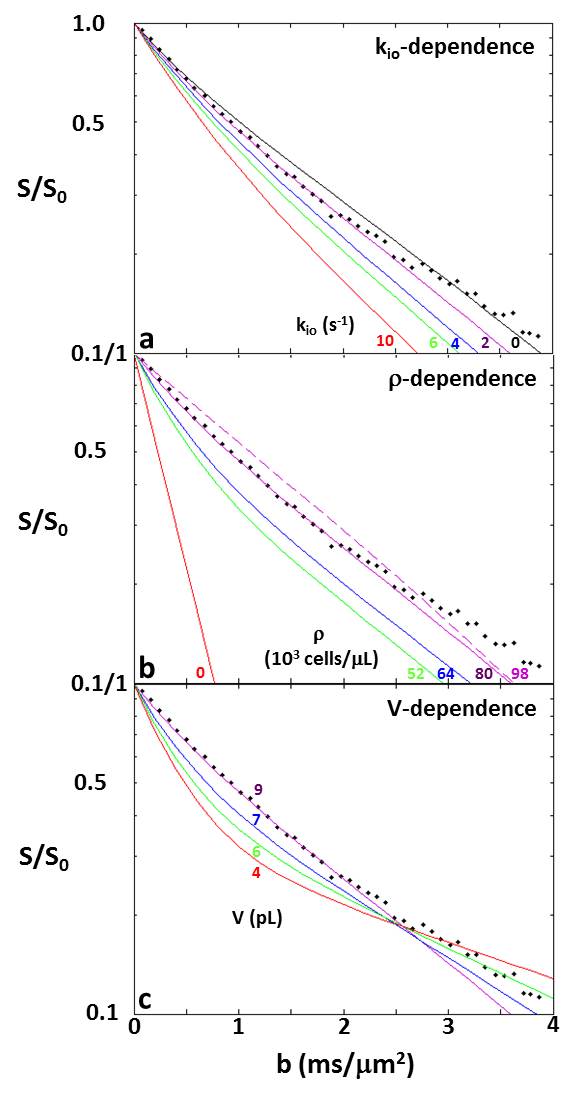
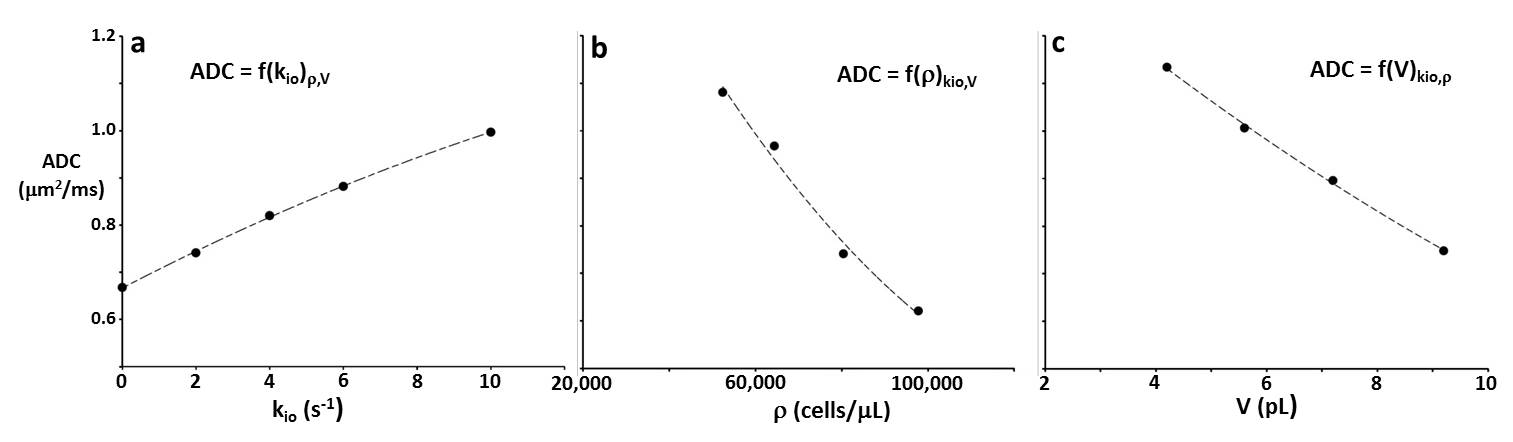
Figure 2a-c present simulation families varying, in turn, kio, ρ, and V. The ordinates measure log[S/S0], where S and S0 are the D-w and total transverse signal intensities: the abscissae report normalized coherence decay, b [≡º (γGδ)2tD: γ is the 1H magnetogyric ratio, G and δ the PFG strength and duration, and the diffusion time tD ≡º [Δ ‑ (δ/3)], Δ is the interval between the PFG pair leading edges]. In Fig. 2a, decays for five kio values are shown with V fixed at 9.2 pL [cell radius, R = 13 μm] and ρ at 80,400 cells/μL [ρ = vi/V: the intracellular volume fraction, vi = 0.74; the cells touched]. Non-linear, non‑Gaussian decays in these semi-log plots are kio-sensitive. The ADC [apparent diffusion coefficient; the negative of the asymptotic {ln(S/S0)/b} slope] increases with kio for constant ρ and V (Figure 3a). This is sensible: on the average, water molecules can move further, and de‑phase more, the more permeable the cell membranes. In Fig. 2b, decays for five ρ values are shown with V fixed at 9.2 pL and kio at 2.0 s-1. [For ρ = 97,800 cells/μL, the spheres were slightly deformed toward cubes (dashed curve): vi of 0.90 [(97.8 x 10³ cells/μL(tissue))(9.2 x 10-6 μL/cell)] is not achievable with close-packed spheres.] The (red) decay for ρ = 0 [pure water] is linear; a Gaussian diffusion process with ADC = D0. For fixed kio and V, ADC decreases with increasing ρ (Fig. 3b). This is also sensible: water molecules cannot translate as well with greater cellularity. But, the Fig. 3b span is 45,400 cells/μL, a very large ρ increase [a typical human 1H2O MR voxel is 1 μL]. In Fig. 2c, decays for four V values are shown, with ρ fixed at 80,400 cells/μL and kio at 2.0 s-1. At small b, cell swelling decreases ADC [conventional wisdom; Fig. 3c] but increases it at larger b values. The range from 4.2 to 9.2 pL is a more than V doubling; a large increase.DISCUSSION
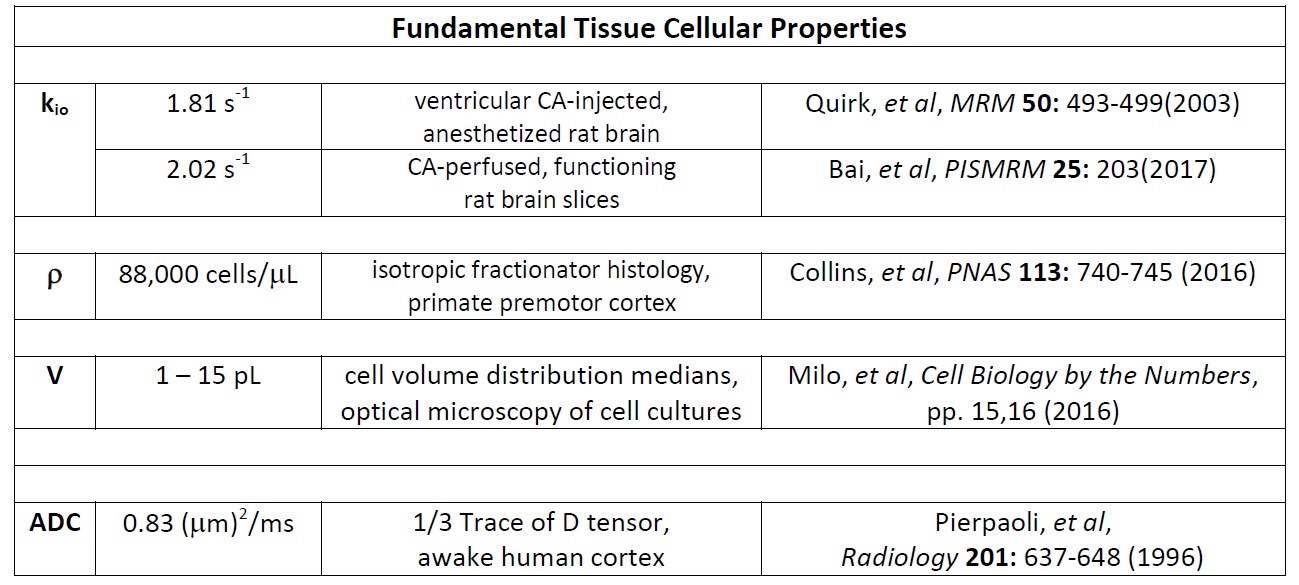
Figure 2 shows well-validated data4 from a 3.3 mL human cerebral cortex ROI in vivo (diamonds). The agreement of one simulation (purple solid curve in each panel), especially at clinical b [below ~2.5 ms/(μm)2 = 2500 s/(mm)2], is very gratifying. Besides matching the data, the parameters for the purple simulation [kio = 2.0 s-1, ρ = 80,400 cells/μL, V = 9.2 pL] are in near absolute agreement with the most pertinent literature, Figure 4. This includes the purple curve ADC, which is 0.74 (μm)2/ms. This seems rather remarkable, since we have not yet executed a formal fitting.
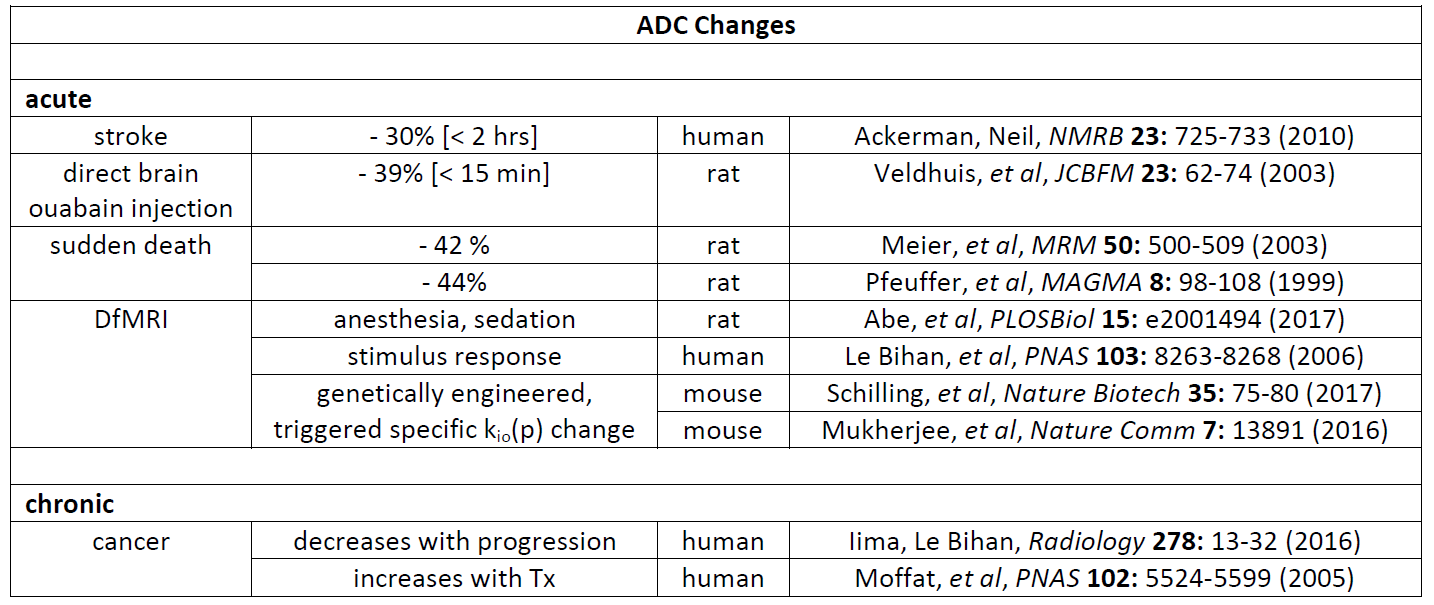
An overall picture from Fig. 2 is the major determinants of tissue ADC are the "concentration" of membranes [inversely], and their permeability [directly], with interesting implications for a number of DWI applications. One can distinguish acute and chronic ADC changes, Figure 5. Since cMRNKA controls major osmolyte fluxes [e.g., 25 billion Na+ and K+ ions(cycled)/s/cell], kio(a) could change very quickly. Fast V changes are often invoked, and this is possible. However, note these would have to be rather large, and averaged over 104 to 105 cells/voxel. For example, it is interesting that the ADC decrease caused by direct injection of the specific NKA inhibitor ouabain is similar to that for stroke, and for sudden death (Fig. 5). V changes occur, but are likely not causative for ADC changes.5 In no case has a kio change been found due solely to the V change.1 At the other extreme, the large ρ changes required [> 103 cells/voxel] must certainly be chronic. The prime example is in oncology, Fig. 5. Pure cancer loci can exceed 106 (small)cells/μL.1 However, kio should be much more quickly responsive to therapy.6
Acknowledgements
We appreciate the encouragement of Dr. Peter Basser.References
1. Springer, et al, NMR Biomed 27: 760-773 (2014).
2. Wilson, et al, MRM 77: 2015-2027 (2017).
3. Wilson, et al, Proc. ISMRM 25: 1738 (2017).
4. Clark and Le Bihan, MRM 44: 852-859 (2000).
5. Ackerman and Neil, NMR Biomed 23: 725-733 (2010).
6. Tudorica, et al, Trans Oncol 9: 8-17 (2015).
7. Day, et al, Biochim Biophys Acta 1840: 1492-1506 (2014).
Figures