0260
Validity Regimes of the Spherical Mean Technique1Champalimaud Research, Champalimaud Centre for the Unknown, Lisbon, Portugal
Synopsis
The mean spherical technique (SMT) has been proposed as an attempt to disentangle microscopic diffusion properties from the mesoscopic tissue organization. However, it remains unclear under which conditions exactly the technique could still fruitfully deliver its metrics. In this study, SMT’s microscopic fractional anisotropy estimates (μFA) are investigated using synthetic and high-quality diffusion data. We find that any compartmental heterogeneity can crucially impact the µFA extracted from SMT. In addition, the b-value ranges where SMT delivers accurate information is specific to the microstructure itself. Our work suggests that SMT-driven µFA should be examined with care.
Introduction
Diffusion MRI (dMRI) techniques can be used to probe microstructural features in-vivo and have been widely used in longitudinal central nervous system studies1. An emerging dMRI field of research targets the disentangling of microscopic fractional anisotropy (µFA) from the mesoscopic tissue organization and orientation dispersion2-4. In particular, the recently proposed spherical mean technique (SMT)2 has been proposed for extracting µFA from powder-averaged signal decays. Here, SMT’s validity regimes vis-à-vis μFA extraction is investigated both in-silico and in ex-vivo experiments.Theory
By representing the effective mesoscopic diffusion $$$\mathbf{D_t}$$$ by individual coherent microscopic diffusion microenvironments $$$\mathbf{D_i}$$$ ($$$\mathbf{D_t}=\sum_i\mathbf{D_i}$$$), the μFA can be defined as3:
$$\mu FA^2=\frac{3}{2}\frac{\left\langle V(\mathbf{D_i}))\right\rangle}{\left\langle E(\mathbf{D_i}))\right\rangle^2+\left\langle V(\mathbf{D_i}))\right\rangle}$$ (1)
where $$$\left\langle E(\mathbf{D_i}))\right\rangle$$$ and $$$\left\langle V(\mathbf{D_i}))\right\rangle$$$ are the average of all $$$\mathbf{D_i}$$$ eigenvalue’s mean and all $$$\mathbf{D_i}$$$ eigenvalue’s variance. Assuming that all microscopic diffusion contributions $$$\mathbf{D_i}$$$ can be represent by diffusion tensors, all with equal radial diffusivity $$$RD_i$$$ and equal axial diffusivity $$$AD_i$$$, the SMT model can be expressed as2:
$$\overline{E}(b)=e^{-b.RD_i}\frac{\sqrt{\pi}}{2}\frac{erf(\sqrt{b(AD_i-RD_i)})}{\sqrt{b(AD_i-RD_i)}}$$ (2)
where $$$\overline{E}(b)$$$ is the powder average signal for a given b-value and $$$erf$$$ is the error function. Given the SMT approximation, μFA can be estimated by rewriting equation 1 as:
$$\mu FA^2=\frac{(AD_i-RD_i)^2}{AD_i^2-2RD_i^2}$$ (3)
Methods
Simulations: The robustness of SMT is tested based on three types of simulations:
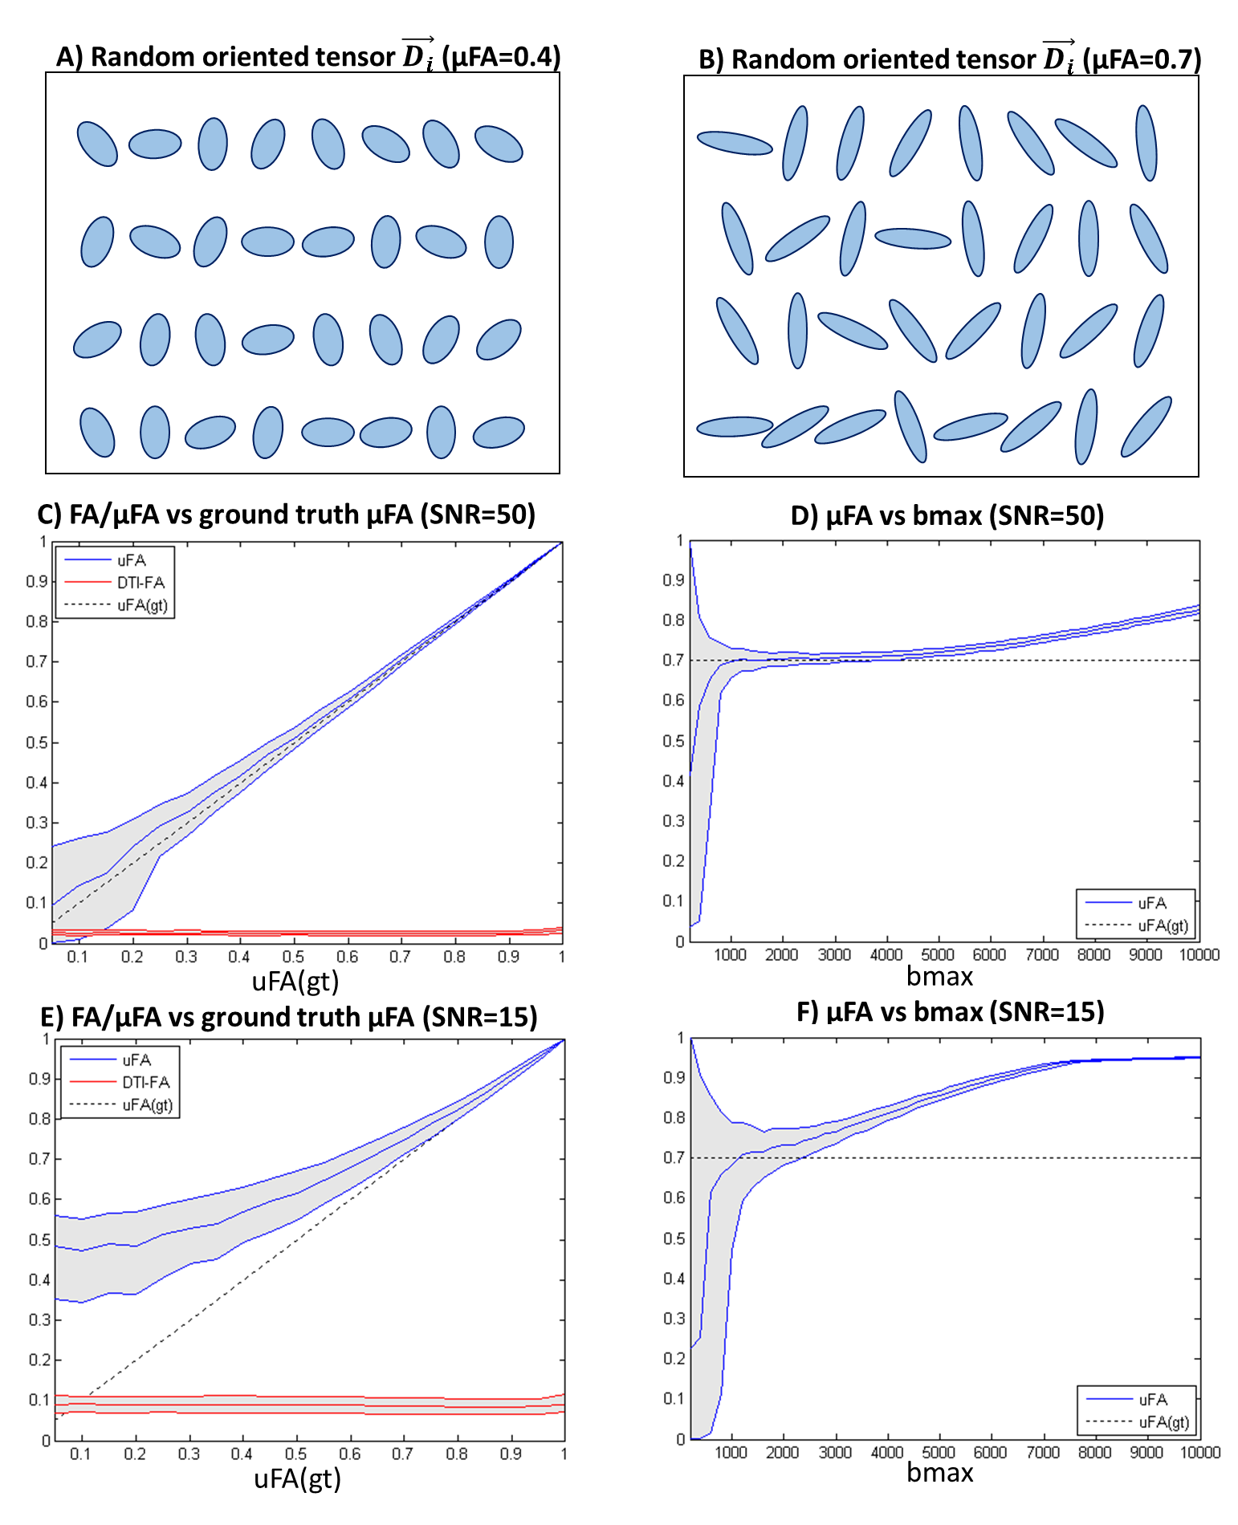
1. Valid SMT assumptions (purely gaussian diffusion). Synthetic signals are first reconstructed based on 1000 random-oriented microenvironments with equal radial diffusivity $$$RD_i$$$ and axial diffusivity $$$AD_i$$$ (Fig.1A-B). μFA estimates are then obtained from SMT by fitting the powder averaged signals for 5 evenly-spaced b-values (from 0 to a given maximum b-value=bmax). To assess the effects of noise, Rician noise was added to produce nominal SNRs of 50 and 15.
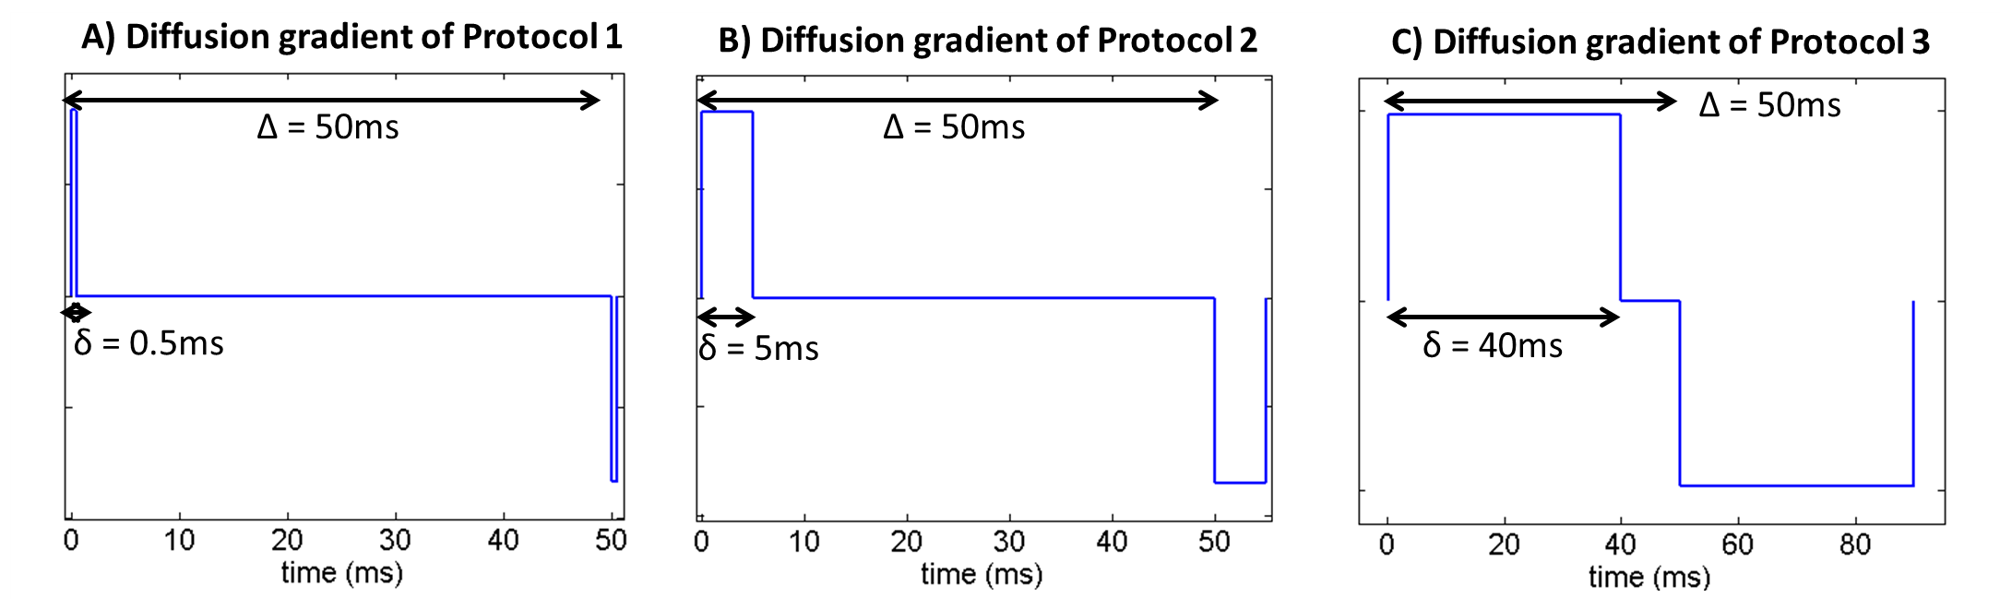
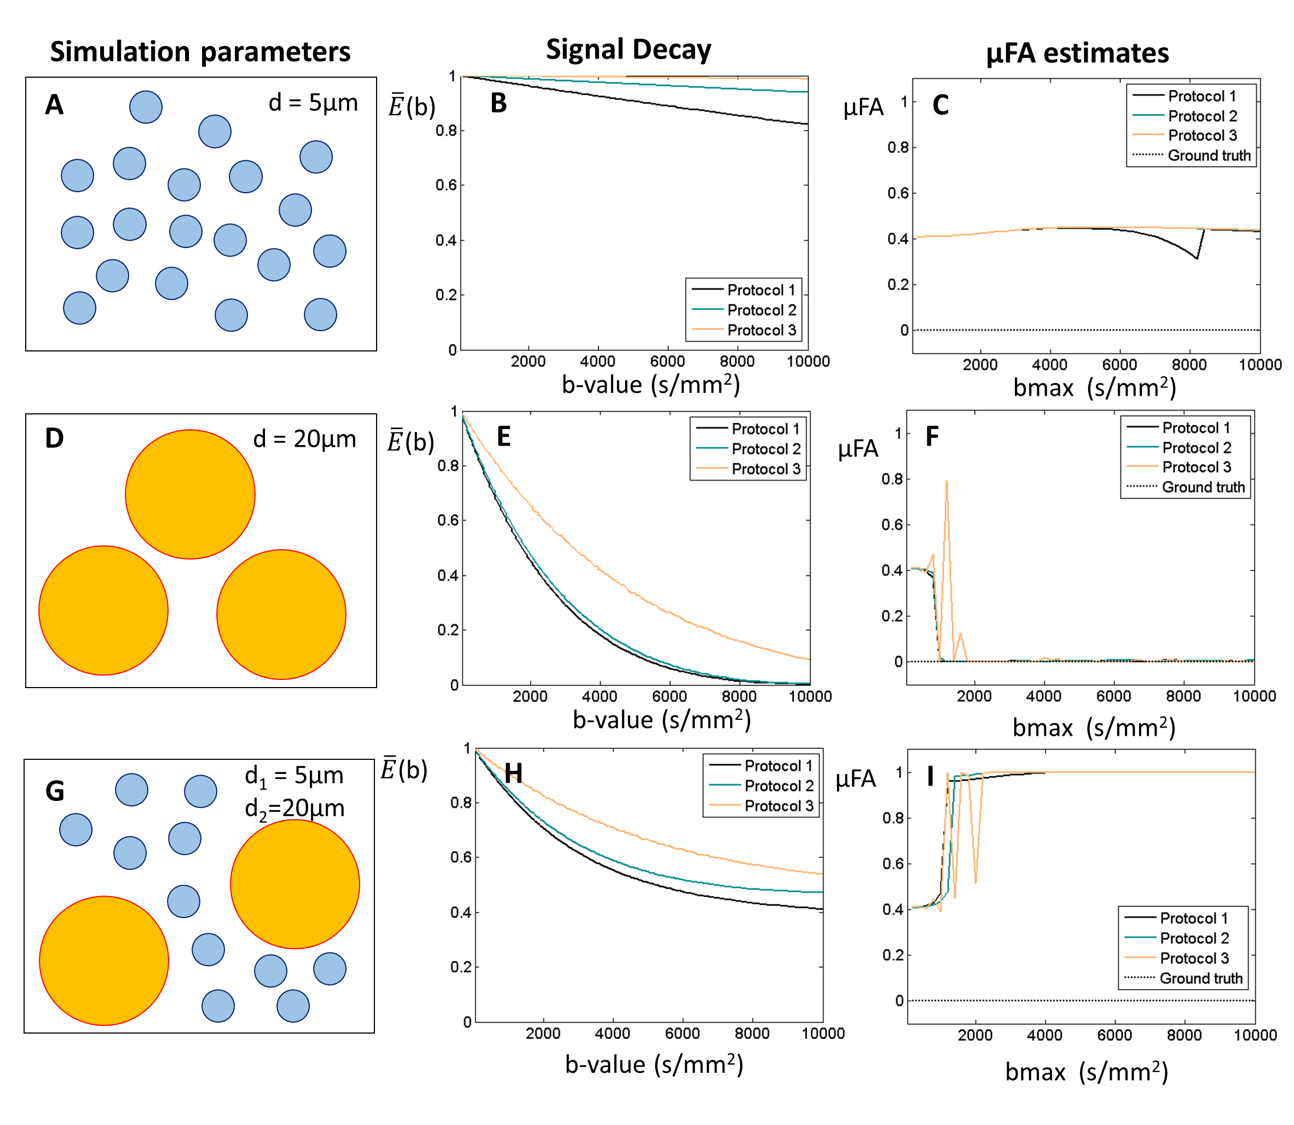
2. Restricted diffusion for µFA = 0. This simulation takes into account microstructural restriction and compartmentation. Synthetic diffusion-weighted signals restricted by spherical pores (ground truth µFA = 0) were generated using the MISST package5 for three different pulsed SDE protocols corresponding to (nearly) ideal (short-gradient pulse and long diffusion time), preclinical, and clinical settings, respectively (Fig.2).
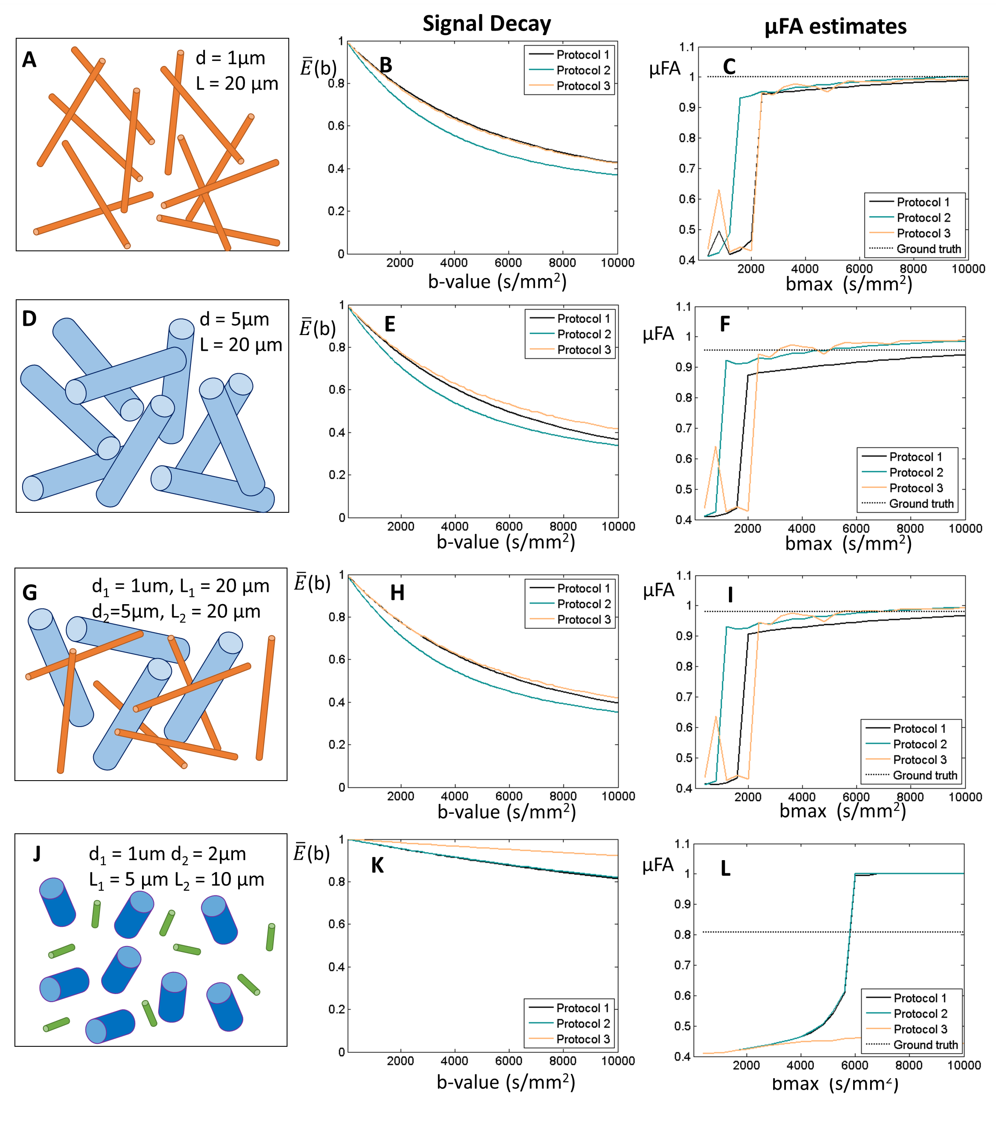
3. Restricted diffusion for nonzero µFA. Diffusion-weighted signals restricted by randomly oriented finite cylinders with different diameters and lengths were generated using MISST5. Ground-truth µFA values were derived for each cylinder separately.
Specimen preparation: All animal experiments were preapproved by the local ethics committee operating under local and EU law. Commercial (wet) yeast cells (s. cerevisiae) were placed in PBS for 48h, and then in an NMR tube for one week prior to experiments to ensure stability. A rat spinal cord was chemically perfused from a healthy adult rat (N=1), immersed in 4% PFA for 24h, and then placed in PBS for at least 48h prior to scanning.
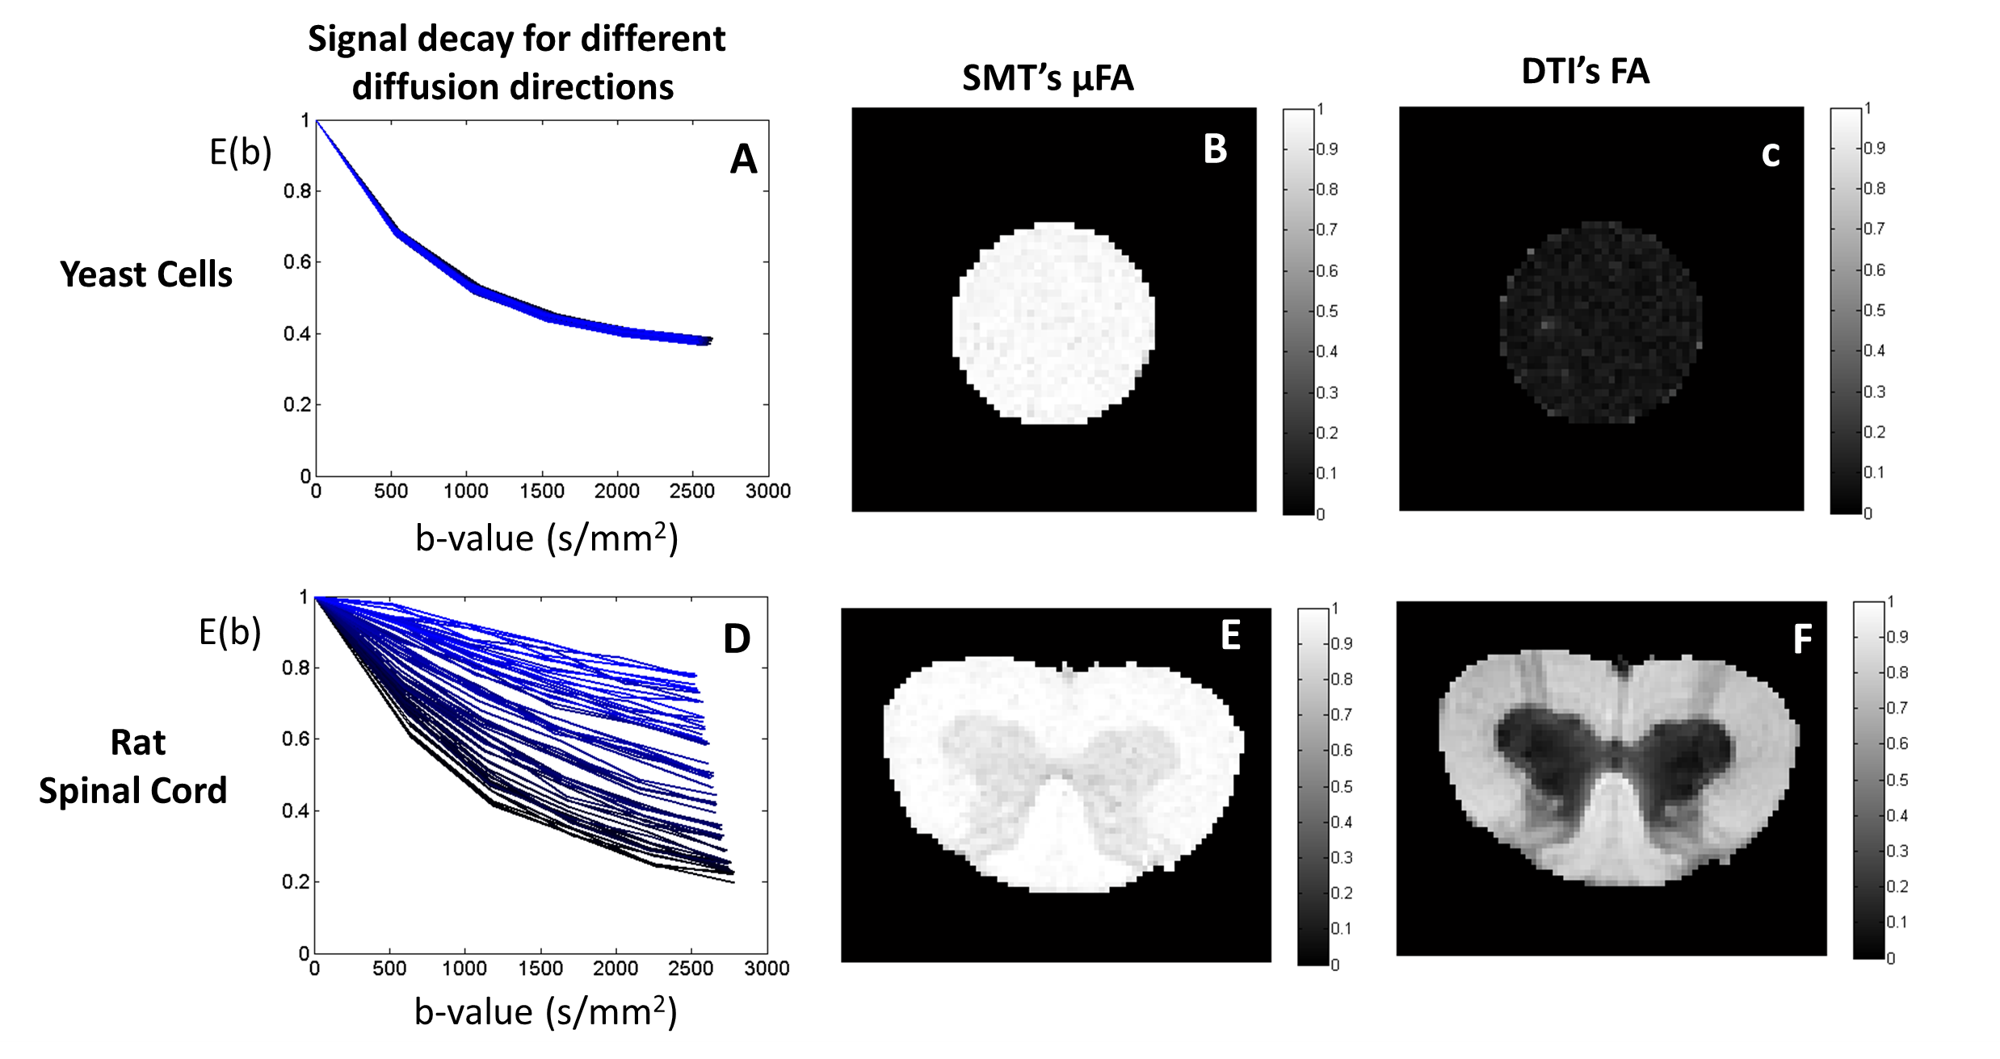
MRI experiments: All experiments were acquired using a 16.4 T Bruker scanner equipped with a Micro5 probe. Yeast cell scans were acquired using a stimulated-echo sequence with 60 diffusion-weighted directions for b-values=500:500:2500s/mm2 (TR/TE=4000/29.7ms, Δ/δ =50/0.5ms, #b0=8, voxel resolution 0.15×0.15×1.5mm, averages=4). The rat spinal cord was acquired using the same sequence (TR/TE=2200/25ms, Δ/δ = 50/0.8 ms, #b0=10, voxel resolution 0.0625×0.0625×1mm, averages=4).
Results and Discussion
Simulations:
1) Valid SMT assumptions (purely gaussian diffusion). SMT’s μFA estimates matches the expected values for high SNR simulations (Fig.1C,E). For a ground truth μFA value of 0.7, μFA estimates show an optimal bmax range between 2000 and 4000 s/mm2 (Fig.3D,F).
2) Spherical restriction. Non-zero μFA estimates are obtained for sphere with small diameters (Fig.3A-C). Zero μFA estimates were only observed on the optimal bmax range of SMT for sphere with diameters of 20 μm (Fig.3D-F). Moreover, μFA seems to be overestimated and approach µFA=1 when spheres size polydispersity exists (Fig.3G-I).
3) Cylindrical restriction. μFA estimates tend to their expected values for large bmax when cylinders have ground-truth μFA > 0.9 (Fig.4A-I). SMT does not correctly estimate μFA for cylinders with lower ground-truth μFA values, and furthermore, estimates seem to be highly biased by the presence of size polydispersity when bmax is higher than 6000 s/mm2 (Fig.4J-L).
MRI experiments: As predicted by simulations, SMT overestimates the μFA of spherical objects such as yeast cells (Fig.5C). This is likely a consequence of the distribution of different cell sizes6. Results for the Rat’s spinal cord show that μFA estimates do not provide different contrast for white matter tracts which are known to have different size distributions7.
Conclusion
SMT’s μFA estimates approach their expected values when the ground truth μFA is high. However, SMT’s μFA estimates seem highly sensitive to heterogeneity for low μFA, and depend on acquisition parameters such as the set of b-values used. Therefore, SMT's μFA values in future studies should be interpreted with care. Moreover, future studies should assess if accounting for higher orders in SMT provides more accurate μFA estimations8-10.
Acknowledgements
This study was funded by the European Research Council (ERC) (agreement No. 679058). The authors acknowledge Dr. Daniel Nunes for the assistance in the preparation of the Rat’s spinal cord.References
1. Le Bihan D, Johansen-Berg H. Diffusion MRI at 25: Exploring brain tissue structure and function. Neuroimage 2012; 61: 324-341. doi: 10.1016/j.neuroimage.2011.11.006.
2. Kaden E, Kruggel F, Alexander DC. Quantitative mapping of the per-axon diffusion coefficients in brain white matter. Magn Reson Med. 2016; 75(4): 1752-63. doi: 10.1002/mrm.25734.
3. Szczepankiewicz F, Van Westen D, Englund E, et al. The link between diffusion MRI and tumor heterogeneity: Mapping cell eccentricity and density by diffusional variance decomposition (DIVIDE). Neuroimage 2016; 142:522-532. doi: 10.1016/j.neuroimage.2016.07.038.
4. Shemesh N, Jespersen SN, Alexander DC, et al. Conventions and Nomenclature for Double Diffusion Encoding NMR and MRI. Magnetic Resonance in Medicine 2016; 75:82–87. doi: 10.1002/mrm.25901
5. Drobnjak I, Zhang H, Hall MG, Alexander DC. The matrix formalism for generalised gradients with time-varying orientation in diffusion NMR. Journal of Magnetic Resonance 2011; 210(1): 151-157. doi: 10.1016/j.jmr.2011.02.022.
6. Shemesh N, Álvarez GA, Frydman L. Size Distribution Imaging by Non-Uniform Oscillating-Gradient Spin Echo (NOGSE) MRI. PLoS One 2015; 10(7):e0133201. doi: 10.1371/journal.pone.0133201
7. Nunes D, Cruz TL, Jespersen SN, Shemesh N. Mapping axonal density and average diameter using non-monotonic time-dependent gradient-echo MRI. Journal of Magnetic Resonance 2017; 277:117-130. doi: 10.1016/j.jmr.2017.02.017.
8. Kaden E, Kelm, ND, Carson RP, et al. Multi-compartment microscopic diffusion imaging. Neuroimage 2016; 139:346-359. doi:10.1016/j.neuroimage.2016.06.002
9. Jespersen SN, Olesen JL, Hansen B, Shemesh N. Diffusion time dependence of microstructural parameters in fixed spinal cord. NeuroImage 2017; In Press. doi: 10.1016/j.neuroimage.2017.08.039.
10. Veraart J, Novikov DS, Fieremans E. TE dependent Diffusion Imaging (TEdDI) distinguishes between compartmental T2 relaxation times. Neuroimage 2017; In Press. doi:10.1016/j.neuroimage.2017.09.030
Figures