0253
The Dot…wherefore art thou? Search for the isotropic restricted diffusion compartment in the brain with spherical tensor encoding and strong gradients1CUBRIC, School of Psychology, Cardiff University, Cardiff, United Kingdom, 2Clinical sciences, Lund, Lund University, Lund, Sweden, 3Random Walk Imaging AB, Lund, Sweden
Synopsis
The accuracy of biophysical models requires that all relevant tissue compartments are modelled. The so-called “dot compartment” is a conjectured compartment that represents small cells with apparent diffusivity approaching zero. We establish an upper limit of the “dot-fraction” across the whole brain in vivo, by using ultra-high gradients and optimized gradient waveforms for spherical tensor encoding. We report a notable signal above the noise floor in the cerebellar gray matter even for an extremely high b-value of 15000 s/mm2. For cerebral tissue, the dot-fraction seems negligible, and we consider how exchange may have affected this result.
Introduction
Biophysical modelling of the diffusion MRI (dMRI) signal can be used for tissue microstructure characterisation by carefully selecting model compartments with a relevant impact on the signal1. The inclusion of a “dot-compartment” is motivated by the ubiquity of small cells, wherein water may be trapped and its diffusion highly restricted2. Previous work investigating the minimum model requirements for brain white matter (WM) was based on “linear tensor encoding” (e.g., Stejskal-Tanner) and showed that including a dot-compartment better explained the dMRI signal3,4. However, its inclusion is not generally adopted in vivo5,6. Probing the dot-compartment in anisotropic tissue is challenging with linear encoding, due to the strong relation between encoding direction and orientation distribution of anisotropic tissue microenvironments. Here, we instead use “spherical tensor encoding” (STE) to render signals insensitive to orientation and anisotropy7,8. By so doing, the signal becomes the Laplace transform of the distribution of isotropic diffusivities8,9, where a signal plateau indicates a dot-compartment. Previous STE-based results suggest a negligible dot-fraction in WM10, but the use of gradient amplitudes of below 80mT/m limited the maximal b-value and SNR needed for accurate assessment of small dot fractions. In this work, we: 1) leverage asymmetric STE waveforms and ultra-strong gradients to significantly reduce the TE and increase SNR; 2) study the signal decay for b-values up to 15000 s/mm2; 3) extend the search to both the cerebellum and cerebrum. This facilitates a more accurate estimation of the dot signal fraction across the whole brain, in vivo.Theory
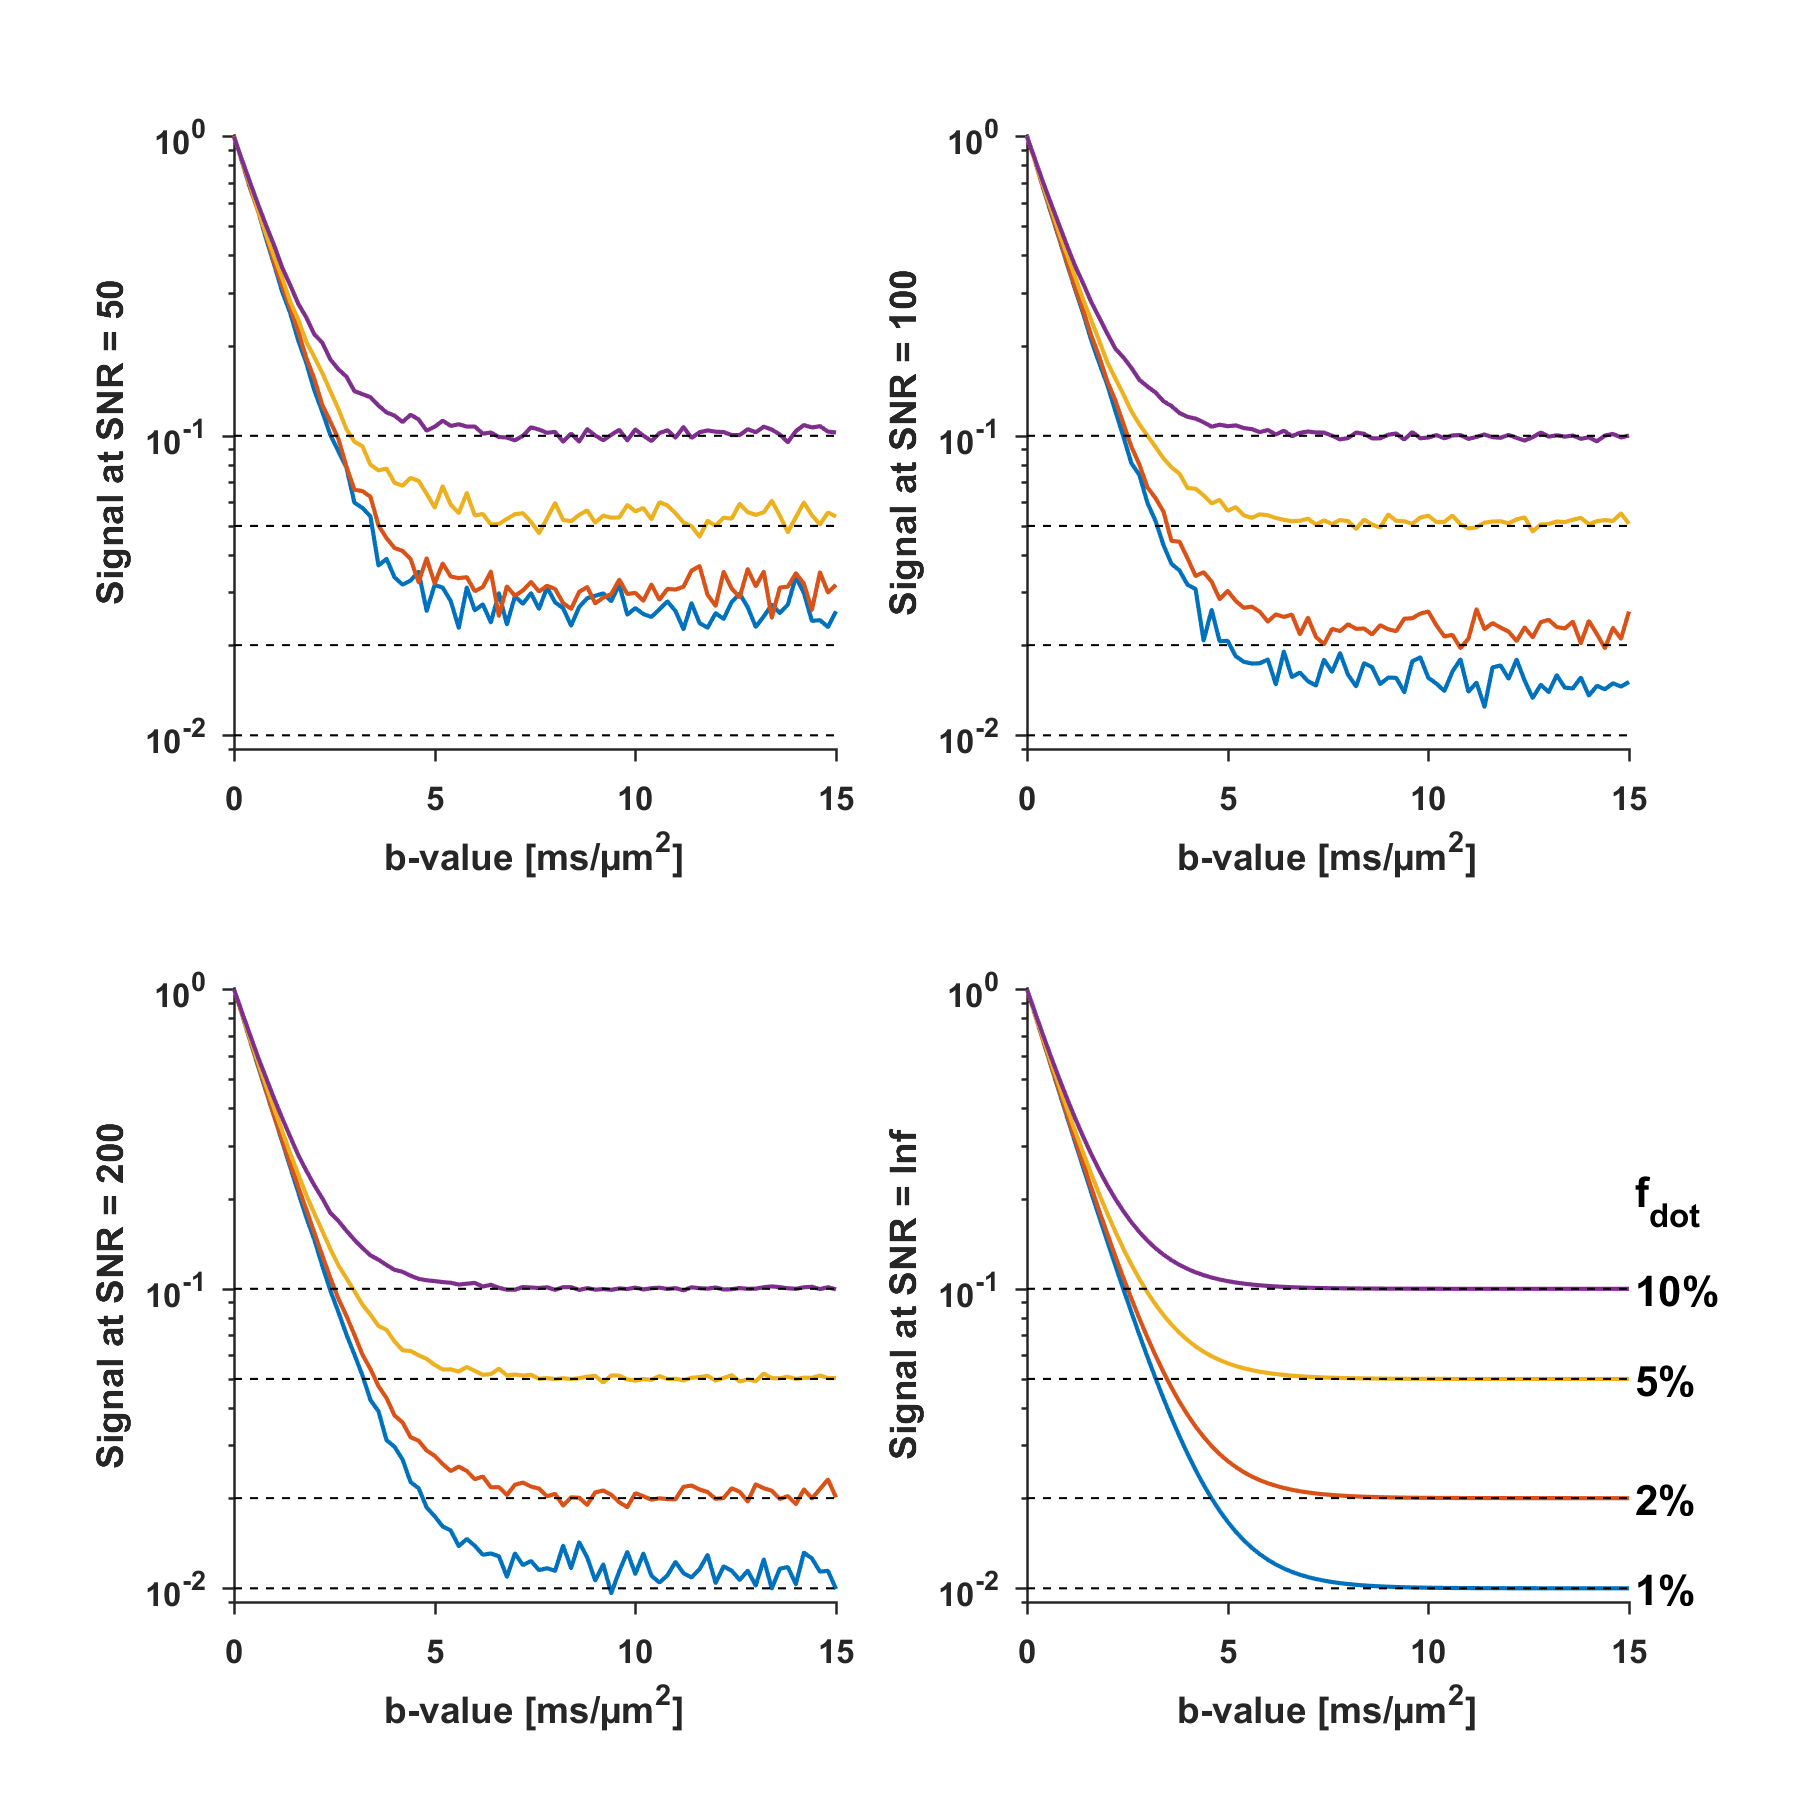
The signal arising from each compartment represented by diffusion tensor $$$\mathbf{D}$$$ probed by b-tensor $$$\mathbf{B}$$$ can be described by $$$f\cdot\exp(\mathbf{B:D})$$$, which in the specific case of STE and two non-exchanging compartments (one dot-compartment) simplifies to
$$S(b)=f_{\text{dot}}\cdot\exp(−bD_{\text{dot}})+(1−f_{\text{dot}}){\cdot}\exp(−bD_{\text{iso}})=f_{\text{dot}}+(1−f_{\text{dot}}){\cdot}\exp(−bD_{\text{iso}}).$$
For infinite SNR, the $$$S(0)$$$-normalised signal at the plateau equals the dot signal fraction $$$(f_{\text{dot}}=S_{\text{plateau}}/S(0))$$$. Fig.1 shows the simulated signal in the case of two non-exchanging compartments with isotropic diffusivities of 1 and 0 µm2/ms. In the absence of a plateau, the normalised signal at $$$b_{\text{max}}$$$ can serve as an upper limit of $$$f_{\text{dot}}$$$, because $$$f_{\text{dot}}≤S_{b_{\text{max}}}/S(0)$$$. The accuracy is limited by the presence of the noise floor but still yields an upper-limit of $$$f_{\text{dot}}$$$, at least in the absence of exchange.
Methods
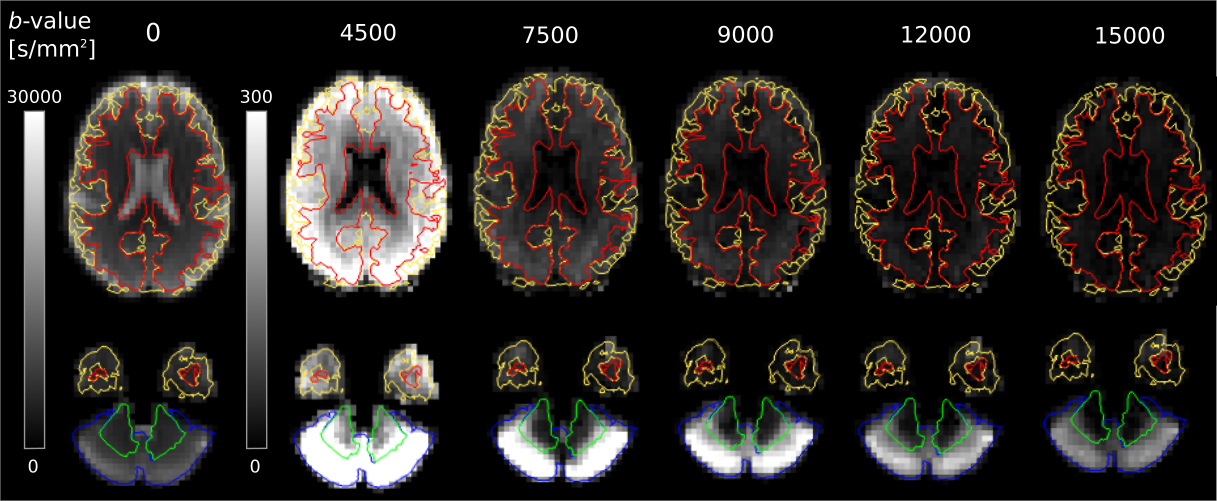
Data: A healthy volunteer was scanned on a 3T, 300mT/m Siemens Connectom using a prototype spin-echo sequence that enables arbitrary b-tensor encoding. We used b-values=[0,250,1500,3000,...,15000]s/mm2 repeated [1,6,9,12,...,36] times, respectively. No in-plane acceleration was used, voxel size=4.4×4.4×6 mm3, matrix=64×64, 26 slices, TR/TE=5000/90ms, partial-Fourier=6/8, bandwidth=1594Hz/pix. Maxwell-compensated waveforms11 were optimized numerically12, and yielded a diffusion time of approximately 20ms. This approach renders superior encoding efficiency compared to standard 1-scan-trace imaging (requires TE=270ms for b=15000s/mm2). An MPRAGE was acquired for brain segmentation.
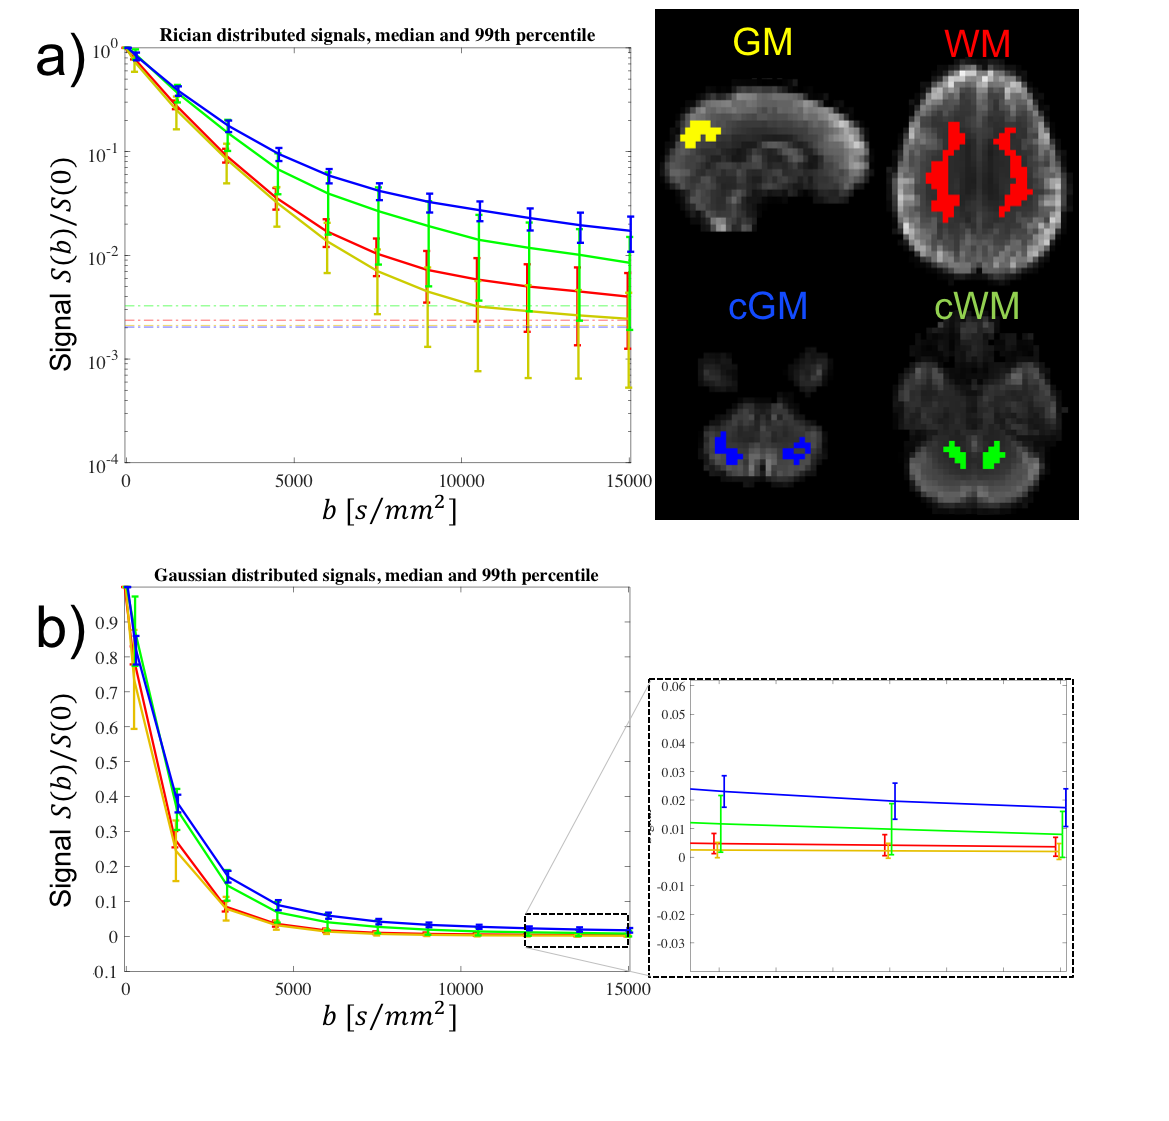
Processing: To investigate whether a potential plateau arising in the signal decay was not solely an effect of the noise floor, the data was corrected for Rician bias13-15. Masks for different tissue types were created in Freesurfer based on the MPRAGE registered to the susceptibility-distortion corrected16 dMRI data, and used to guide the definition four regions for further analysis: cerebral white and gray matter (WM and GM), and cerebellar white and gray matter (cWM and cGM).
Results
Fig.2 shows that the signal in most of the cerebral tissue was reduced to the noise floor at $$$b$$$>9000 s/mm2. However, cGM was observed to have a remarkably high signal at high b-values, remaining well above the noise floor even at b=15000 s/mm2, unlike any other tissue.
Fig.3 shows that the signal-verus-b curve in cGM was markedly non-monoexponential, with signal values above the noise floor for all sampled b-values. However, no plateau is found at b=15000s/mm2. In the absence of exchange, the estimated upper-bound of $$$f_{\text{dot}}$$$ in WM, GM, cWM and cGM is approximately 0.5%,0.5%,1% and 2%, respectively.
Discussion & Conclusion
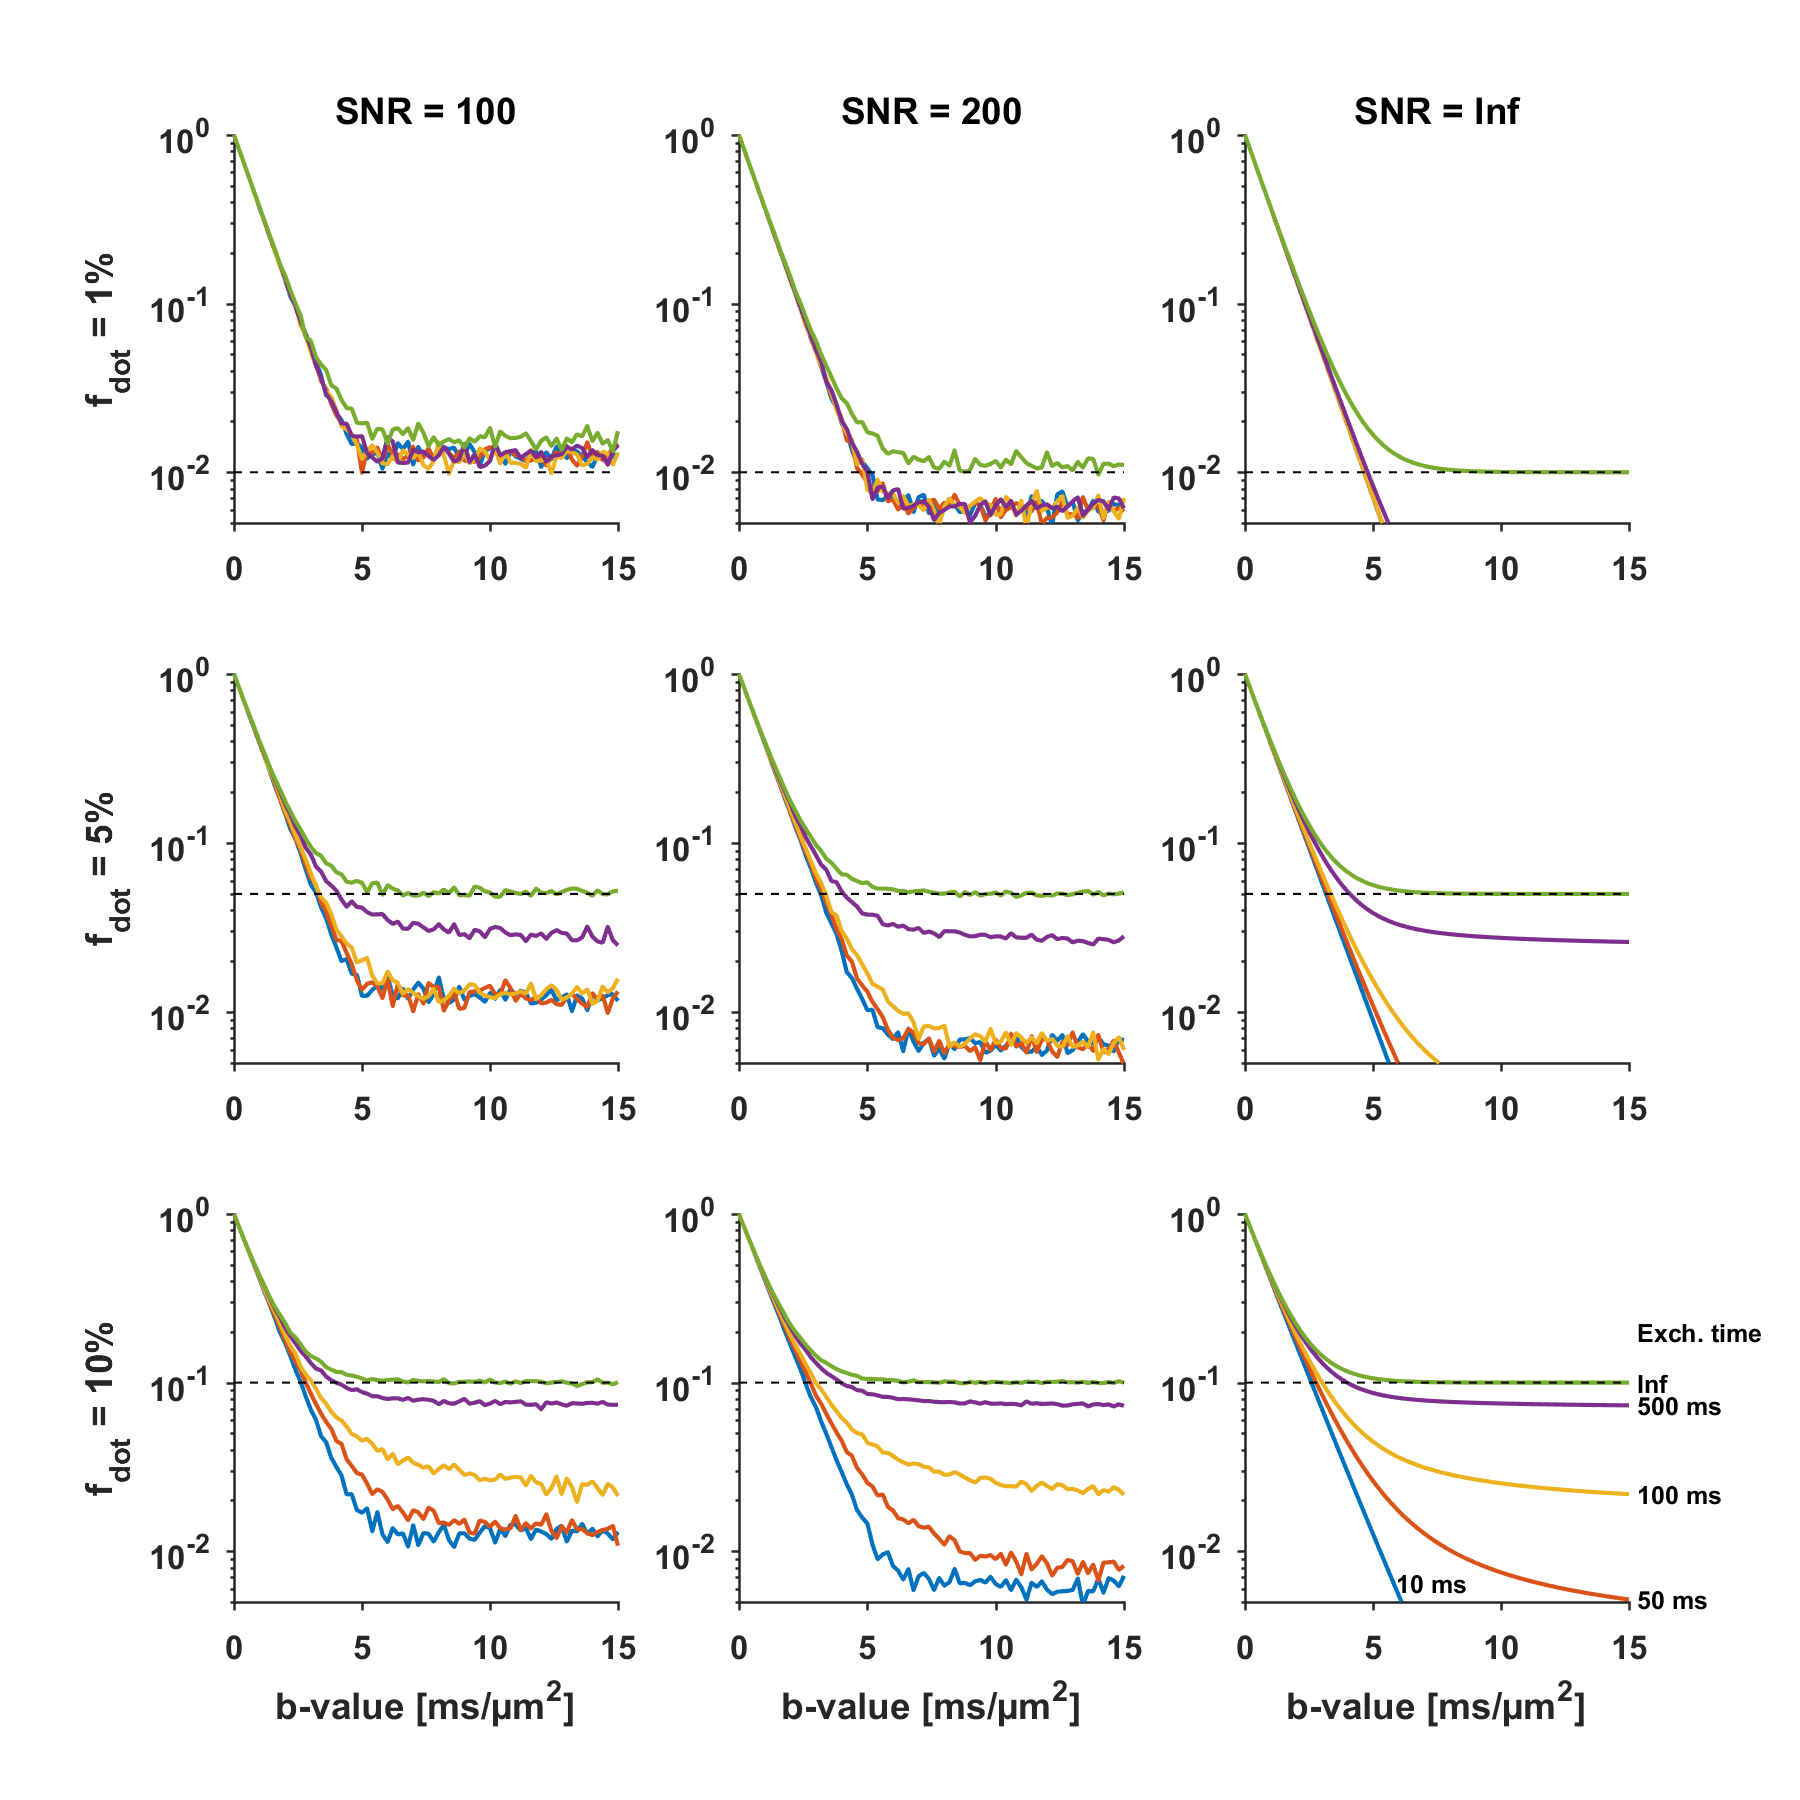
In the cerebrum, we did not find evidence of a large dot-fraction. In the cerebellum, however, the non-negligible signal at very high b-values points to the existence of a dot-like compartment. The absence of a signal plateau could be caused by compartments with low but non-zero isotropic diffusivity, or a true dot-compartment with zero diffusivity but non-negligible exchange. The effect of exchange17,18 is simulated in Fig.4, and can result in an underestimation of $$$f_{\text{dot}}$$$.
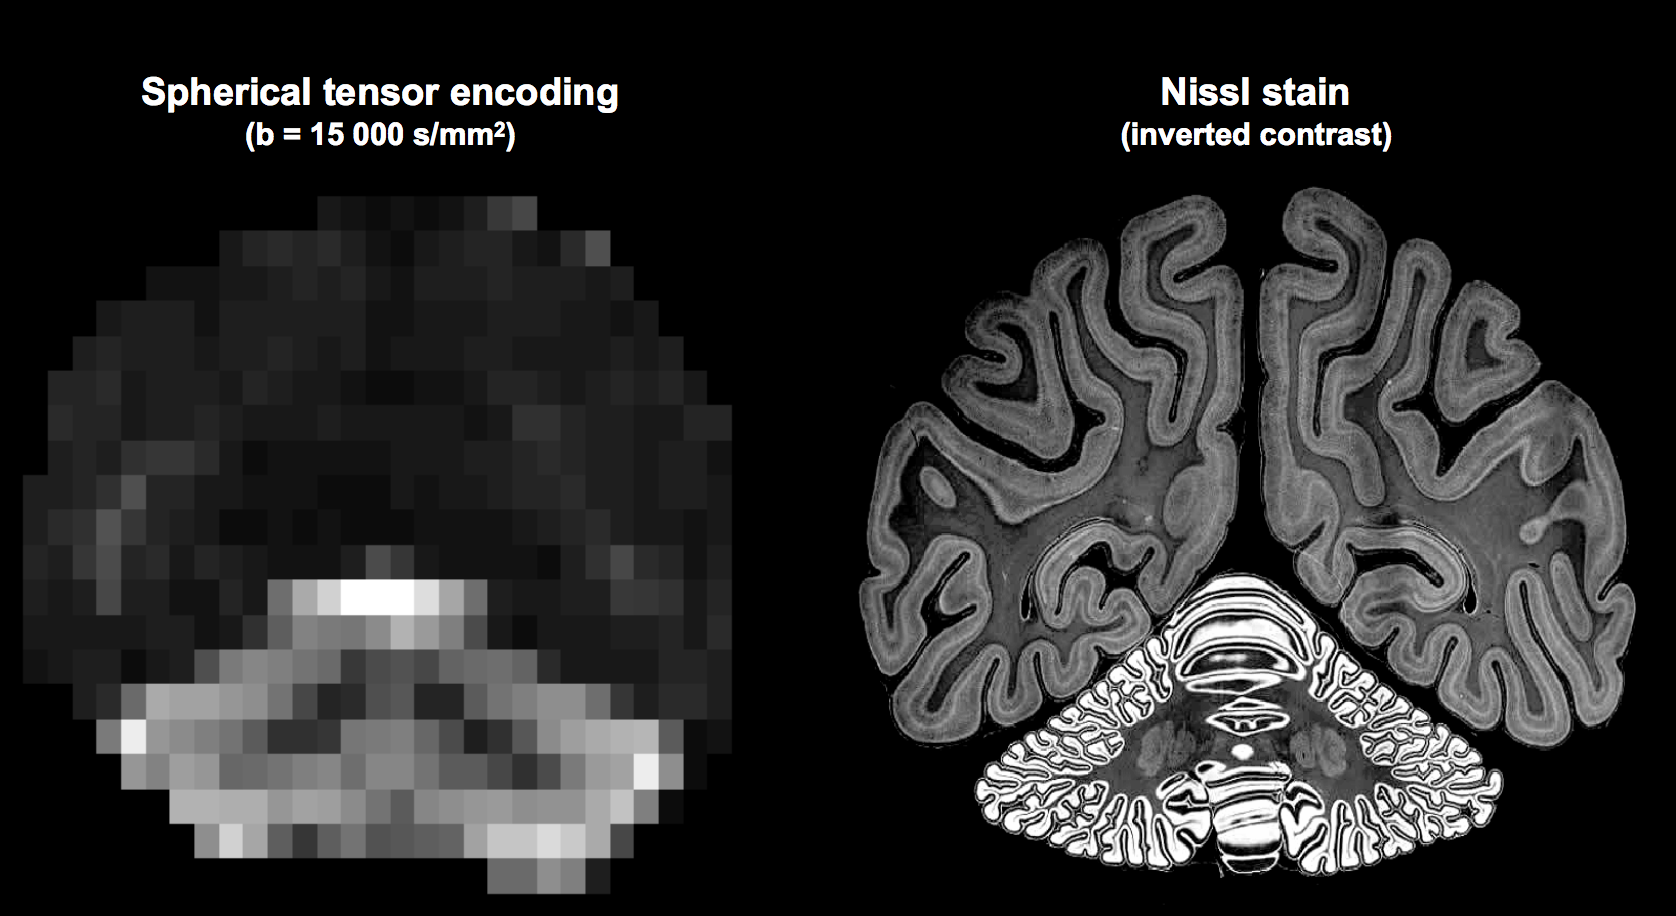
Regardless of model assumptions, the high signal retention at high b-values in the cerebellum demonstrates that its microstructure is remarkably different compared to the cerebrum. We speculate that this may originate from granule and/or Purkinje cells, that have a morphology consistent with this finding (Fig.5). If so, STE at extremely high b-values can become a very specific biomarker for better understanding of diseases such as autism spectrum disorders19, spinocerebellar ataxia20, and Alzheimer disease21,22, where such cells are affected.
Acknowledgements
We thank Siemens Healthcare for access to the pulse sequence programming environment, and Fabrizio Fasano from Siemens Healthcare for support. We thank Umesh Rudrapatna for technical support and feedback and Samuel St-Jean for useful discussions. The work was supported by a Wellcome Trust Investigator Award (096646/Z/11/Z) and a Wellcome Trust Strategic Award (104943/Z/14/Z). The data were acquired at the UK National Facility for In Vivo MR Imaging of Human Tissue Microstructure funded by the EPSRC (grant EP/M029778/1), and The Wolfson Foundation. CMWT is supported by a Rubicon grant (680-50-1527) from the Netherlands Organisation for Scientific Research (NWO) and Wellcome Trust grant (096646/Z/11/Z).References
[1] Stanisz GJ, Szafer A, Wright GA, Henkelman M. An analytical model of restricted diffusion in bovine optic nerve. Magn Reson Med. 1997;37:103–111
[2] Alexander, D.C., Hubbard, P.L., Hall, M.G., Moore, E.A., Ptito, M., Parker, G.J.M., Dyrby, T.B., 2010. Orientationally invariant indices of axon diameter and density from diffusion MRI. Neuroimage 52, 1374–1389.
[3] Panagiotaki, E., Schneider, T., Siow, B., Hall, M. G., Lythgoe, M. F., & Alexander, D. C., 2012. Compartment models of the diffusion MR signal in brain white matter: a taxonomy and comparison. Neuroimage, 59(3), 2241-2254.
[4] Ferizi U, Schneider T, Panagiotaki E, Nedjati-Gilani G, Zhang H, Wheeler-Kingshott CA, Alexander DC., 2014. A ranking of diffusion MRI compartment models with in vivo human brain data. Magn Reson Med. 72(6):1785-92
[5] Ferizi U, Schneider T, Witzel T, Wald LL, Zhang H, Wheeler-Kingshott CA, Alexander DC., 2015. White matter compartment models for in vivo diffusion MRI at 300mT/m. Neuroimage 118:468-83.
[6] Veraart J, Fieremans E, Novikov DS, Universal power-law scaling of water diffusion in human brain defines what we see with MRI. arXiv:1609.09145
[7] Eriksson, S., Lasič, S. & Topgaard, D. 2013. Isotropic diffusion weighting in PGSE NMR by magic-angle spinning of the q-vector. Journal of Magnetic Resonance, 226, 13-8.
[8] Lasič, S., Szczepankiewicz, F., Eriksson, S., Nilsson, M. & Topgaard, D. 2014. Microanisotropy imaging: quantification of microscopic diffusion anisotropy and orientational order parameter by diffusion MRI with magic-angle spinning of the q-vector. Frontiers in Physics, 2, 11.
[9] Westin, C. F., Knutsson, H., Pasternak, O., Szczepankiewicz, F., Özarslan, E., Van Westen, D., Mattisson, C., Bogren, M., O'donnell, L. J., Kubicki, M., Topgaard, D. & Nilsson, M. 2016. Q-space trajectory imaging for multidimensional diffusion MRI of the human brain. Neuroimage, 135, 345-62.
[10] Dhital, B., Kellner, E., Reisert, M., Kiselev, V.G. 2015. Isotropic Diffusion Weighting Provides Insight on Diffusion Compartments in Human Brain White Matter In vivo. ISMRM 2788
[11] Szczepankiewicz, F. & Nilsson, M. 2018, Maxwell-compensated waveform design for asymmetric diffusion encoding. Submitted to Proc. Intl. Soc. Mag. Reson. Med.
[12] Sjölund, J., Szczepankiewicz, F., Nilsson, M., Topgaard, D., Westin, C. F. & Knutsson, H. 2015. Constrained optimization of gradient waveforms for generalized diffusion encoding. Journal of Magnetic Resonance, 261, 157-168.
[13] Veraart, J., Novikov, D. S., Christiaens, D., Ades-Aron, B., Sijbers, J., & Fieremans, E. 2016. Denoising of diffusion MRI using random matrix theory. NeuroImage, 142, 394-406.
[14] Koay, C. G., Özarslan, E., & Basser, P. J. 2009. A signal transformational framework for breaking the noise floor and its applications in MRI. Journal of magnetic resonance, 197(2), 108-119.
[15] St-Jean, S., Coupé, P., & Descoteaux, M. 2016. Non Local Spatial and Angular Matching: Enabling higher spatial resolution diffusion MRI datasets through adaptive denoising. Medical image analysis, 32, 115-130.
[16] Andersson, J. L., Skare, S., & Ashburner, J. 2003. How to correct susceptibility distortions in spin-echo echo-planar images: application to diffusion tensor imaging. Neuroimage, 20(2), 870-888.
[17] Kärger, J., Der einfluß der zweibereichdiffusion auf die spinechodämpfung unter berücksichtigung der relaxation bei messungen mit der methode der gepulsten feldgradienten, Anna Physik 482 (1) (1971) 107–109.
[18] Nilsson, M., Alerstam, E., Wirestam, R., Stahlberg, F., Brockstedt, S. & Latt, J. 2010. Evaluating the accuracy and precision of a two-compartment Karger model using Monte Carlo simulations. Journal of Magnetic Resonance, 206, 59-67.
[19] Chrobak, A. A., & Soltys, Z. (2017). Bergmann Glia, Long-Term Depression, and Autism Spectrum Disorder. Molecular Neurobiology, 54(2), 1156–1166. http://doi.org/10.1007/s12035-016-9719-3
[20] Xia, G., McFarland, K. N., Wang, K., Sarkar, P. S., Yachnis, A. T., & Ashizawa, T. (2013). Purkinje Cell Loss is the Major Brain Pathology of Spinocerebellar Ataxia Type 10. Journal of Neurology, Neurosurgery, and Psychiatry, 84(12), 1409–1411. http://doi.org/10.1136/jnnp-2013-305080
Figures