0252
Breaking the power law scaling of the dMRI signal on the Connectom scanner reveals its sensitivity to axon diameters1Center for Biomedical Imaging, NYU School of Medicine, New York, NY, United States, 2CUBRIC, Cardiff University, Cardiff, United Kingdom
Synopsis
We demonstrate that in vivo diffusion MRI becomes sensitive to intra-axonal properties such as the inner axon diameters, when diffusion weightings in the range $$$b\sim7,000-25000\,\mathrm{s/mm^2}$$$ are achieved on the Human Connectom scanner (using gradients of 300mT/m). By analyzing the diffusion-weighted signal in the human white matter as a function of $$$b$$$, we observe significant deviations from the $$$b^{-1/2}$$$ scaling associated with the conventional “stick” model of infinitely-narrow axons. Our estimated effective MR diameters, heavily weighted by the tail of the axon diameter distribution, agree well with those calculated from histology histograms available from literature.
Introduction
We address the longstanding1,2 and highly debated question3,4,5 whether, and under which conditions6,7, it is possible to measure human axon diameters in vivo. We evaluate the deviations from the power law scaling8,9 of the diffusion-weighted signal as a function of the $$$b$$$-value on the Siemens Connectom scanner. We eliminate confounding effects of dispersion10 and extra-axonal diffusion5, respectively, by applying spherical averaging, and by restricting our analysis to a minimally explored $$$b$$$-regime, that is, $$$b\,=\,7000$$$ up to $$$b\,=\,25000\,\mathrm{s/mm^2}$$$.Methods
Data: Four volunteers were scanned on a Siemens Connectom 3T MR scanner with maximal gradient amplitude $$$G_\mathrm{max}=289\,\mathrm{mT/m}$$$. Diffusion gradients with $$$\Delta/\delta\,=\,30/13\,\mathrm{ms}$$$) were applied along 60 orientations for a spectrum of $$$b$$$-values up to $$$25\,\mathrm{ms/\mu\,m^2}$$$. The following parameters were kept constant: $$$\mathrm{TR/TE}\,=3500/62\,\mathrm{ms}$$$ and resolution $$$3\,\times\,3\times\,3\,\mathrm{mm}^3$$$. Additionally, we scanned 8 volunteers with the same spatial resolution on a Siemens Prisma 3T scanner with the following parameters: $$$\Delta/\delta\,=\,51/35\,\mathrm{ms},\,G_\mathrm{max}=80\,\mathrm{mT/m},\,\mathrm{TR/TE}\,=4000/105\,\mathrm{ms}$$$, and maximal $$$b=10\,\mathrm{ms/\mu\,m^2}$$$. Data were denoised11 and Gibbs12, eddy current13, and Rician bias14 corrected. The signal was averaged per $$$b$$$-shell to cancel the impact of the axonal orientation distribution function.
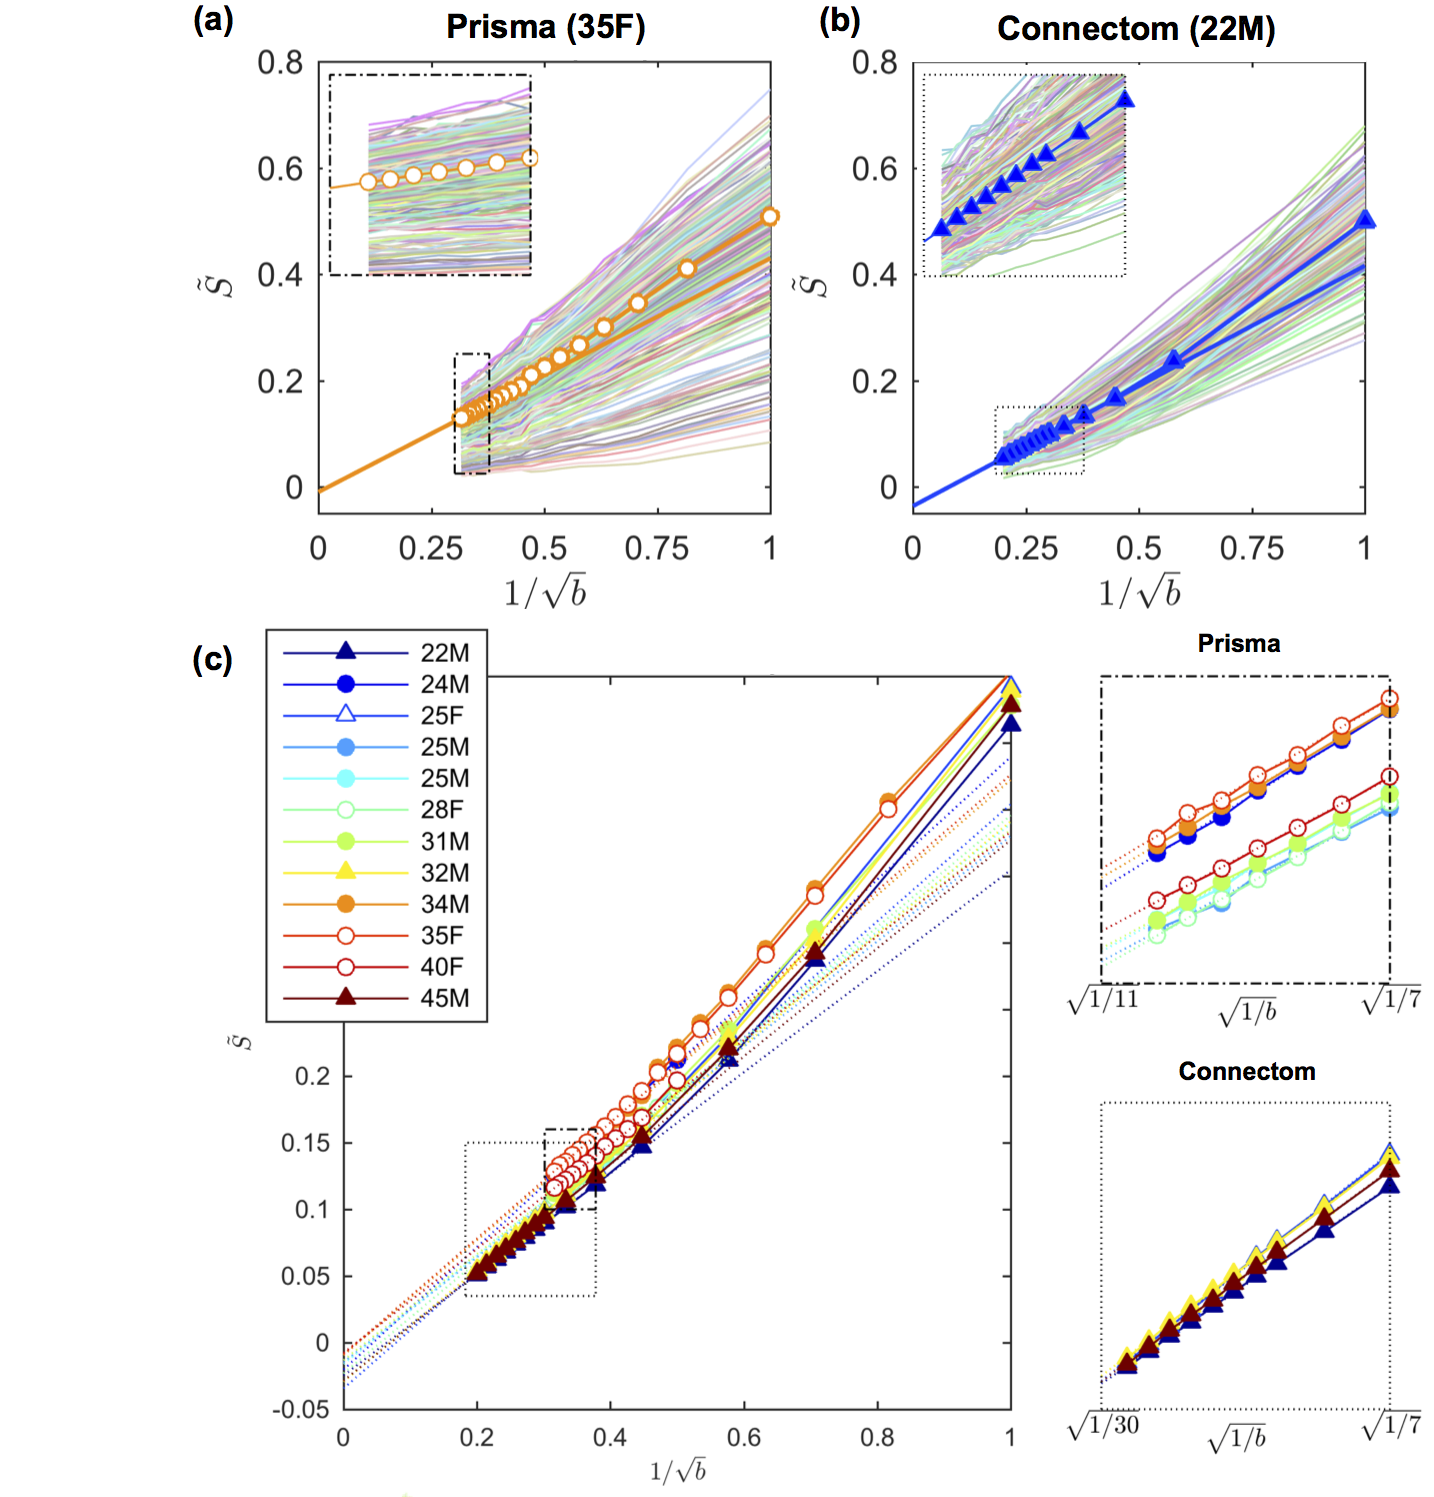
Power law scaling: In most biophysical models of diffusion in white matter, axons (and possibly glial cell processes) are represented by zero-radius, impermeable “sticks” inside which diffusion is one-dimensional, i.e., radial intra-axonal diffusivity $$$D_a^\perp\,\equiv\,0$$$15,16. The stick model yields a signal decay that scales according to a power law8,9 with exponent $$$\alpha=\,1/2$$$ as a function of $$$b$$$: $$\tilde{S}(b)\,=\,\beta\,b^{-\alpha}+\epsilon.$$ we restrict our analysis to $$$b\geq7\,\mathrm{ms/\mu\,m^2}$$$ because the decay only holds in the absence of any exponentially fast decaying extra-axonal signal. Any sensitivity of MR to a finite axon radius would break the $$$b^{-1/2}$$$-scaling. Indeed, a finite $$$D_a^\perp$$$ results in an intra-axonal signal decay $$$\sim\,e^{-bD_a^\perp\,+\,O(b^2)}\,b^{-1/2}$$$, i.e. a truncated power law. Only when $$$D_a^\perp=0$$$, the intercept $$$\epsilon$$$ equals an immobile water signal fraction $$$\gamma>0$$$.
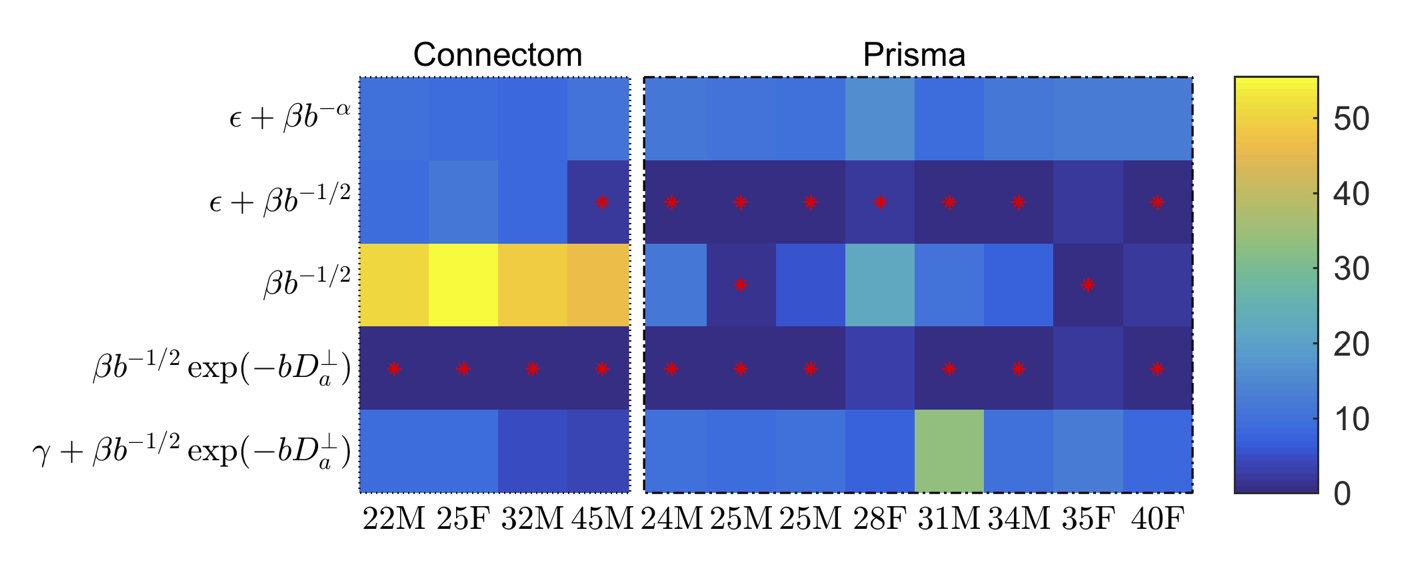
Sensitivity to axon diameters: Cramér–Rao lower bound17 (CLRB) analysis was performed to assess when $$$D_a^\perp$$$ can be measured with statistical significance. Model selection was performed on the experimental data using the corrected Akaike Information Criterion (AICc)18. The effect of the inclusion of $$$D_a^\perp$$$ or an immobile volume fraction $$$\gamma$$$ is studied via the goodness-of-fit in comparison to the power law that excludes any sensitivity to axon radii.
Quantifying axon diameters:
The axon diameter can be derived from $$$D_a^\perp$$$ by applying a
model of restricted diffusion inside a cylinder19 while accounting for the scan
timings. In each voxel, the unknown axon radius distribution $$$P(r)$$$ is
mapped onto a single scalar, the effective MR radius $$$r_\textrm{eff}$$$. When
accounting for volume correction2 ($$$\sim\,r^2$$$) and Van Gelderen’s model19
($$$\sim\,r^4$$$), the $$$r_\textrm{eff}$$$ relates to $$$P(r)$$$ as
follows5:
$$r_\textrm{eff}\equiv\sqrt[4]{\langle\,r^6\,\rangle\,/\,\langle\,r^2\,\rangle}.$$
Results
A visual assessment of the signal decays in all WM voxels at first seems to confirm the power law scaling, i.e. a linear scaling of the signal as function of $$$1/\sqrt{b}$$$ (Fig. 1). However, the negative intercept $$$\epsilon$$$ indicates that it cannot signify an immobile water fraction and that a finite $$$D_a^\perp>0$$$ might cause the negative intercept.
AICc analysis suggests that adding $$$D_a^\perp$$$ to the stick model does not improve the fit quality for the Prisma data (Fig. 2). However, a truncated power law that explicitly accounts for $$$D_a^\perp>0$$$ provide a significantly improved fit to the Connectom data. Adding an intercept $$$\gamma$$$ (an immobile volume fraction) does not improve the fit quality.
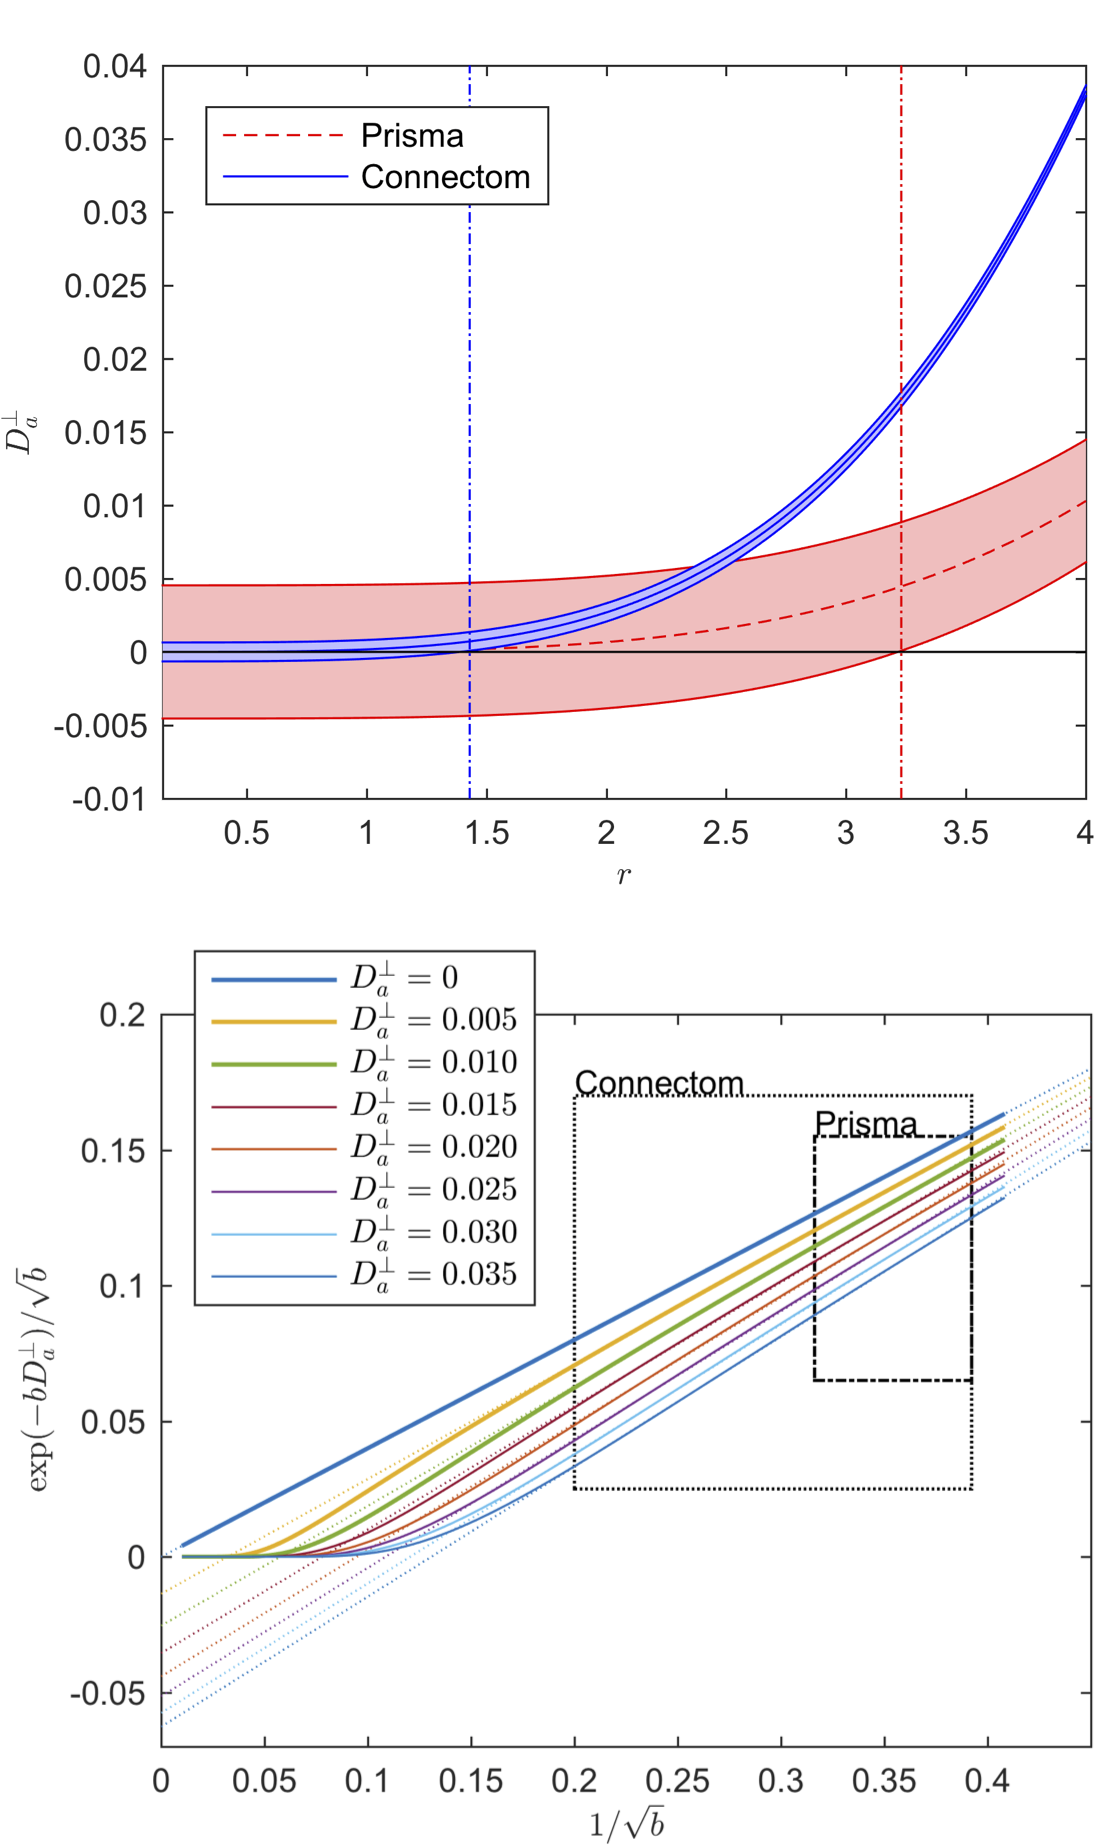
The results of the CRLB analysis in Fig. 3 show that a strongly reduced $$$\delta$$$, enabled on the Connectom scanner, allows the detection of $$$D_a^\perp$$$ for $$$r>1.41\mathrm{\mu\,m}$$$, whereas on the Prisma scanner this lower bound is $$$3.24\mathrm{\mu\,m}$$$. The deviation from the power law scaling might not be visible within our $$$b$$$-ranges, yet a small $$$D_a^\perp$$$ results in a negative intercept when fitting the power law to the data, cf. Fig. 1.
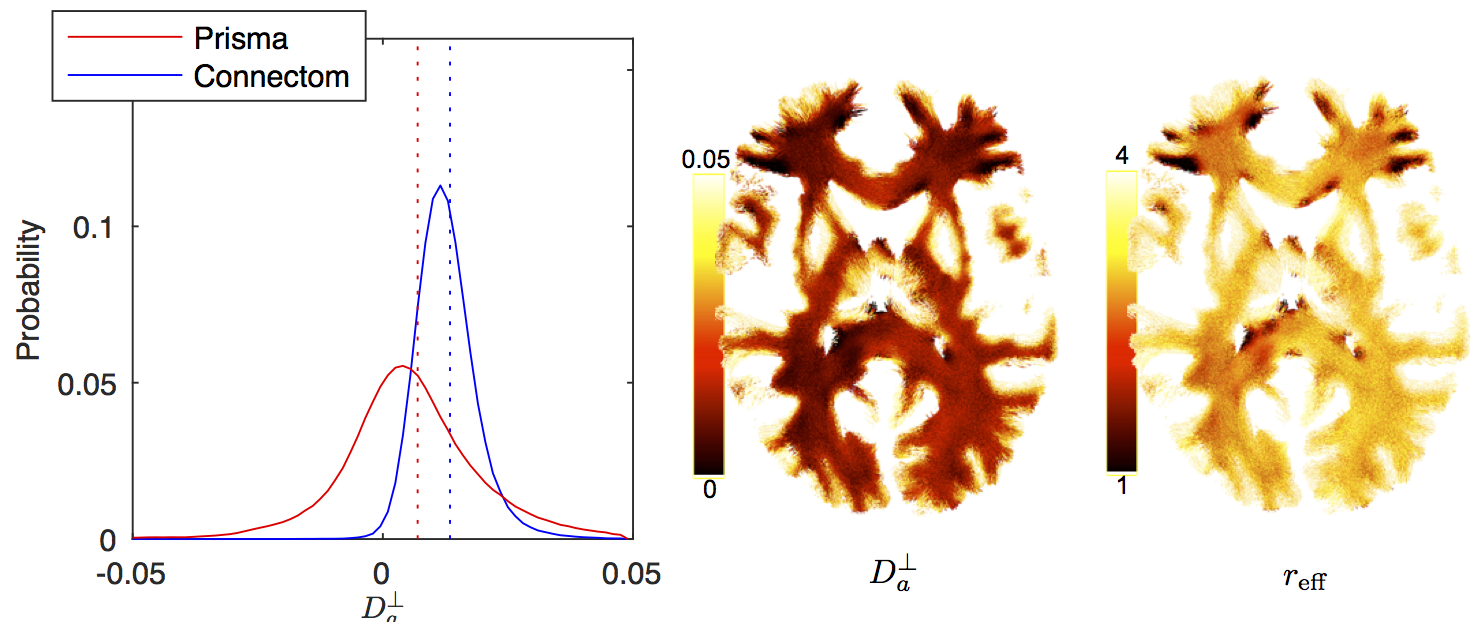
The distribution of $$$D_a^\perp$$$ for WM voxels from all subjects, estimated using $$$S\simeq\beta\,e^{-bD_a^\perp}\,b^{-1/2}$$$ is shown for both scanners (Fig. 4). The estimated $$$D_a^\perp$$$ is biophysically meaningful for the majority of all WM voxels for the Connectom data, whereas the Prisma data results in biophysically implausible $$$D_a^\perp<0$$$-values in approximately $$$35\,\%$$$ of all WM voxels.
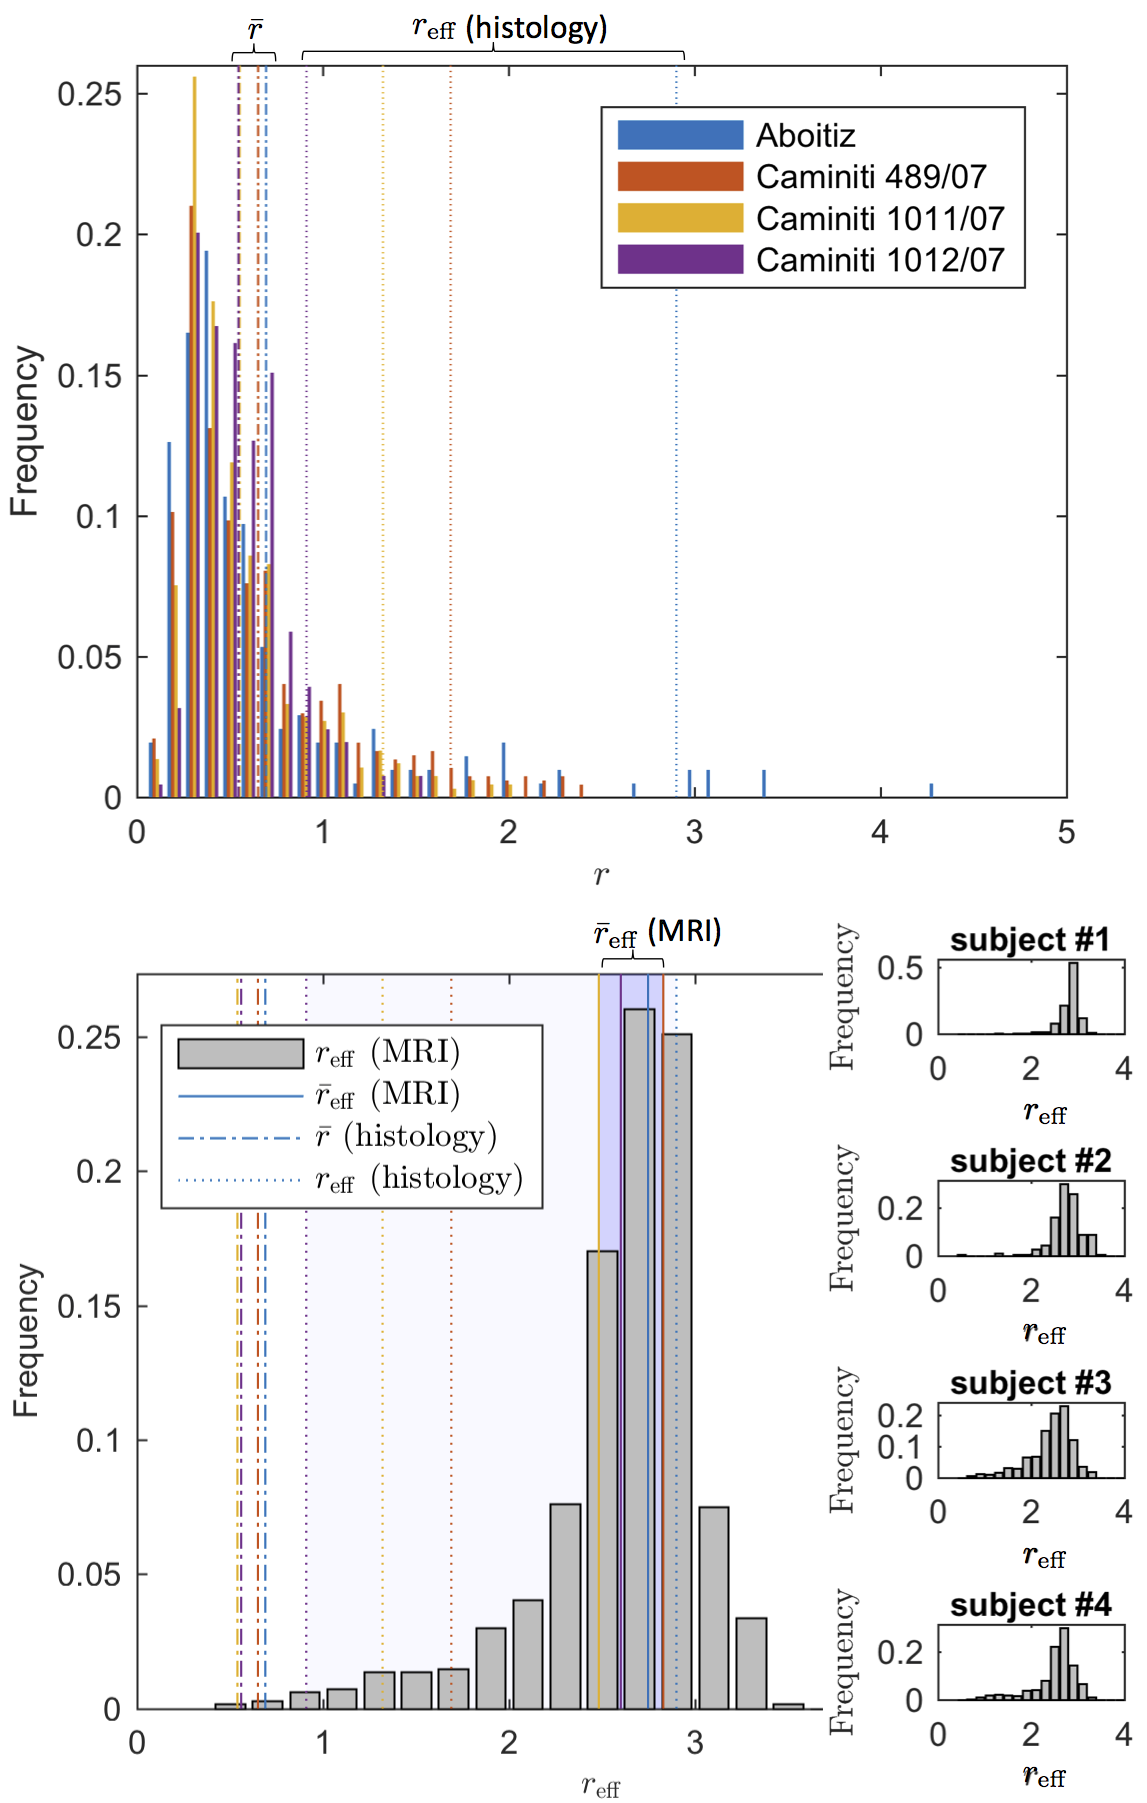
The distribution $$$r_\textrm{eff}$$$ derived from
$$$D_a^\perp$$$ using VanGelderen’s model, falls in the
$$$r_\textrm{eff}$$$-range that corresponds to axon radii distribution reported
in the literature20,21 (Fig. 5).
Discussion and Conclusion
The observation of deviations from the power law scaling at extreme diffusion weightings (and short gradient pulses), enabled by gradients ~300mT/m, establishes dMRI as an in vivo instrument sensitive to the inner-axon diameters.
We demonstrated that in vivo dMRI can estimate effective
axon radii, that is, in a agreement with reported20,21 histological values, if
we account for the disproportional sensitivity of dMRI to the largest axons,
while the shape of the axon radius distribution and its statistics, e.g. mean
or variance, remains unresolvable.
Acknowledgements
JV is a Postdoctoral Fellow of the Research Foundation - Flanders (FWO; grant number 12S1615N). EF and DSN were supported by the NIH/NINDS award R01NS088040. The data were partially acquired at the UK National Facility for In Vivo MR Imaging of Human Tissue Microstructure funded by the EPSRC (grant EP/M029778/1), and The Wolfson Foundation. DKJ is supported by a Wellcome Trust Investigator Award (096646/Z/11/Z) and a Wellcome Trust Strategic Award (104943/Z/14/Z).
References
- Y. Assaf, T. Blumenfeld‐Katzir, Y. Yovel, and P.J. Basser. "AxCaliber: a method for measuring axon diameter distribution from diffusion MRI." Magnetic resonance in medicine 59(6), 1347-1354 (2007).
- D. C. Alexander, P. L. Hubbard, M. G. Hall, E. A. Moore, M. Ptito, G. J. Parker, and T. B. Dyrby, “Orientationally invariant indices of axon diameter and density from diffusion MRI,” Neuroimage 52, 1374–1389 (2010).
- A. Horowitz, D. Barazany, I. Tavor, M. Bernstein, G. Yovel, and Y. Assaf, “In vivo correlation between axon diameter and conduction velocity in the human brain,” Brain Structure and Function 220, 1777–1788 (2015).
- G. Innocenti, R. Caminiti, and F. Aboitiz, “Comments on the paper by Horowitz et al.(2014),” Brain structure and function 220, 1789– 1790 (2015).
- L. M. Burcaw, E. Fieremans, and D. S. Novikov, “Mesoscopic structure of neuronal tracts from time-dependent diffusion,” NeuroImage 114, 18–37 (2015).
- T.B. Dyrby TB, L.V. Sogaard, M.G. Hall, M. Ptito, D.C. Alexander. Contrast and stability of the axon diameter index from microstructure imaging with diffusion MRI. Magnetic Resonance in Medicine 70(3), 711-721 (2013).
- S.Y. Huang, A. Nummenmaa, T. Witzel, et al. The impact of gradient strength on in vivo diffusion MRI estimates of axon diameter. NeuroImage 106, 464-472 (2015).
- J. Veraart, E. Fieremans, D.S. Novikov , Universal power-law scalingof water diffusion in human brain defines what we see with MRI. arXiv:1609.09145 (2016).
- E. T. McKinnon, J. H. Jensen, G. R. Glenn, and J. A. Helpern, “Dependence on b-value of the direction-averaged diffusion-weighted imaging signal in brain,” Magnetic resonance imaging 36, 121–127 (2017).
- I. Drobnjak, H. Zhang, A. Ianus, E. Kaden and D.C. Alexander. PGSE, OGSE, and sensitivity to axon diameter in diffusion MRI: insight from a simulation study. Magnetic resonance in medicine 75(2), 688-700 (2016).
- J. Veraart, D.S. Novikov, D. Christiaens, B. Ades-Aron, J. Sijbers, and E. Fieremans, Denoising of diffusion MRI using random matrix theory. NeuroImage, 142, 394-406 (2016).
- E. Kellner, B. Dhital, V. G. Kiselev, and M. Reisert, “Gibbs-ringing artifact removal based on local subvoxel-shifts,” Magnetic resonance in medicine 76, 1574–1581 (2016).
- J. L. Andersson and S. N. Sotiropoulos, “An integrated approach to correction for off-resonance effects and subject movement in diffu-sion MR imaging,” Neuroimage 125, 1063–1078 (2016).
- C. G. Koay and P. J. Basser, “Analytically exact correction scheme for signal extraction from noisy magnitude MR signals,” Journal of Magnetic Resonance 179, 317–322 (2006).
- C. D. Kroenke, J. J. Ackerman, and D. A. Yablonskiy, “On the nature of the NAA diffusion attenuated MR signal in the central nervous system,” Magnetic resonance in medicine 52, 1052–1059 (2004).
- S.N. Jespersen, C.D. Kroenke, L. Østergaard, J.J.H. Ackerman, D.A. Yablonskiy, Modeling dendrite density from magnetic resonance diffusion measurements, NeuroImage 34(4), 1473-1486 (2007).
- S. M. Kay, Fundamentals of statistical signal processing (Prentice Hall PTR, 1993).
- K. P. Burnham and D. R. Anderson, “Information and Likelihood Theory: A Basis for Model Selection and Inference,” in Model Selection and Multimodel Inference (Springer New York, 2002) pp. 49–97.
- P. van Gelderen, D. DesPres, P. van Zijl, and C. Moonen, “Evaluation of restricted diffusion in cylinders. phosphocreatine in rabbit leg muscle,” Journal of Magnetic Resonance, Series B 103, 255–260 (1994).
- F. Aboitiz, A. B. Scheibel, R. S. Fisher, and E. Zaidel, “Fiber com- position of the human corpus callosum,” Brain research 598, 143– 153 (1992).
- R. Caminiti, H. Ghaziri, R. Galuske, P. R. Hof, and G. M. Innocenti, “Evolution amplified processing with temporally dispersed slow neuronal connectivity in primates,” Proceedings of the National Academy of Sciences 106, 19551–19556 (2009).
Figures