0249
Assessing MR image reconstruction quality using the Fourier Radial Error Spectrum plot1Electrical Engineering, University of Southern California, Los Angeles, CA, United States
Synopsis
This work introduces the Fourier radial error spectrum plot (ESP) as a novel approach to quantifying the quality of reconstructed MR images. While conventional error metrics such as normalized root mean squared error (NRMSE) or structural similarity (SSIM) are widely used, they are simple scalar-measures that only provide one-dimensional insight into image quality. In contrast, ESP describes reconstruction quality with a spectrum that provides a quantitative evaluation of image quality at every spatial resolution scale. Our results show that ESP provides more comprehensive information than conventional error metrics, and can guide the design of new and improved image reconstruction approaches.
Introduction
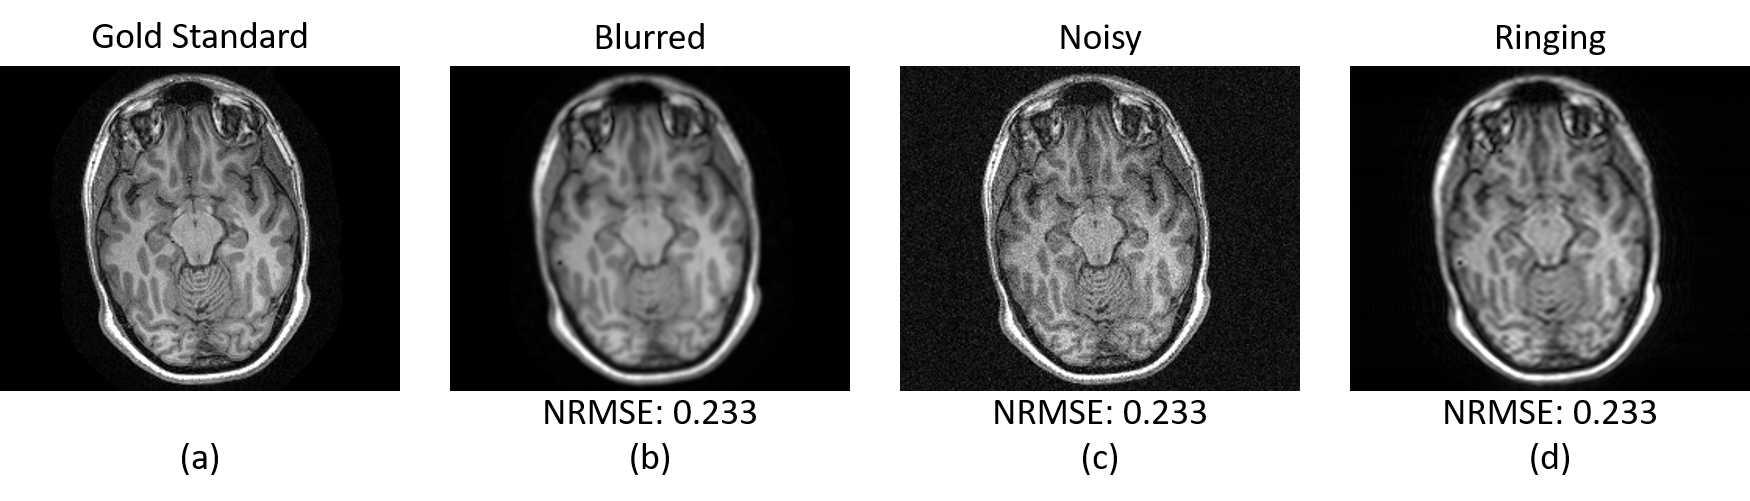
In the MRI reconstruction literature, the performance of an image reconstruction method is often evaluated using scalar-valued quantitative error metrics. Conventional measures include the normalized root mean squared error (NRMSE) [1], structural similarity index (SSIM) [2], and the high frequency error norm (HFEN) [3]. These measures provide valuable insight, but cannot provide comprehensive insight into image quality because substantial information loss is inevitable when a multi-dimensional error image is reduced to a single real number. A simple example (inspired by [1,2]) is illustrated in Fig. 1, where we demonstrate that images with the same NRMSE can have very different characteristics.
To overcome such drawbacks, we propose a novel error metric, the Fourier radial error spectrum plot (ESP), to provide more comprehensive and nuanced information about different aspects of image quality. ESP is inspired by Fourier ring correlation (FRC) [4,5] and Fourier sphere correlation (FSC) [6] from the electron microscopy literature, which subdivide the Fourier domain into rings (in 2D) or spheres (in 3D), and then evaluate signal statistics independently for each ring. These statistical characteristics can then be plotted as a function of spatial frequency to provide insight into the statistical properties of reconstructed images at different resolution scales. However, the goal of FRC and FSC is not to quantify error with respect to a gold standard reference.
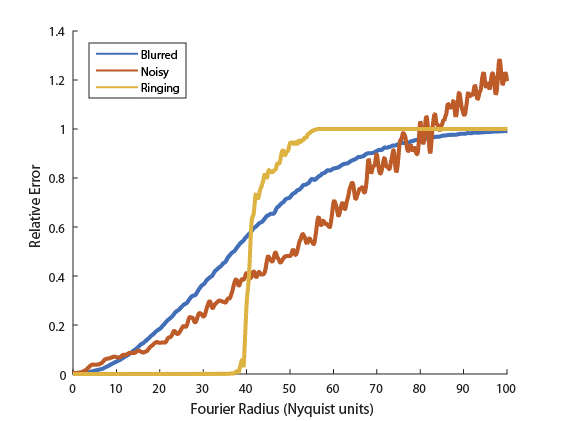
Our proposed ESP is designed for quantifying error in the case where a gold standard reference image is present, and generates an error spectrum based on NRMSE at each radius in the Fourier domain. Compared to a single NRMSE value, this enables a more detailed understanding of error characteristics. Fig. 2 shows ESPs for the images from Fig. 1, and demonstrates that each of the images has different error characteristics at different spatial scales, even though they all have the same NRMSE values.
Methods
The ESP is calculated by computing an error image in the spatial domain, transforming this error image into the Fourier domain, and then finding a smooth 1D function (as a function of Fourier radius) that fits the magnitude-squared intensities of the Fourier error as closely as possible subject to smoothness constraints. This fitting procedure is achieved using smoothing splines [8,9]. This 1D function is then normalized by the true signal intensity from the gold standard, similar to standard NRMSE computation. The pipeline for creating an ESP is shown in Fig. 3.Results
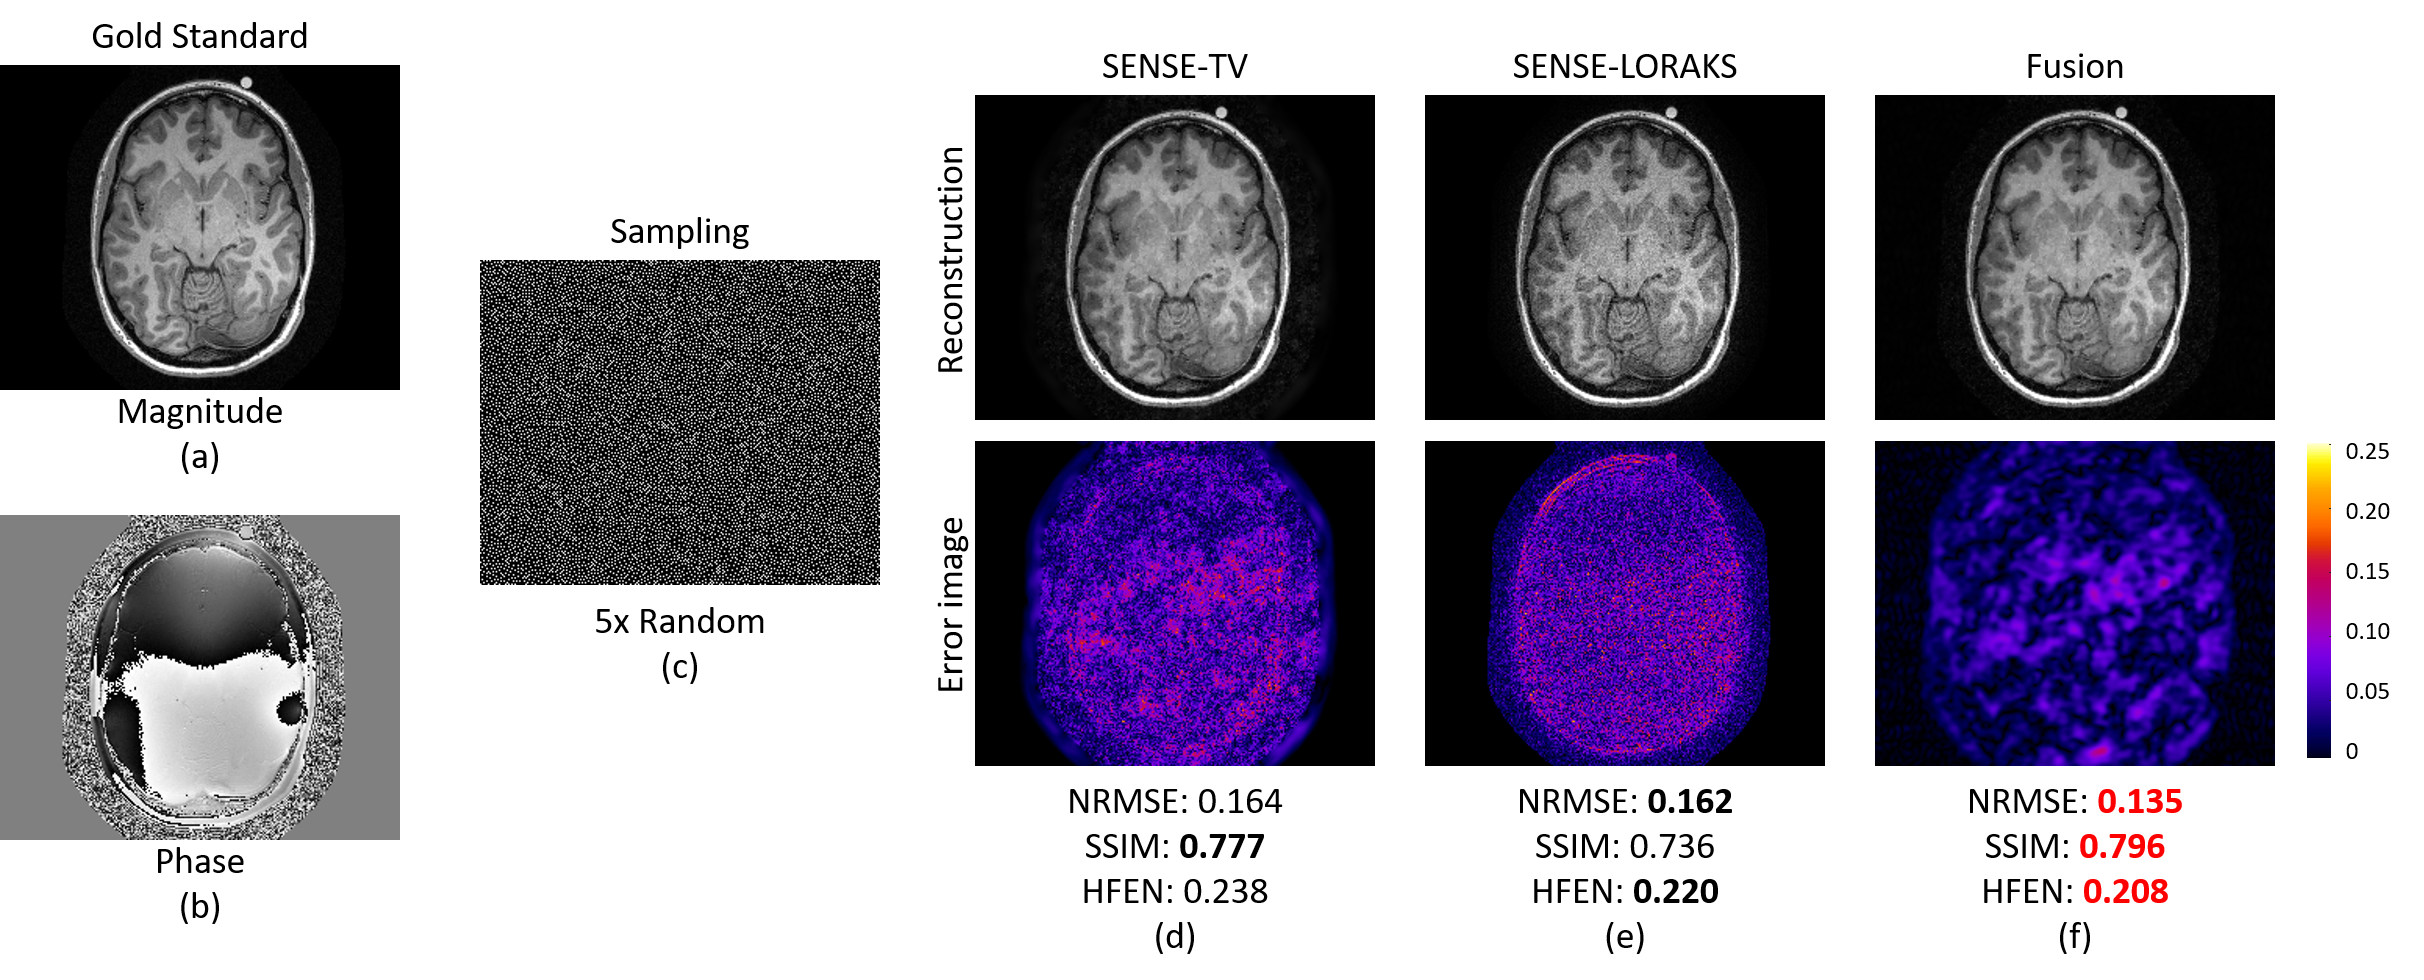
We illustrate the advantages of the proposed ESP in the context of comparing two advanced MRI reconstruction techniques. Specifically, we compared SENSE reconstruction [10] combined with total variation (TV) regularization [11] (SENSE-TV) against SENSE with low-rank modeling of local k-space neighborhood [12,13] (SENSE-LORAKS [14]).
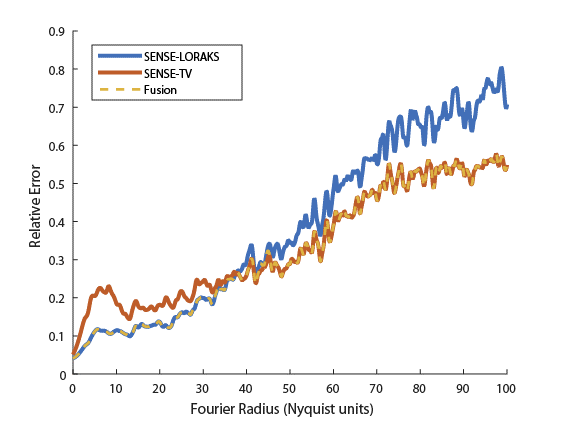
A fully sampled 4-channel T1-weighted MPRAGE data with size 208x256 was acquired, and was retrospectively randomly undersampled with acceleration factor=5. The data was then reconstructed using SENSE-TV and SENSE-LORAKS, with reconstructions compared against the gold-standard fully-sampled data as shown in Fig. 4. As shown in Fig. 4, SENSE-LORAKS has better NRMSE and HFEN but worse SSIM than SENSE-TV in this case. Clearly, the comparison between SENSE-LORAKS and SENSE-TV is nuanced, and which image is “best” depends entirely on the error metric that is chosen. However, the ESPs shown in Fig. 5 make the nuanced differences between the reconstructed images much more easily apparent. In particular, the ESP shows that SENSE-LORAKS has better performance at low spatial frequencies, while SENSE-TV has better performance at high spatial frequencies. This kind of insight is extremely valuable when trying to characterize and choose between different reconstruction alternatives.
The insight provided by ESPs can also be used to improve image reconstruction. For example, we observed that the performance differences between SENSE-LORAKS and SENSE-TV we observed in Fig. 5 are consistent across different slices of this same image – SENSE-LORAKS always performed better at low frequencies, while SENSE-TV always performed better at high frequencies. As a result, it would be possible to generate an improved reconstruction result by combining the low-frequency components from SENSE-LORAKS with the high-frequency components from SENSE-TV. An example fusion of these two reconstruction methods is shown in Fig. 4(f), and has obvious advantages in NRMSE, SSIM, and HFEN. The improvement can also be seen in the ESP shown in Fig. 5, where the fusion image outperforms the others in almost all frequency ranges.
Conclusion
We proposed the ESP, which provides more detailed information about image quality than conventional scalar error metrics. We recommend the use of ESPs in the MR reconstruction literature, and plan to disseminate a public software implementation before the ISMRM meeting.Acknowledgements
This work was supported in part by Annenberg fellowship, Kwanjeong educational foundation scholarship, research grants NSF CCF-1350563, NIH R21 EB022951, NIH R01 NS074980, and NIH R01 NS089212.References
1. Wang Z, Bovik AC. Mean squared error: Love it or leave it? a new look at signal fidelity measures. IEEE Signal Process. Mag 2009;26:98–117.
2. Wang Z, Bovik AC, Sheikh HR, Simoncelli EP. Image quality assessment: from error visibility to structural similarity. IEEE Trans Med Imag 2004;13:600–612.
3. Ravishankar S, Bresler Y. MR image reconstruction from highly undersampled k-space data by dictionary learning. IEEE Trans Med Imag 2011;30:1028–1041.
4. Saxton WO, Baumeister W. The correlation averaging of a regularly arranged bacterial cell envelope protein. J Microsc 1982;127:127–138.
5. van Heel M, Keegstra W, Schutter W, van Bruggen EFJ. The structure and function of invertebrate respiratory proteins. EMBO Workshop, 1982, pp. 69–73.
6. Harauz G, van Heel M. Exact filters for general geometry three dimensional reconstruction. Optik 1986; 73:146–158.
7. van Heel M, Schatz M. Fourier shell correlation threshold criteria. J Struct Biol 2005;151:250–262.
8. Reinsch C. Smoothing by spline functions. Numerische Mathematik 1967;10:177–183.
9. Craven P, Wahba G. Smoothing noisy data with spline functions. Numerische Mathematik 1979;31:377–403.
10. Pruessmann KP, Weiger M, Scheidegger MB, Boesiger P. SENSE: sensitivity encoding for fast MRI. Magn Reson Med 1999;42:952–962.
11. Block KT, Uecker M, Frahm J. Undersampled radial MRI with multiple coils. Iterative image reconstruction using a total variation constraint. Magn Reson Med 2007;57:1086–1098.
12. Haldar JP. Low-rank modeling of local k-space neighborhoods (LORAKS) for constrained MRI. IEEE Trans Med Imag 2014;33:668–681.
13. Haldar JP, Zhuo J. P-LORAKS: Low-rank modeling of local k-space neighborhoods with parallel imaging data. Magn Reson Med 2016;75:1499–1514.
14. Kim TH, Setsompop K, Haldar JP. LORAKS makes better SENSE: phase-constrained partial Fourier SENSE reconstruction without phase calibration. Magn Reson Med 2017;77:1021–1035.
Figures