0248
Highly Undersampled Kooshball Reconstruction with Low-rank Modeling and Sparsity Constraints for High-resolution T1 Mapping1Department of Biomedical Engineering, School of Medicine, Tsinghua University, Beijing, China, 2Department of Radiology, University of Washington, Seattle, WA, United States
Synopsis
Highly undersampled 3D radial is very useful for 3D imaging acceleration, and compressed sensing and low-rank can be used for reconstruction of the undersampled kooshball data. In this study, we propose a novel reconstruction method for fast 3D T1 mapping of carotid artery using 3D radial sampling. The reconstruction method is based on low-rank modeling with parallel imaging and sparsity constraints, and is potential to improve the accuracy and precision of T1 estimation. The aim of this study is to evaluate the effectiveness of the proposed method using phantom and in vivo imaging experiments on volunteers and carotid atherosclerosis patients.
Introduction
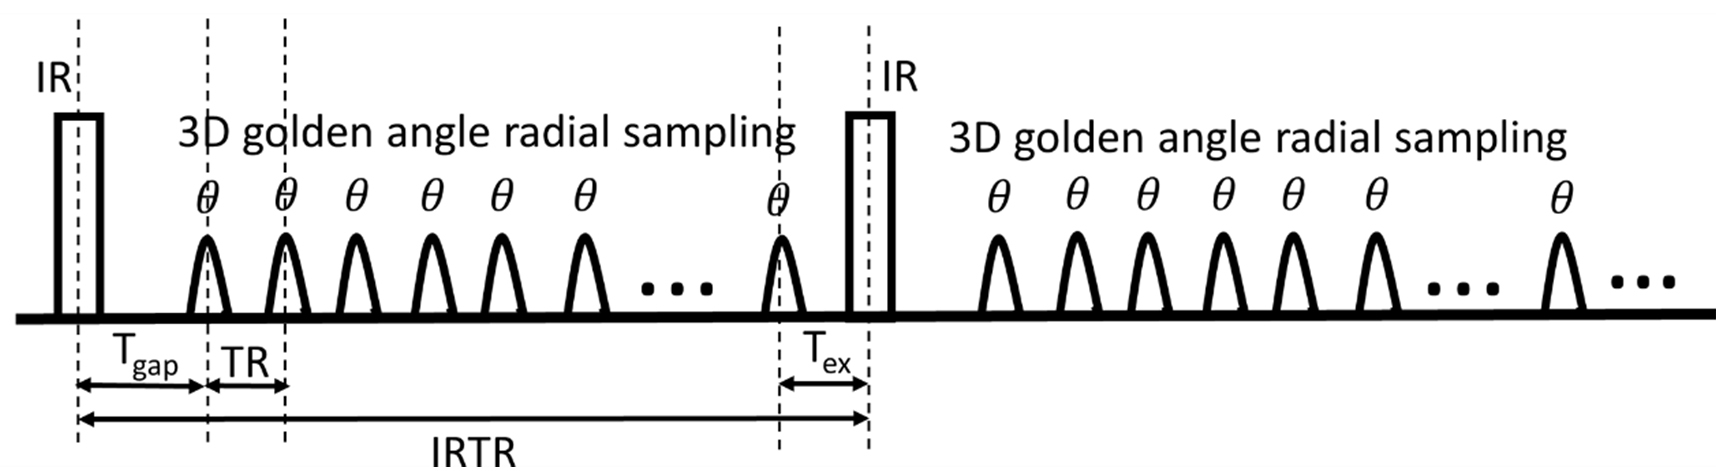
A fast 3D T1 mapping sequence for carotid artery, GOAL-SNAP, has recently been proposed, using inversion recovery (IR) prepared 3D golden angle radial (kooshball) sampling (1). Because of the short scan time (5min), the k-space data to reconstruct the image series along the IR curve is highly undersampled. And in the previous study, we’ve used the KWIC method to increase the reconstructed SNR, which, however, may introduce contrast mixture and influence the T1 estimation accuracy (2,3). The image series along the IR curve are well suited for low-rank and compressed sensing (CS) reconstructions, which have been used to enable reconstruction of dynamic image series from undersampled data (4,5). But the utility of low-rank and CS constraints on undersampled kooshball data hasn’t been widely investigated. In this study, we aimed to propose a more advanced reconstruction method for the highly undersampled kooshball data from GOAL-SNAP using low-rank modeling and sparsity constraint (LRS) to reduce undersampling artifacts.Methods
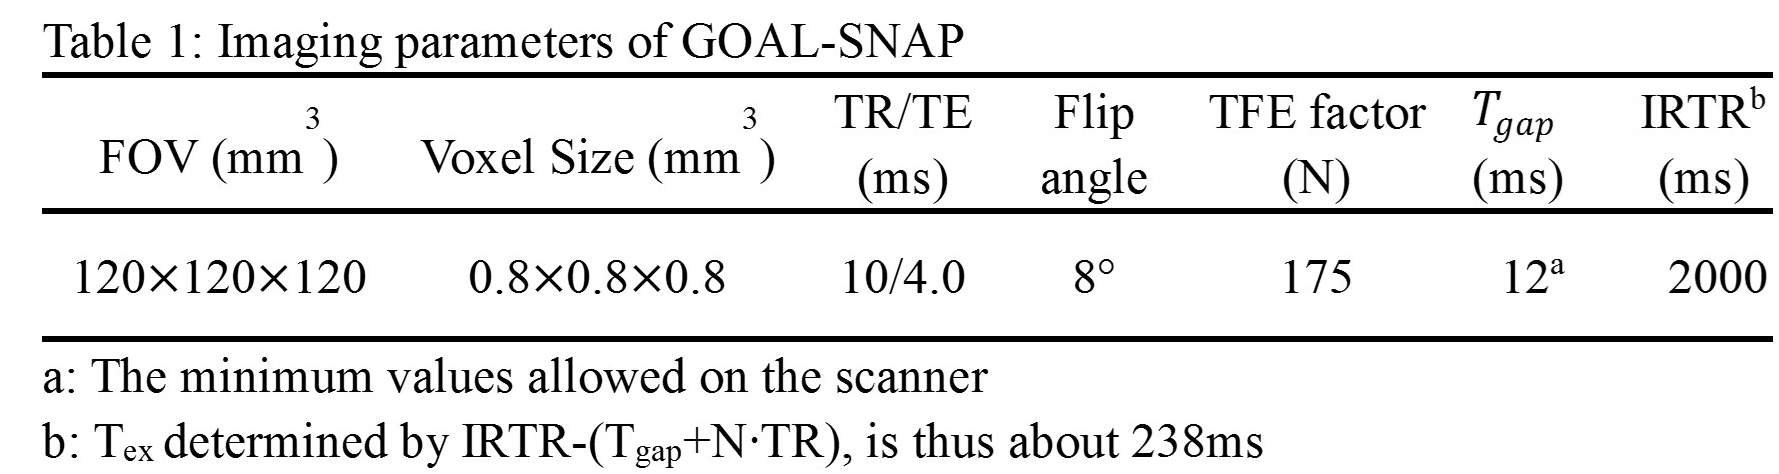
Theory: The GOAL-SNAP sequence is IR prepared, followed by 3D radial sampling (Fig. 1) (1), with imaging parameters shown in Table 1. To generate images along the IR curve, sliding window reconstruction was performed with temporal width=19 (190ms/frame), resulting in 9 frames for T1 fitting. Here, we proposed a low-rank model with parallel imaging and sparsity constraint method for the kooshball data reconstruction. Specifically, the image series along the IR curve can be represented by a Casorati matrix:
$$$\color{black} {P}= \begin {bmatrix}\rho(r_{1},TI_{1}) & ... &\rho(r_{1},TI_{M})\\⋮ & ⋱ &⋮\\\rho(r_{N},TI_{1}) & ... &\rho(r_{N},TI_{M})\end{bmatrix}$$$ [1]
As there is strong temporal and spatial correlation among the image at different TIs, the low-rank structure was enforced using an explicit rank constraint by setting $$$rank(\color{black} {P})\leq L$$$. The matrix factorization was peformed: $$$\color{black} {P=UV}$$$, where columns of $$$\color{black} {U }(N×L)$$$ and rows of $$$\color{black} {V }(L×M)$$$ span the spatial and temporal subspace of $$$\color{black} {P}$$$. Using the central k-space region satisfying Nyquist rule as training data, the temporal subspace can be pre-estimated using principal component analysis. Then, the reconstruction problem can be formulated as:
$$$\color{black} {\color{black} {\color{black} { \widehat{U}}=arg min(||d-F_{nu} S(UV)||_2^2} +λ\cdot||TV(UV)}||_1)$$$ [2]
where $$$\color{black} {d}$$$ is the measured multi-coil k-space data, $$$\color{black} {F_{nu}}$$$ is the NUFFT operator, $$$\color{black} {S}$$$ denotes the sensitivity maps, $$$\lambda$$$ is the regularization parameter and TV is the spatial total-variation operator. With the estimated $$$\color{black} {\widehat{U}}$$$ from Eq. [2], the Casorati matrix can be reconstructed by $$$\color{black} {\widehat{P}}=\color{black} {\widehat{U}V}$$$, from which the image series can be obtained for T1 fitting. In this study, L was set to be 4 and $$$\lambda$$$ was selected empirically. MR imaging: All imaging was performed on a 3T MR scanner (Philips, Achieva). First, phantoms of different T1 values were imaged to evaluate whether the proposed reconstruction method can improve the accuracy and precision of the T1 estimation compared with the reconstruction by CG-SENSE (6). The conventional 2D IR-SE was performed as gold standard. Then, the proposed reconstruction was evaluated using in vivo data of carotid artery. Four healthy volunteers and 2 carotid atherosclerosis patients with IPH were imaged using an 8-channel carotid coil after institutional review board approval. The reconstructed image quality and the estimated T1 map were compared between reconstructions by the proposed LRS and CG-SENSE
Results
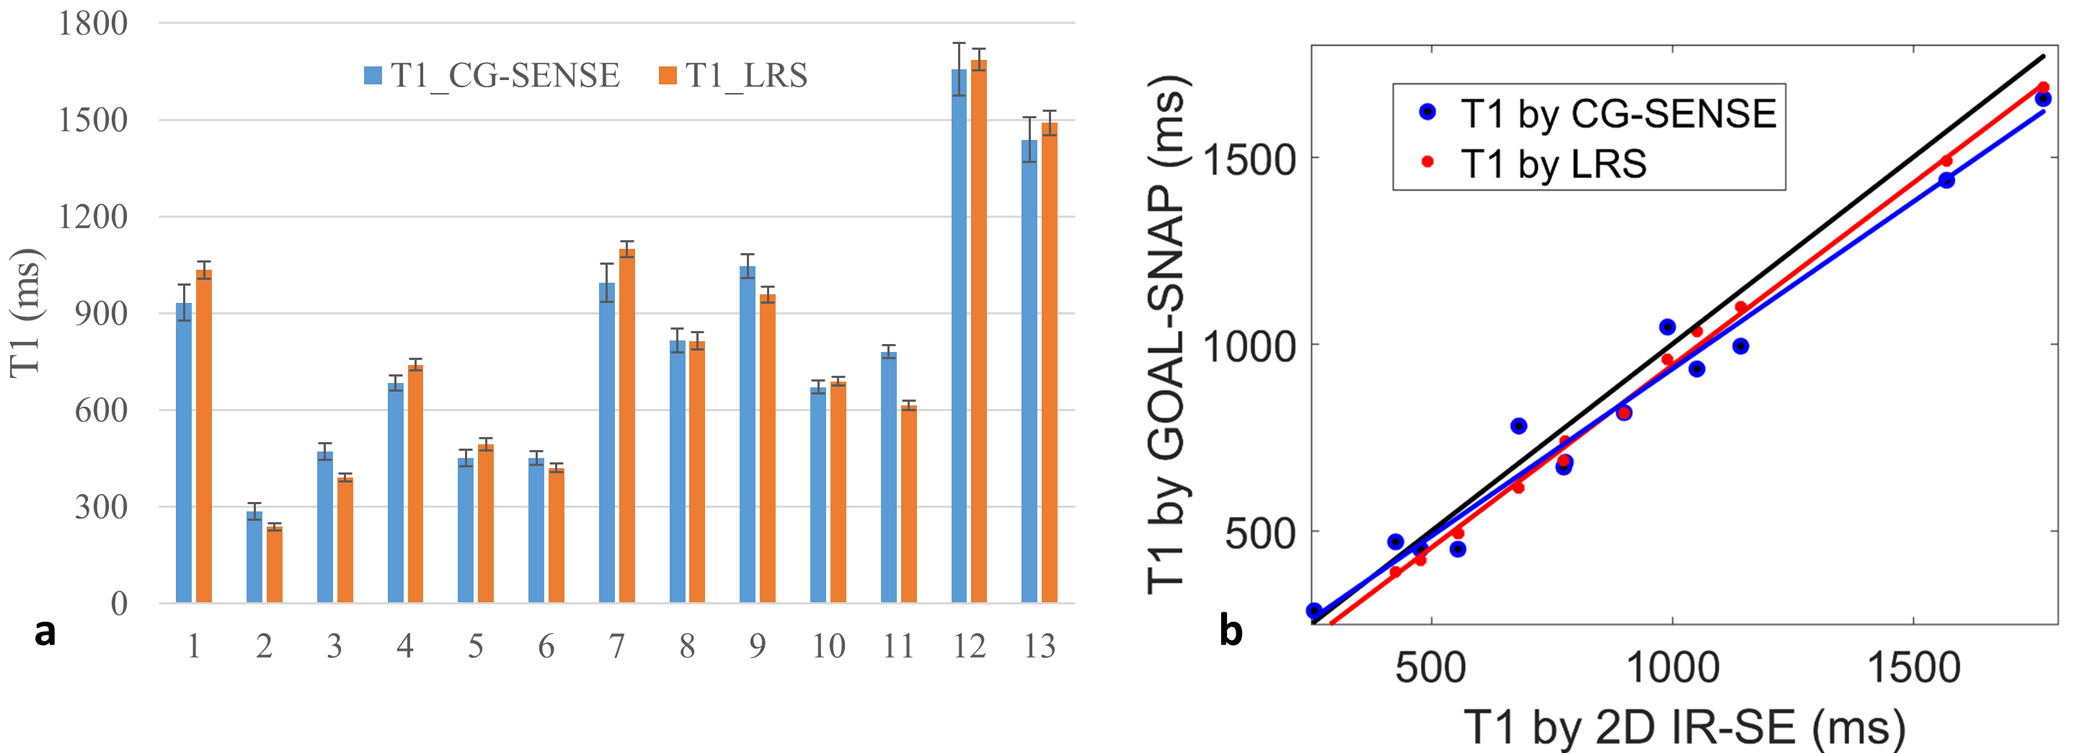
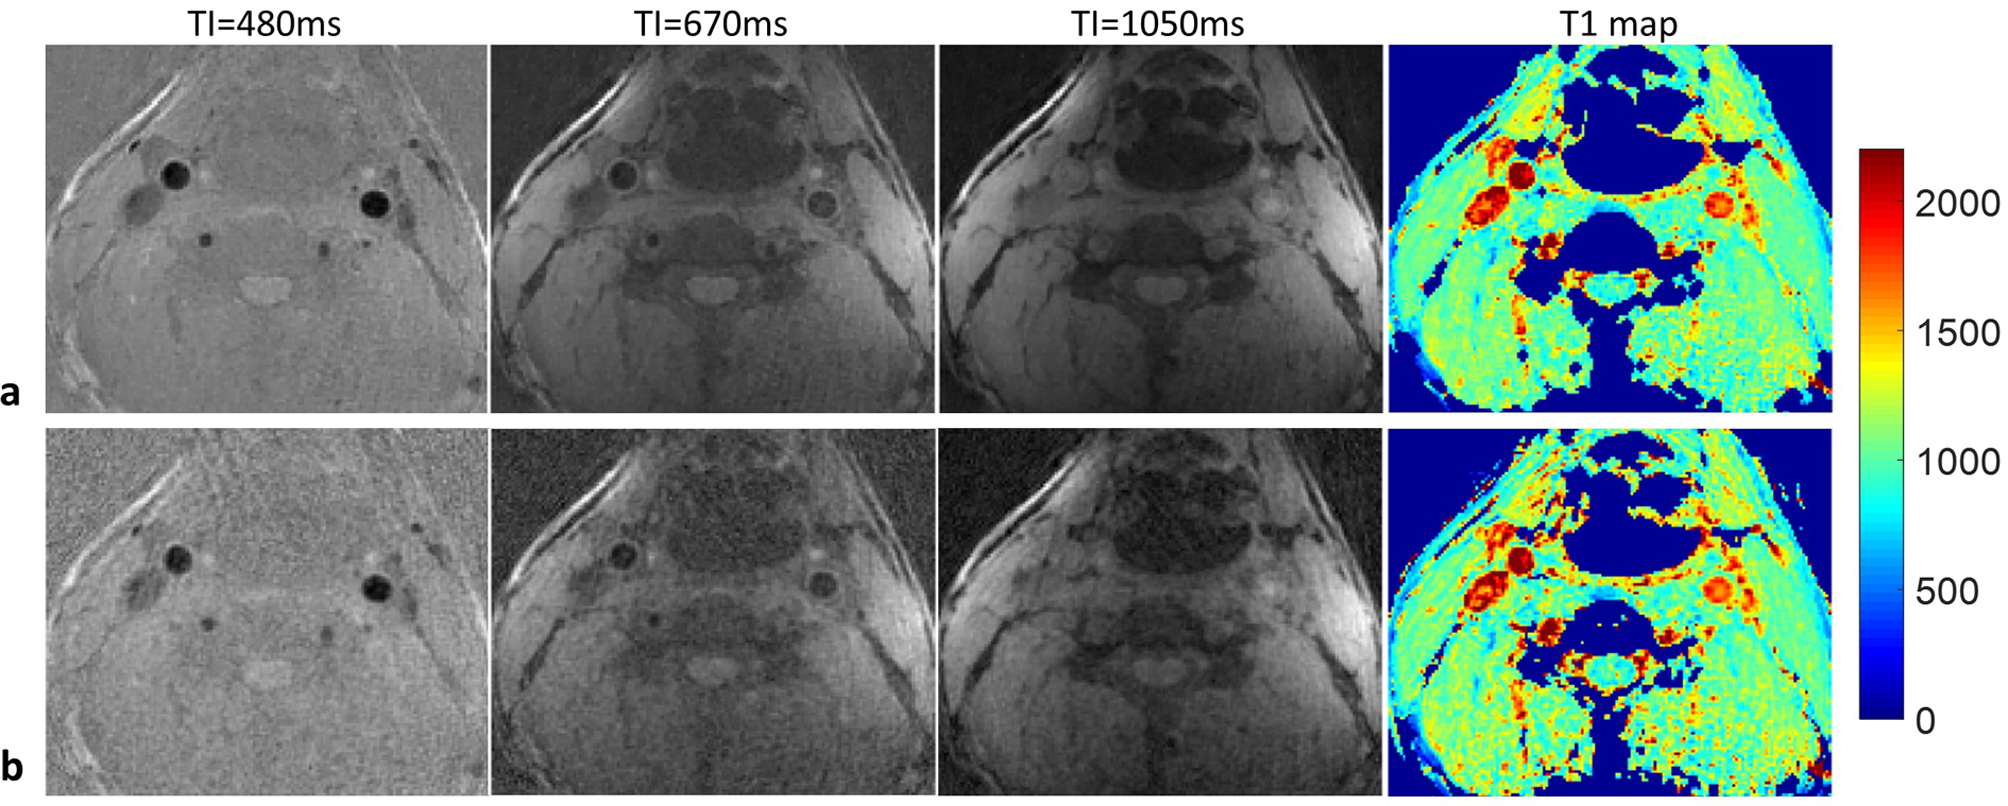
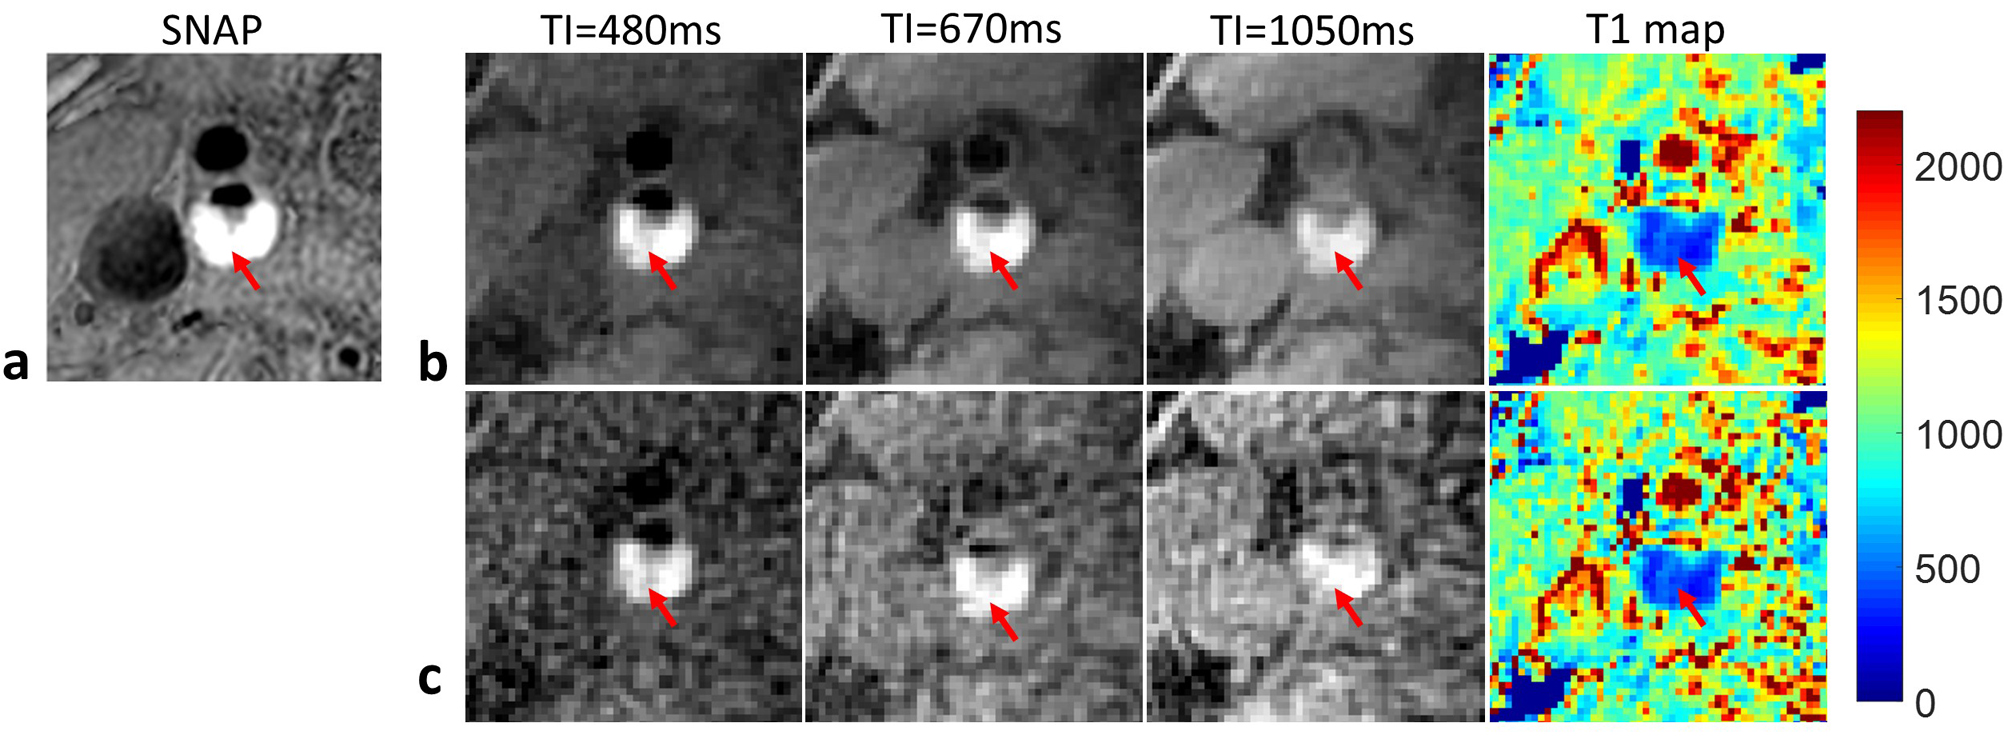
The T1 values estimated by LRS showed smaller standard deviation (SD) than CG-SENSE (Fig. 2a). The mean coefficient of variation (CV) of the 13 phantoms were 4.9% and 2.8% for CG-SENSE and LRS, respectively. A higher correlation with 2D IR-SE was observed for LRS (Fig. 2b). And the measurement bias by LRS was lower than CG-SENSE (7.0%±3.4% vs. 10.8%±3.8%). Fig. 3 shows images of a volunteer at 3 representative TIs, as well as the resulting T1 maps. The LRS had less noise in the reconstructed images and lower variations in the T1 map compared with CG-SENSE. Similar results were observed for the patients, and representative images of a plaque with IPH are shown in Fig. 4. The IPH was detected by strong hyperintensities on SNAP (7), and the IPH region showed decreased T1 values on the T1 maps (Fig. 4b,c).Discussion and Conclusions
A novel low-rank modeling and sparsity constrained reconstruction method was introduced for the fast 3D T1 mapping of carotid artery. The proposed method enables reconstruction of images along the IR curve with good quality from highly undersampled 3D radial data for T1 fitting. Its effectiveness has been demonstrated with phantom and in vivo experiments. It’s expected to improve the T1 estimation accuracy and precision of GOAL-SNAP. Although not addressed here, the proposed LRS method may also be applicable to other 3D dynamic imaging using highly undersampled 3D radial acquisition. And its utility should be fully explored in future studies.Acknowledgements
No acknowledgement found.References
1. Qi H, Sun J, Qiao H, Chen S, Zhou Z, Pan X, Wang Y, Zhao X, Li R, Yuan C, Chen H. Carotid Intraplaque Hemorrhage Imaging with Quantitative Vessel Wall T1 Mapping: Technical Development and Initial Experience. Radiology 2017;(Accepted).
2. Song HK, Dougherty L. k-space weighted image contrast (KWIC) for contrast manipulation in projection reconstruction MRI. Magn Reson Med 2000;44(6):825-832.
3. Neumann D, Breuer FA, Volker M, Brandt T, Griswold MA, Jakob PM, Blaimer M. Reducing Contrast Contamination in Radial Turbo-Spin-Echo Acquisitions by Combining a Narrow-Band KWIC Filter with Parallel Imaging. Magn Reson Med 2014;72(6):1680-1686.
4. Zhao B, Haldar JP, Christodoulou AG, Liang ZP. Image Reconstruction From Highly Undersampled (k, t)-Space Data With Joint Partial Separability and Sparsity Constraints. Ieee T Med Imaging 2012;31(9):1809-1820.
5. Sun A, Zhao B, Li Y, He Q, Li R, Yuan C. Real-time phase-contrast flow cardiovascular magnetic resonance with low-rank modeling and parallel imaging. Journal of cardiovascular magnetic resonance : official journal of the Society for Cardiovascular Magnetic Resonance 2017;19(1):19.
6. Pruessmann KP, Weiger M, Bornert P, Boesiger P. Advances in sensitivity encoding with arbitrary k-space trajectories. Magn Reson Med 2001;46(4):638-651.
7. Wang JN, Bornert P, Zhao HL, Hippe DS, Zhao XH, Balu N, Ferguson MS, Hatsukami TS, Xu JR, Yuan C, Kerwin WS. Simultaneous noncontrast angiography and intraPlaque hemorrhage (SNAP) imaging for carotid atherosclerotic disease evaluation. Magn Reson Med 2013;69(2):337-345.
Figures