0238
Implementation of T1 Mapping in Routine Clinical MR Liver Exam For The Detection of Hepatic Fibrosis and Portal Hypertension in Hepatitis C Patients1Biomedical and Metabolic Imaging Branch, National Institute of Diabetes and Digestive and Kidney Diseases, NIH, Bethesda, MD, United States, 2Liver Diseases Branch, National Institute of Diabetes and Digestive and Kidney Diseases, NIH, Bethesda, MD, United States, 3Interventional Radiology, Clinical Center, NIH, Bethesda, MD, United States
Synopsis
Application of two short single breath hold T1 mapping shMOLLI technique (before and after Gadolinium injection) to a routine clinical MRI liver exam can detect both severe fibrosis and portal hypertension in Hepatitis C. The technique was prospectively validated in 29 patients with reference standard clinical methods including liver biopsy and direct portal venous pressure measurements. Utilizing this method would allow for a comprehensive anatomic and functional MRI study in a single session without substantial prolongation of scan time, thereby, allow non-invasive monitoring of therapy and/or progression of disease.
INTRODUCTION
Hepatitis C infection often may progresses to chronic liver disease and patients frequently present clinically with consequences of progressive fibrosis and portal hypertension (PHT). Biopsy and direct portal pressure assessment are the reference standard for detection of fibrosis and PHT respectively. Both are invasive procedures that may carry risks, rendering them unsuitable for repetition to monitor disease and/or treatment response.
Hence, a non-invasive test would be highly desirable, particularly if implemented in a routine clinical MRI exam. Magnetic Resonance Elastography requires dedicated external device and set up that comes with a substantial cost, therefore, is not widely available. While ultrasound based techniques offer a more versatile alternative, it has limited field of view. Shortened modified look-locker inversion recovery (shMOLLI) 1 is among widely available T1 mapping methods that can characterize liver parenchymal changes. It requires only a single breath hold rendering it an appealing method that can be readily included in routine clinical liver MR study.
The purpose of this study is to investigate the value of T1 mapping before and after gadolinium using shMOLLI sequence in routine liver imaging as a surrogate for identifying severe liver fibrosis and PHT.
METHODS
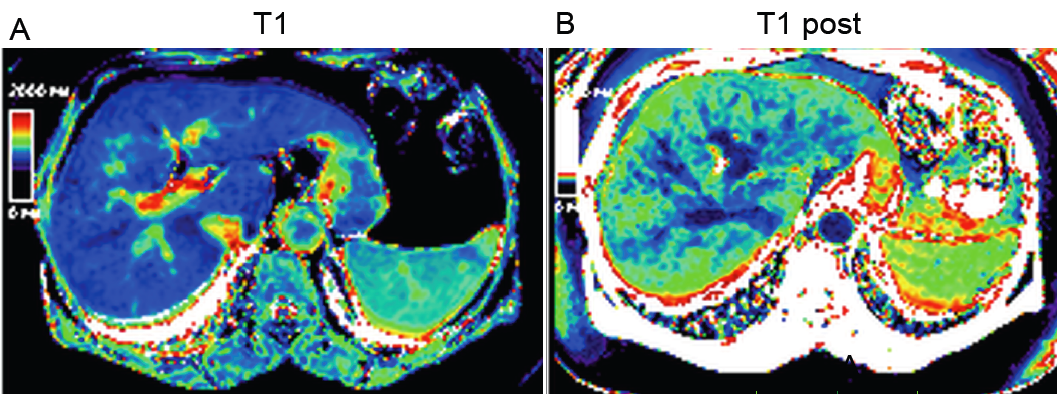
This prospective institutional-board approved study included 30 consecutive consented hepatitis C patients. All had a liver biopsy and the degree of fibrosis was graded pathologically by Ishak score (0-6). Severe liver fibrosis was considered as Ishak 5-6. Portal pressure was measured by direct cannulation of the portal vein via percutaneous approach. Severe PHT was considered if portal pressure ≥ 16 mmHg. A clinical liver MRI exam was performed on 3T Siemens Verio using standard three-phase dynamic gadopentetate dimeglumine (Magnevist) (Gd) contrast protocol. Only two short breath-hold shMOLLI 1 acquisitions were added: before and after IV-Gd administration. This second sMOLLI sequence was acquired after completion of the routine liver study without the need for prolonging the delay time i.e. at 5 minutes post injection. T1 measurements were obtained from the right lobe avoiding major vessels, at same location on both shMOLLI map images (figure 1) using 2cm2 region of interest. Delta-T1 is defined as pre-Gd T1 – post-Gd T1 value. Student-Newman-Keuls test was used for pairwise comparisons. And Receiver Operator Curves (ROC) were generated for identifying ideal values to detect severe fibrosis and PHTRESULTS
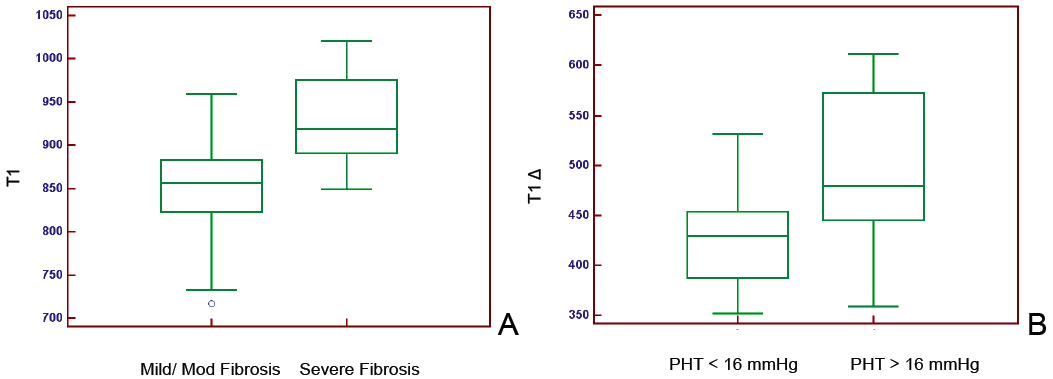
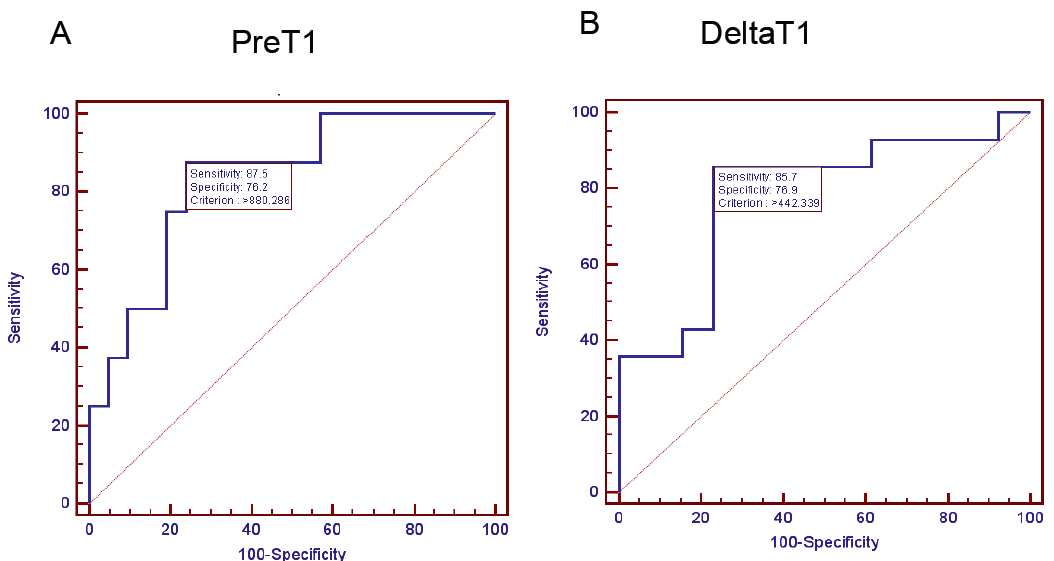
Twenty-nine patients successfully completed all the exams. The average was age 57.6±10 yrs and eleven were women. The pre-Gd T1 values and Delta-T1 were able to differentiate patients with severe fibrosis and portal hypertension from rest of the cohort (P = 0.003 and P = 0.018) respectively (figure 2). For detecting severe fibrosis the ROC had area under the curve (AUC) = 0.833 with sensitivity of 87.5% and specificity of 76.2% at T1 greater than 880 ms. The ROC for Delta-T1 to detect severe PHT showed AUC=0.78 with sensitivity of 85.7% and specificity of 76.9% at values greater than 442 ms (figure 3).DISCUSSION
This prospective study showed MRI T1 mapping (using shMOLLI) before and after Gd is a valuable non-invasive tool that can identify Hepatitis C patients with severe liver fibrosis and portal hypertension. The presented method is a relatively simple add-on to routine clinical MRI studies without the need for additional equipment or prolonging scan delay times.
We applied this method to a cohort of virus C hepatitis patients and validated using two invasive reference standard (direct portal venous pressure measurements and liver biopsy). Other studies have utilized comparable methods for T1 measurement in the liver 2-5. However, none were able to demonstrate its utility to simultaneously detect clinically significant PHT and severe liver fibrosis in a single study. Palaniyappan et al 2 was the only study to correlate T1 with indirect hepatic venous wedge pressure (HPVG) and not direct portal venous pressure as in this study and without biopsy correlation. Banerjee et al 3 was the only study quantifying fibrosis by T1 as confirmed by biopsy, however, used an additional 23 minutes over a standard clinical protocol. Finally other studies 4, 5 that utilized pre-Gd and post-Gd T1 maps needed a 10-20 minute delay to detect liver dysfunction as measured by clinical based scores such as CHILD and MELD scores (not compared to reference standard) which are less expensive to obtain compared to the MRI.
CONCLUSION
In conclusion by adding only two breath-hold T1 mapping using shMOLLI (before and after Gd) Hepatitis C patients with severe liver fibrosis and portal hypertension can be identified. This relatively simple technique comes at no significant additional cost can help guide further studies and therapy.Acknowledgements
This work was funded by the intramural program of The National Institute of Diabetes and Digestive and Kidney Diseases, NIH, USA.References
1) Piechnik SK, Ferreira VM, Dall'Armellina E, Cochlin LE, Greiser A, Neubauer S, Robson MD. Shortened Modified Look-Locker Inversion recovery (ShMOLLI) for clinical myocardial T1-mapping at 1.5 and 3 T within a 9 heartbeat breathhold. J Cardiovasc Magn Reson. 2010;12(1):69-80.
2) Palaniyappan N, Cox E, Bradley C, Scott R, Austin A, O'Neill R, et al. Non-invasive assessment of portal hypertension using quantitative magnetic resonance imaging. Journal of hepatology. 2016;65(6):1131-9.
3) Banerjee R, Pavlides M, Tunnicliffe EM, et al. Multiparametric magnetic resonance for the non-invasive diagnosis of liver disease. Journal of hepatology. 2014;60(1):69-77.
4) Yoon JH, Lee JM, Paek M, Han JK, Choi BI. Quantitative assessment of hepatic function: modified look-locker inversion recovery (MOLLI) sequence for T1 mapping on Gd-EOB-DTPA-enhanced liver MR imaging. European radiology. 2016;26(6):1775-82.
5) Haimerl M, Verloh N, Fellner C, Zeman F, Teufel A, Fichtner-Feigl S, et al. MRI-based estimation of liver function: Gd-EOB-DTPA-enhanced T1 relaxometry of 3T vs. the MELD score. Scientific reports. 2014;4:5621.
Figures