0237
Clinical Assessment of Nonalcoholic Steatohepatitis (NASH) with Multi-parametric MRI1Radiology, Mayo Clinic, Rochester, MN, United States, 2Gastroenterology, Mayo Clinic, Rochester, MN, United States, 3GE Healthcare, Waukesha, WI, United States, 4GE Healthcare, Menlo Park, CA, United States, 5GE Healthcare, Silver Spring, MD, United States, 6Anatomic Pathology, Mayo Clinic, Rochester, MN, United States, 7Gastroenterology and Hepatology, Mayo Clinic, Rochester, MN, United States
Synopsis
In 27 clinical patients, we performed multi-parametric hepatic MRI, including proton density fat fraction with R2* correction, MR Elastography (MRE), and T1 mapping to characterize nonalcoholic steatohepatitis (NASH). Fat fraction and multiple MRE-assessed mechanical parameters successfully diagnosed NASH (p<0.05 for all). Diagnostic abilities of all parameters were evaluated based on steatosis, inflammation and ballooning scores respectively. Spearman correlations were used to analyze the correlations between imaging parameters. We found that T1 relaxation time had a significantly positive correlation (ρ=0.72, p=0.0005) with fat fraction. In summary, multi-parametric MRI is a potential imaging surrogate for diagnosing NASH.
Introduction
Nonalcoholic steatohepatitis (NASH) is defined as an accumulation of liver fat associated with inflammation and subsequent hepatocellular ballooning, the diagnosis of which usually relies on histology findings. Either MR Spectroscopy or chemical shift based fat fraction methods have been well-established for quantifying liver fat content1. Some studies have shown that T1 mapping with T2* correction has promise in diagnosing nonalcoholic fatty liver disease (NAFLD), and a high accuracy for distinguishing NASH and ballooning from simple steatosis2. Investigators have also found that MRE-assessed shear stiffness and damping ratio have great potential in predicting nonalcoholic fatty liver disease activity score (NAS) in both preclinical and clinical subjects3. Also, shear attenuation has an equivalent accuracy as liver stiffness for detecting hepatic fibrosis and inflammation4. So the purpose of our study is to evaluate the capability of all the aforementioned multiple MRI/MRE parameters, including fat fraction, R2*, MR Elastography (MRE), and T1 mapping, in characterizing disease severity in clinical patients with biopsy-proven NAFLD/NASH.Methods
All activities related to human subjects were reviewed and approved by our institutional review board. Multi-parametric MRI, including fat fraction, R2*, multi-frequency 3D MRE (30, 40, 60Hz), and T1 mapping, were acquired on 24 NAFLD/NASH patients and 3 patients with healthy livers. 20 of the patients had liver biopsy results available, while biopsy results on 7 patients are pending. All the examinations were carried out on 1.5T whole-body GE imager as described in our previous study [cite 2017 ISMRM abstract on NASH patients]. We derived hepatic shear stiffness, attenuation, and damping ratio from MRE at multiple frequencies. Fat fraction and R2* were obtained with the IDEAL-IQ sequence. In order to avoid the opposing effect of iron on T1 mapping, we measured R2* values (40.38±9.43s-1). Pairwise comparisons (nonparametric Dunn method for joint ranking) were performed for the mean values of fat fraction, shear stiffness, attenuation, damping ratio, and T1 value among different groups of NASH diagnosis and histologic findings (steatosis, lobular inflammation, and ballooning). Spearman’s correlations were used to analyze the relationships between imaging parameters. For all statistical analysis a significance level of less than 0.05 was used and a correlation coefficient (ρ) greater than 0.7 was considered good.Results
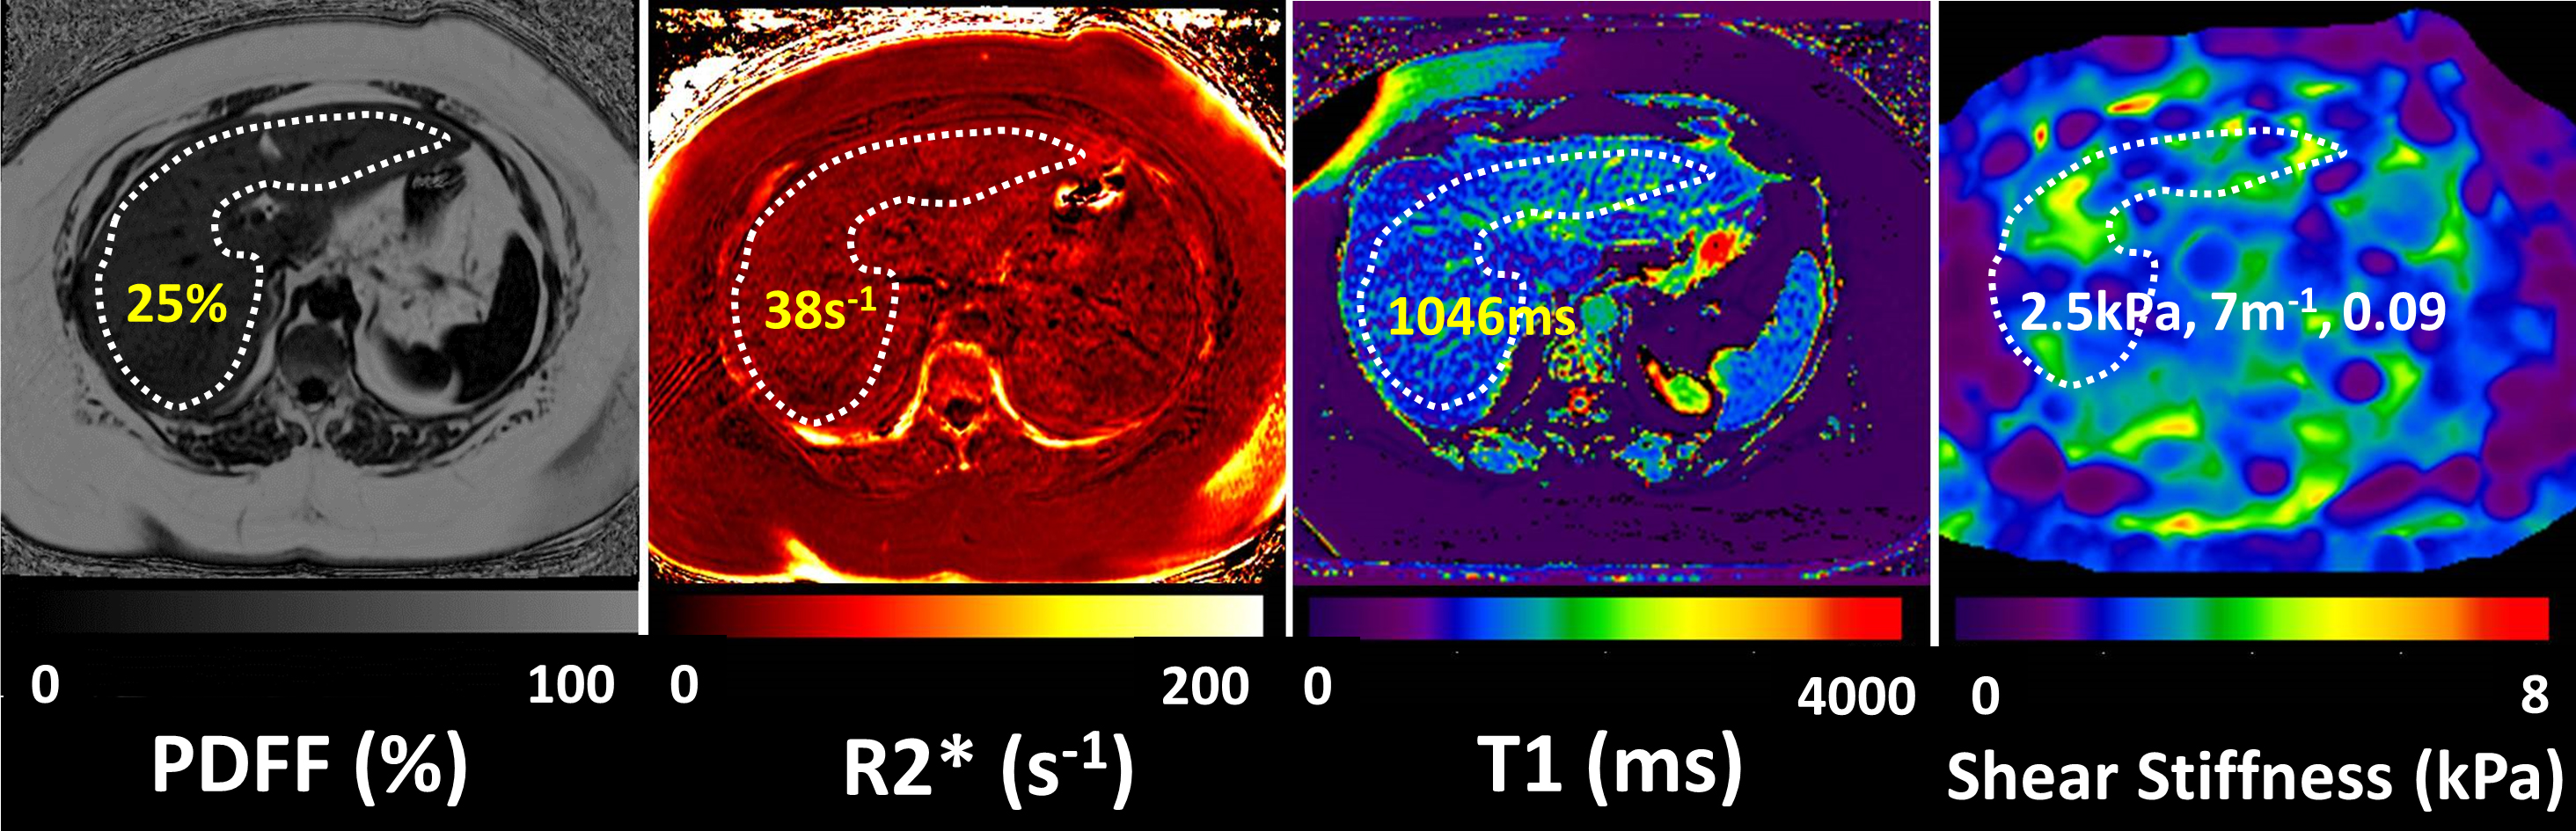
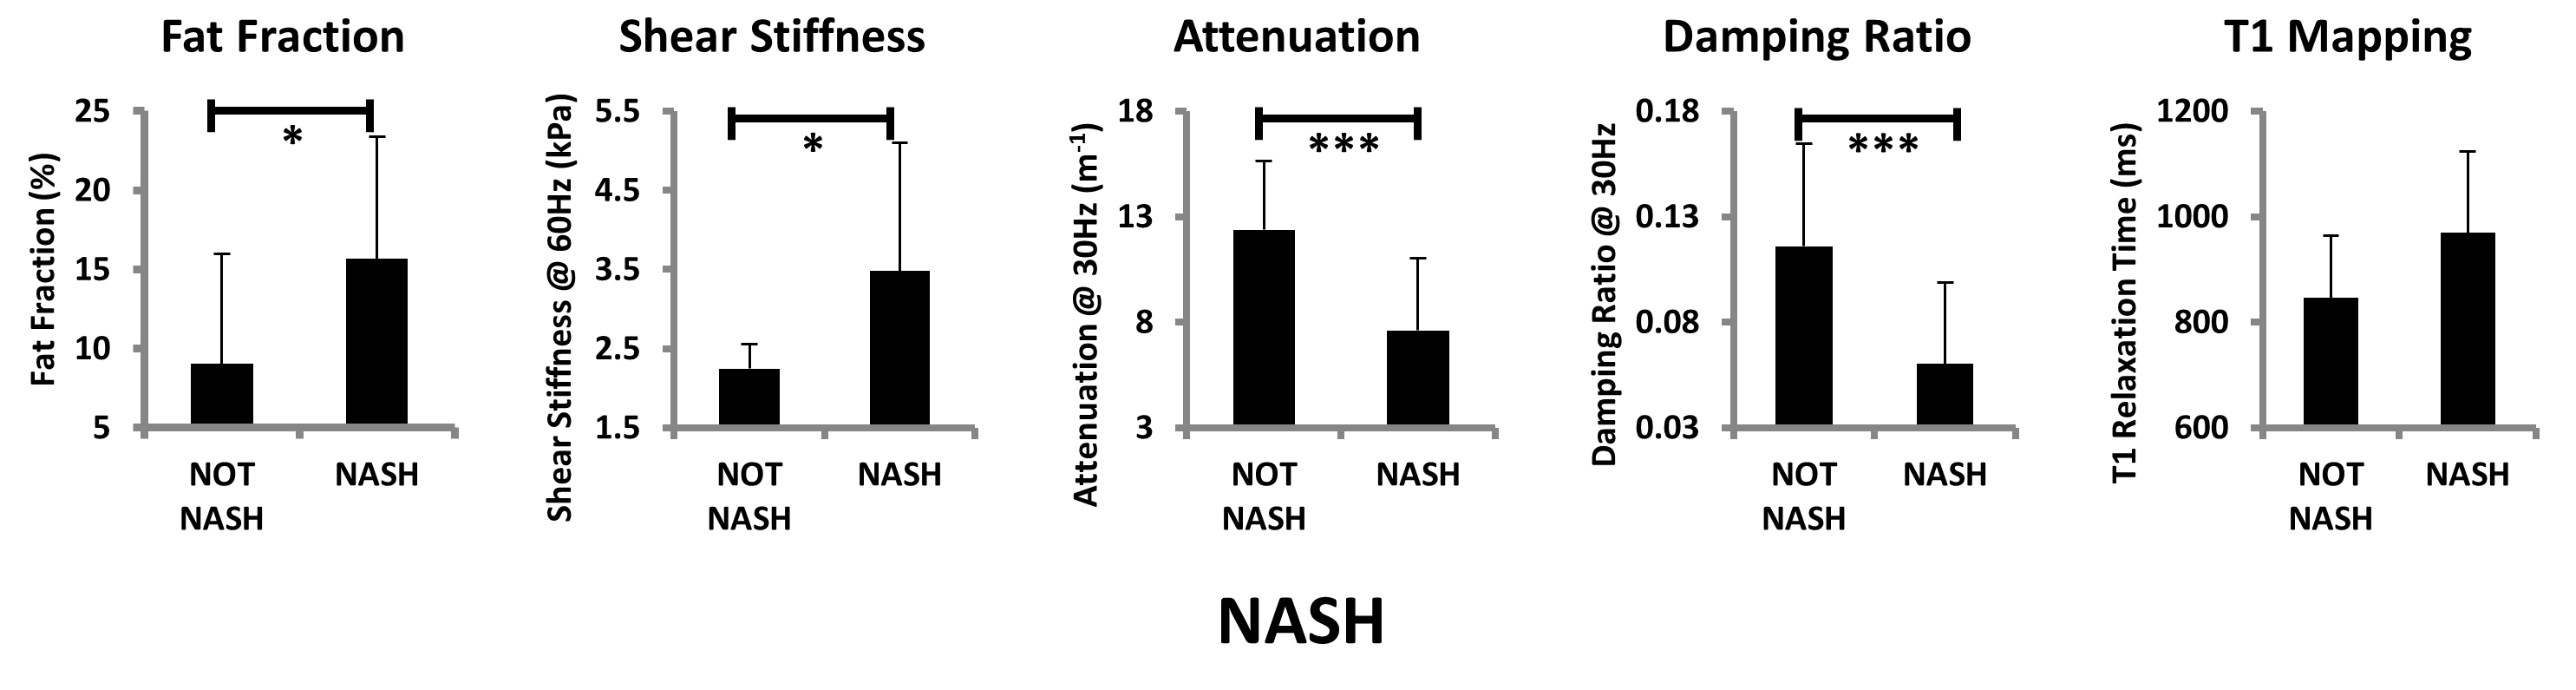
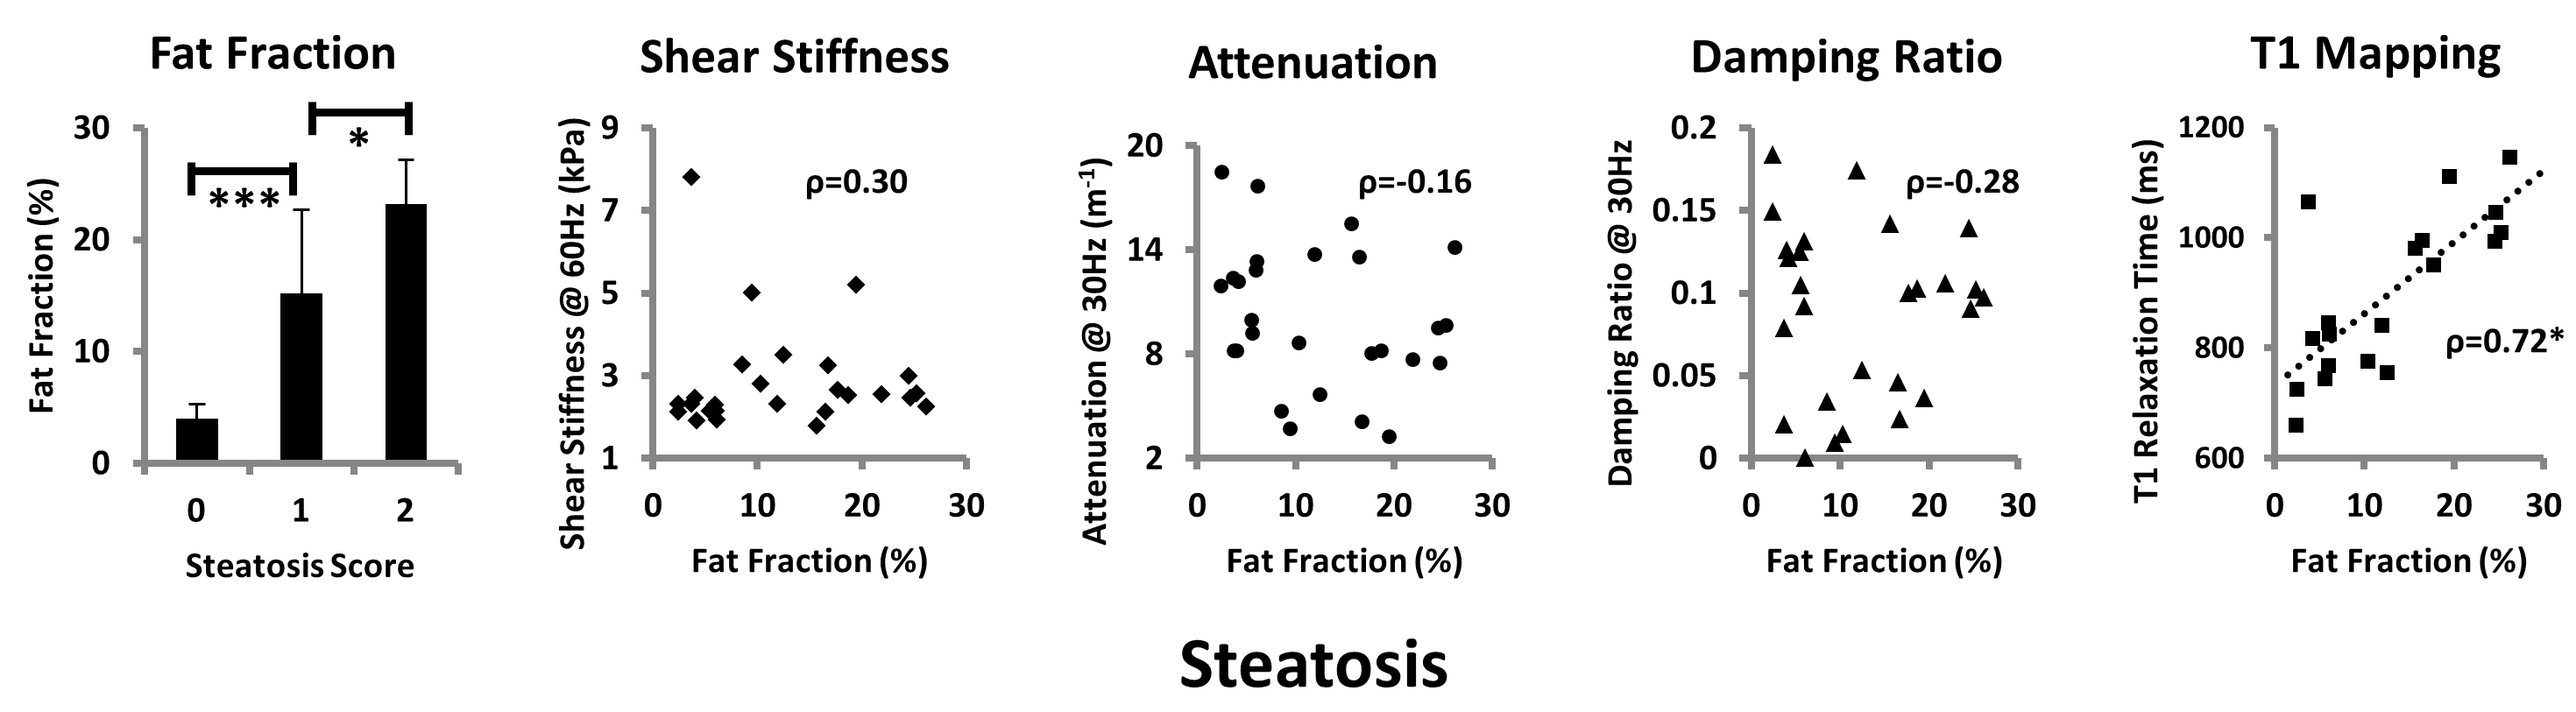
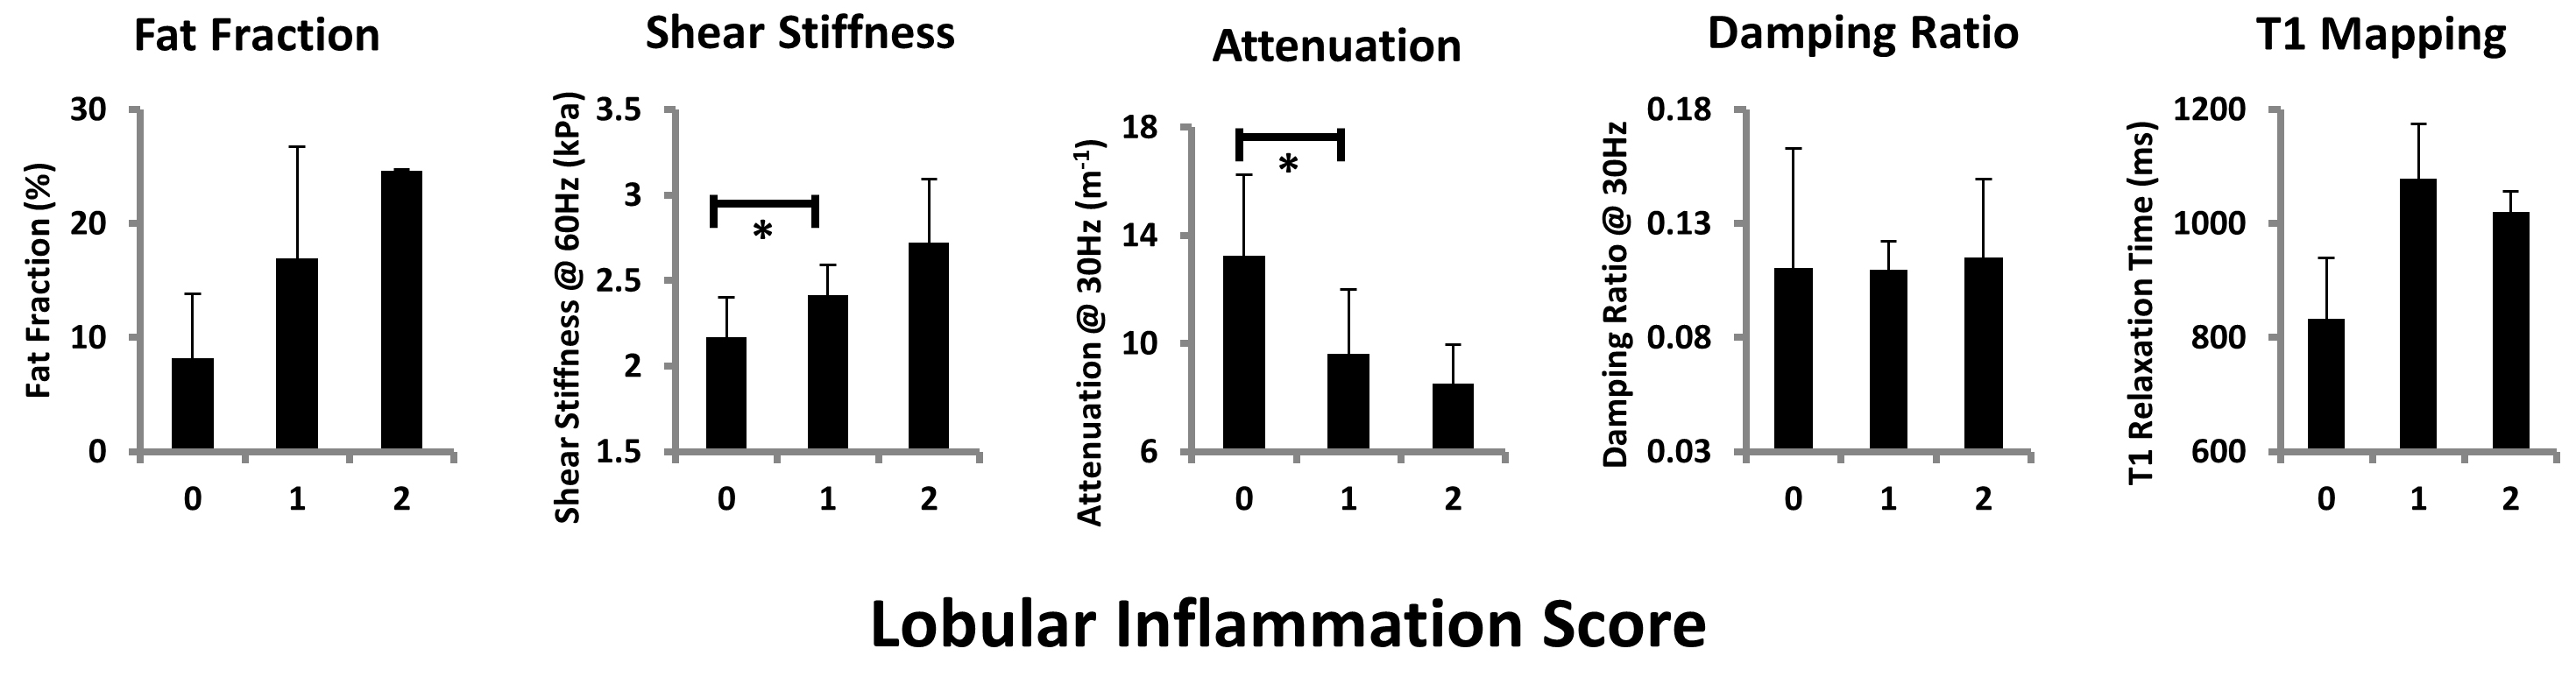
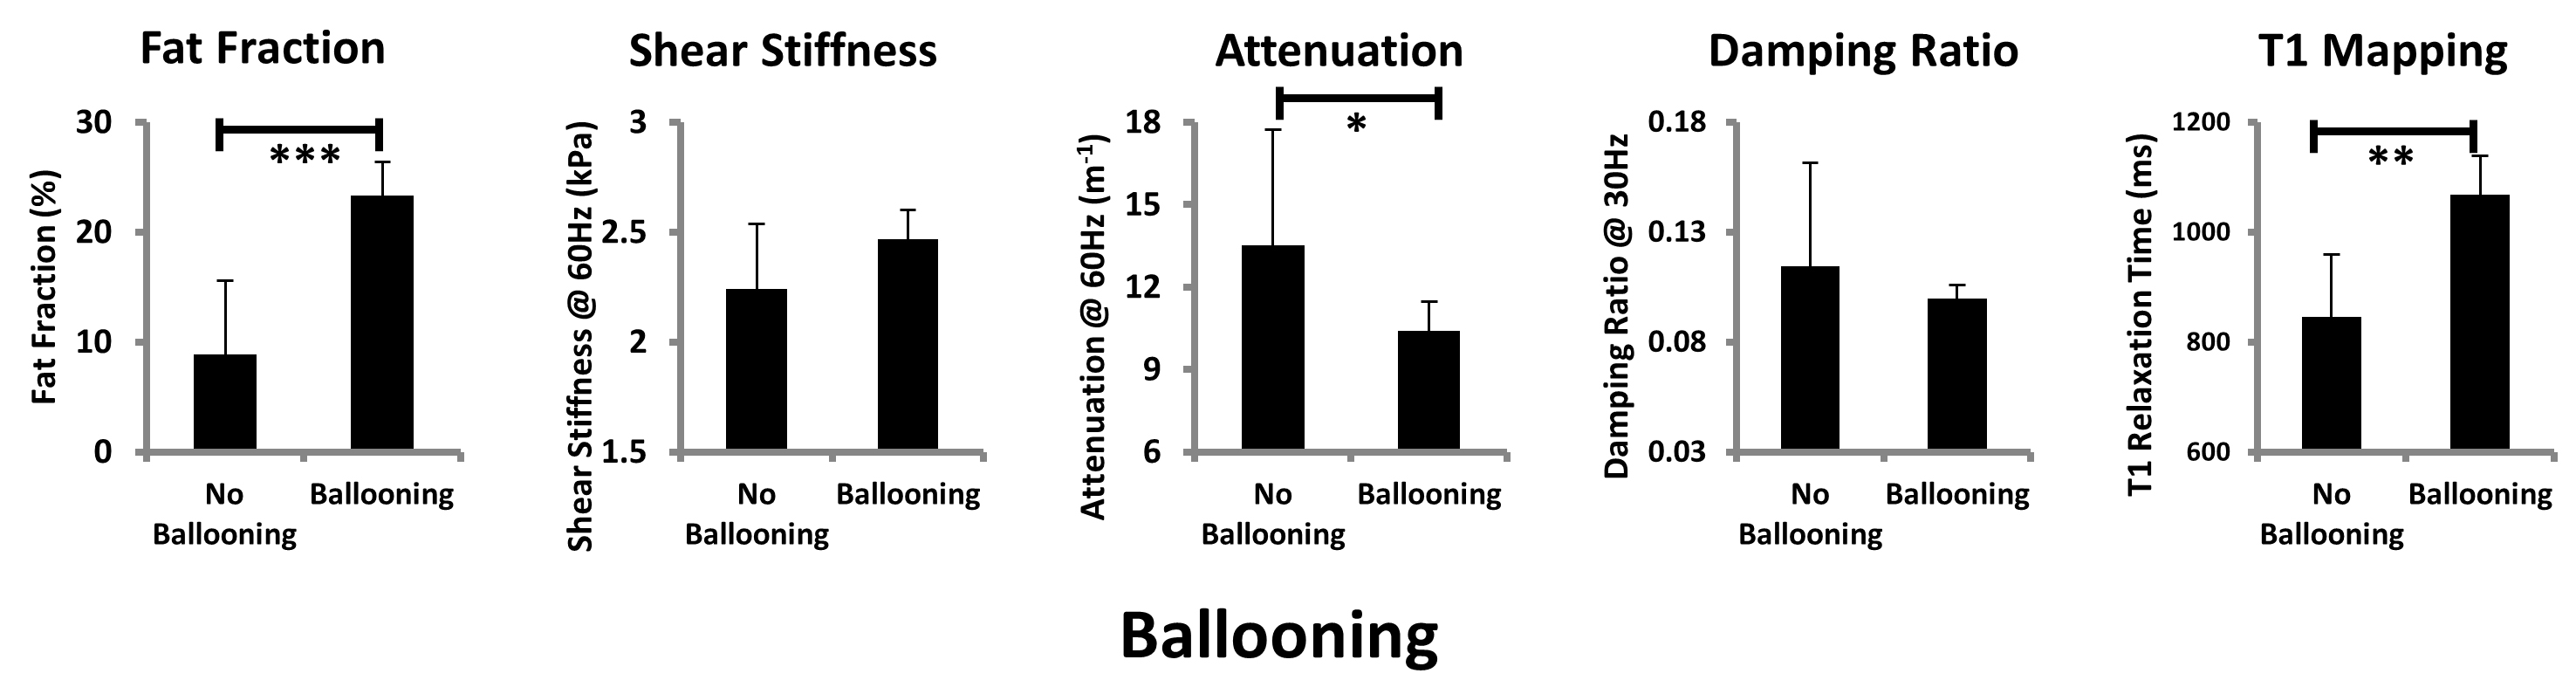
Figure 1 demonstrates an example of multi-parametric MR images obtained from a patient with NASH. Fat fraction and shear stiffness was significantly higher in NASH patients (15.68±7.70% vs. 9.04±6.96%, 3.48±1.61kPa vs. 2.24±0.31kPa, p=0.0276, p=0.0182, respectively), while attenuation and damping ratio was significantly lower (7.60±3.41m-1 vs. 12.37±3.27m-1, 0.06±0.04 vs. 0.12±0.05, p=0.0011, p=0.0029, respectively). However, T1 value didn’t show significant changes (Figure 2). We found that both the fat fraction and T1 value correlate well with steatosis (p=0.0010, p=0.0041, respectively), moreover, the fat fraction can differentiate varying steatosis score (p=0.0459). T1 mapping had a good correlation with fat fraction (ρ=0.72, p=0.0005), while the other parameters didn’t (Figure 3). Figure 4 demonstrates that both shear stiffness and attenuation can distinguish inflammation at early stage (p=0.0277, p=0.0165, respectively), while fat fraction and T1 mapping had no significant changes. Figure 5 illustrates that fat fraction, attenuation, and T1 mapping were sensitive to hepatocellular ballooning (p<0.0001, p=0.0173, p=0.0084, respectively), while shear stiffness and damping ratio were not.Discussion
As expected, in the natural history of NAFLD progression fat fraction had excellent agreements with the steatosis changes and hepatocellular ballooning. We observed that shear stiffness and attenuation had significant changes when there was lobular inflammation, which were consistent with previous findings4. Our results showed that attenuation was also sensitive to ballooning (p=0.0173). MRE provides independent biomarkers for detecting inflammation and fibrosis respectively, even with coexisting steatosis (no correlations between MRE and PDFF). It echoes our previous findings well. On the contrary, T1 value had a good correlation with fat fraction (ρ=0.72, p=0.0005), when distinguishing steatosis and ballooning, so they may not be independent parameters. A limitation of this study cohort was that the histologic readings were clustered in either the very early or end stages of liver diseases. We will enroll more patients to obtain better distribution of NASH severity. Our future work will include: 1) a longitudinal study to evaluate the capability of multi-parametric MRI/MRE in monitoring disease regression in response to interventional therapies; 2) further validation of multi-parametric MRI diagnostic ability in patients with different etiologies, such as alcoholic hepatitis (AH) or viral hepatitis (HCV, HBV) or combinations of both.Conclusion
Multi-parametric MRI is very promising for diagnosing NASH with quantified hepatic steatosis, lobular inflammation, and hepatocellular ballooning. As an ongoing study, we will include more clinical data to form a sophisticated statistical prediction model for NASH diagnosis.Acknowledgements
This research was funded by NIBIB grants EB017197 (M.Y) and EB001981 (R.L.E)References
1. Henry R. Wilman. Characterisation of liver fat in the UK Biobank cohort. PLoS One. 2017;12(2).
2. Michael Pavlides. Multiparametric magnetic resonance imaging for the assessment of non‐alcoholic fatty liver disease severity. Liver International. 2017;37(7): 1065-1073
3. Meng Yin. Assessment of Nonalcoholic Fatty Liver Disease (NAFLD) Activity Score (NAS) with MR Elastography (MRE). Proceedings of ISMRM 2017.
4. Meng Yin. A New MR Elastography Parameter for Diagnosing Hepatic Fibrosis and Inflammation: Shear Attenuation. Proceedings of ISMRM 2017.
Figures