0236
Deletion of CRTC1 is associated with strong neuroenergetic dysfunctions in a mouse model of mood disorders.1Laboratory for Functional and Metabolic Imaging (LIFMET), Ecole Polytechnique Fédérale de Lausanne, Lausanne, Switzerland, 2Animal Imaging and Technology Core (AIT), Center for Biomedical Imaging (CIBM), Ecole Polytechnique Fédérale de Lausanne., Lausanne, Switzerland, 3Center for Psychiatric Neuroscience (CNP), Centre Hospitalier Universitaire Vaudois (CHUV), Lausanne, Switzerland, 4Department of Radiology, University of Geneva, Geneva, Switzerland, 5Department of Radiology, University of Lausanne, Lausanne, Switzerland
Synopsis
This project pursues a previous study presented at ISMRM1 which established an age- and brain region dependent neurochemical metabolic profile in a Crtc1-/- based mouse model of mood disorders. Here, we show that a decline in cerrebral lactate levels is a consistent and reliable endophenotype2 of Crtc1 deletion, and an indicator of neuroenergetic dysfunction in the dorsal hippocampus. The decline in brain lactate levels appears to arise from a measured reduction of glucose entering the brain.
Introduction
CRTC1 (CREB-regulated transcriptional coactivator 1) is a coactivator of the transcription factor CREB, and is predominantly expressed in the brain. CRTC1 plays an important role in brain plasticity, and its dysfunction has been implicated in many neurological disorders as degenerative and mood disorders3,4. Mice lacking the Crtc1 gene, show a depressive-like phenotype and have been proposed as a model for preclinical mood disorder studies5,6. We have shown that these animals have region and age dependent brain metabolic profile differences using 1H-MRS at 14.1 Tesla, suggesting neuroenergetic alterations. However, as total metabolic pools give only poor functional information, we combined proton spectroscopy, carbon spectroscopy, PET and molecular techniques to further decipher the biological substrate underlying these changes.Methods
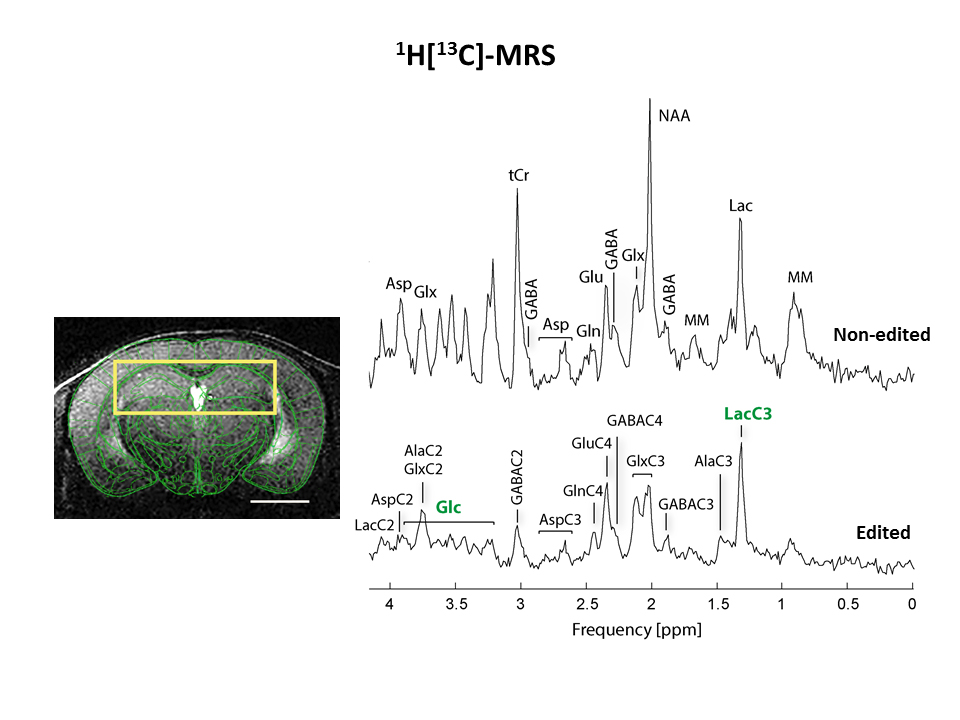
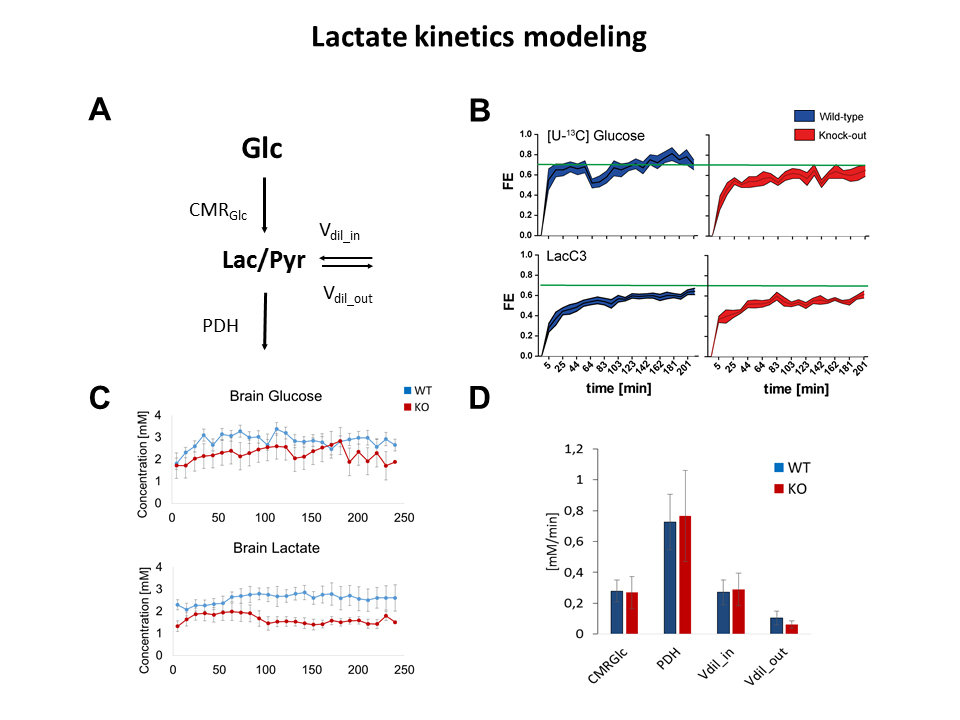
All animal studies were performed with the approval of the local animal care and use committee. Crtc1-/- animals (KO, n=7) and their countertypes (WT, n=7) were scanned at the age of 6 weeks after over-night fasting in a horizontal 14.T/26cm Varian magnet (Agilent Inc., USA), under isoflurane anesthesia (1-2%). T2-weighted FSE images (25×0.6mm slices, TEeff /TR=50/4000ms, nt=8) were acquired to localize the VOI for spectroscopy. Indirect carbon spectroscopy (1H[13C]-MRS) was performed in the bilateral dorsal hippocampus using a SPECIAL-BISEP sequence upon infusion of 70% enriched 20% (w/v) [U-13C6] glucose for 4 hours7. Spectra were frequency corrected and summed (nt=64/10min time point) for LCModel quantification using a homemade simulated basis set using the water signal as internal reference8. Fractional enrichment (FE) curves of glucose and lactate were fitted using MATLAB fitting toolbox, and the extracted parameters were used to solve the differential equations and find the glycolysis rate9. Brain glucose FE was used as an input function and was fitted to a step function. Blood lactate was assumed to be constant over time and equal to the final lactate blood concentration. The ratio Vdil_out/LacBrain was assumed to be constant and equal to Vdil_in/LacBlood. Longitudinal scans were performed in animals of 6 weeks and 12 weeks following behavioural despair paradigms. Spectroscopy was performed as previously described in the mornings1. Non-invasive, dynamic 18FDG PET was performed as previously described10. Gene expression and mitochondrial mass measurement was performed using qPCR of brain tissue punches in naïve animals.Results
1H[13C]-MRS in dorsal hippocampi allowed us to measure enrichment of main brain metabolites with a 10min time resolution (Fig1). Fractional enrichment (FE) curves as well as total concentration of glucose and lactate were lower in KO animals but the resulting glycolysis flux was not affected (Fig2). This can suggest reduced glucose uptake rather than breakdown. Given the impossibility to collect blood during infusion, physiological parameters were measured before and after the scan. These parameters revealed no difference between groups (lactate after infusion WT:7.9±0.9mM-KO:7.7±1.0mM/ glucose after infusion: WT: 31.6±10.8mM-KO: 28.4±13.5mM). Breathing rate(71±2bpm), rectal temperature(36.1±0.1°C) and isoflurane dose were similar between animals during the experiment.
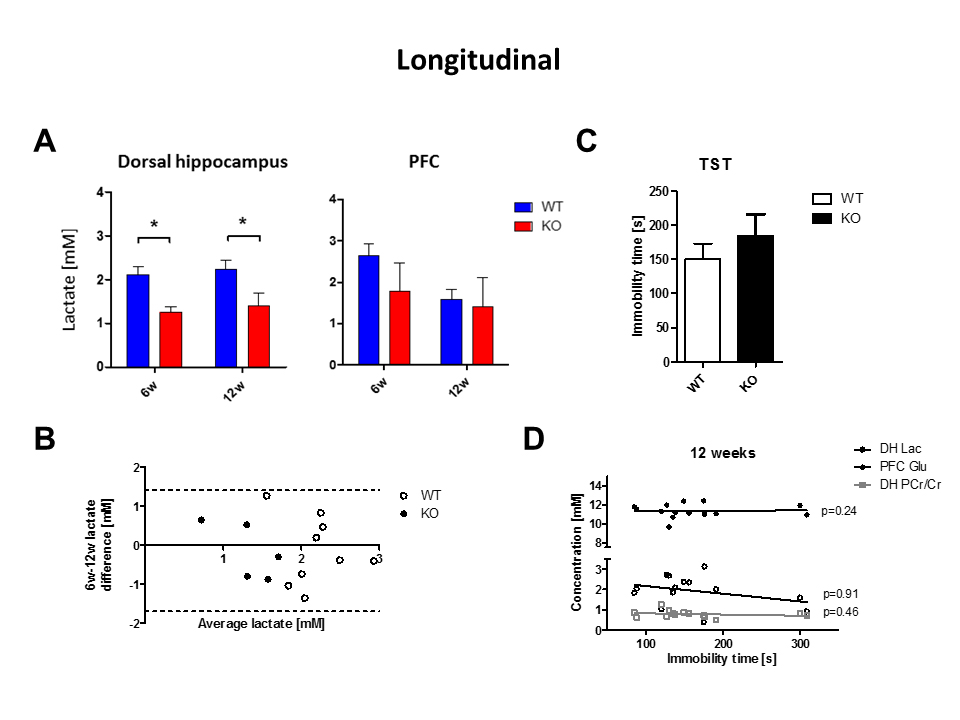
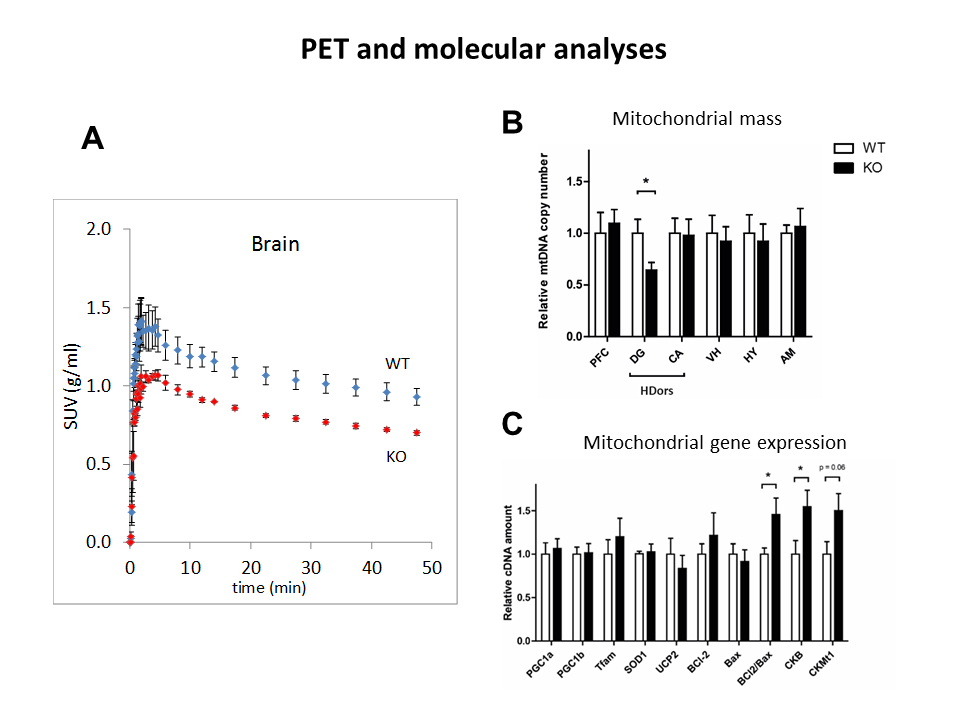
The observed drop of lactate was demonstrated again in a longitudinal protocol, where this decrease was found in KO at both 6 (-41%, p=0.002) and 12 weeks (-38%, p=0.04) of age in the dorsal hippocampus (Fig3A-B). The amount of lactate did not correlate with the immobility in behavioral despair paradigms, suggesting lactate might not be a marker of depressive-like behavior but rather a marker of susceptibility to develop such phenotype (Fig3C-D). The accumulation curves of 18FDG in the brain as 18FDG is extracted from the blood and trapped intracellularly as 18FDG-6P showed a decrease in glucose entry and glucose phosphorylation in Crtc1-/- mice relative to age-matched cohorts (Fig4A). Mitochondrial health was investigated using a molecular approach, which indicated a reduced mitochondrial mass in the dentate gyrus as well as increased creatine kinases expression. This is in agreement with PCr/Cr level differences reported previously suggesting lower mitochondrial power (Fig4B-C).
Discussion
Our results suggest that CRTC1 plays a critical role in regulating brain neuroenergetics, most likely by impacting the glucose entry in the brain. Lactate concentration failed to correlate with the depressive-like phenotype of the KO animals, which can be explained by the fact that Crtc1 KO animals respond to behavioral despair paradigms mostly upon chronic stress exposure. Previous studies have shown that lactate level in the brain is an important parameter in depression11. Our results suggest that brain lactate could thus be a marker of susceptibility to develop depression rather than a marker of depression itself. Further investigations of mitochondrial metabolic activity, gene expression and behavioral protocols will give further insights into the potential of lactate as a biomarker and the associated molecular mechanisms. This can provide potential improvement of diagnosis and treatment selectionAcknowledgements
This work was supported by the CIBM of the UNIL, UNIGE, HUG; CHUV, EPFL and Leenaards and Louis-Jeantet Foundations.References
1. Cherix, et al. Proc. Intl. Soc. Mag. Reson. Med. 23 (2015). 2. Lenzenweger, J Depress Anxiety, 30 (2013). 3. Xue, et al. Acta physiologica Sinica (2015). 4. Quteineh, et al. J Affect. Disord. (2016). 5. Breuillaud, et al. Biol. Psy, 72 (2012). 6. Breuillaud, et al. Nat. Med, 15, author reply 991 (2009). 7. Xin et al. JCBFM (2015) 8. Provencher, NMR Biomed. 14 (2001). 9. Gruetter et al. Am J Physiol Endocrinol Metab 281 (2001) 10. Seyer et al., J Clin Invest. 123 (2013). 11. Murrough, et al. NMR Biomed. 23 (2010).Figures