0234
Abnormal Perfusion and Perfusion fluctuation in Bipolar Disorder measured by ASL1State University of New York at Binghamton, BINGHAMTON, NY, United States, 2Department of Radiology, Beth Israel Deaconess Medical Center and Harvard Medical School, Boston, MA, United States, 3Department of Psychiatry, Beth Israel Deaconess Medical Center and Harvard Medical School, Boston, MA, United States
Synopsis
We aim to investigate whether dynamic perfusion image time series instead of static perfusion image can offer extra insight to bipolar disorder (BD). Average perfusion and perfusion fluctuation maps were compared between patients with BD and controls using customized Statistical non-Parametric Mapping (SnPM). Perfusion decrease in the posterior lateral regions of the default mode network and increase of perfusion fluctuations in the parahippocampus and amygdala regions were observed. The abnormal perfusion fluctuations may be supported by perturbed functional connectivity at the same regions. These results indicate that dynamic perfusion image series may serve as potential novel neuroimaging biomarkers for BD.
Introduction
Bipolar disorder (BD) is a serious mental illness. The underlying causes of bipolar disorder are still unclear. Cardiovascular disease (CVD) and atherosclerosis are compromised early in the course of BD [1, 2] and in fact have been identified as the leading cause of excessive death in BD [3]. Given the increased risk for cardiovascular problems in BD, it is also of interest to understand how cerebrovascular function may differ in those with the disorder. Investigating perfusion may elucidate the contribution of neurovascular health to BD. Studies investigating perfusion using positron emission tomography (PET) and single photon emission computed tomography (SPECT) have reported reduced perfusion in BD patients in frontal, parietal and temporal cortical and subcortical regions [4-6]. Here, we use the pseudo-continuous arterial spin labeling (PCASL) [7] to study dynamic 3D perfusion image time series for investigating whether the rest perfusion and perfusion fluctuation amplitudes across the time are compromised in BD patients.Methods
Forty-five subjects (20 BD patients, 25 controls) were imaged on a GE 3 Tesla scanner using an 8-channel head coil receive array. The scan included T1-weighted magnetization prepared rapid gradient echo (MPRAGE) images covering the whole brain and resting state PCASL acquisitions [8]. Twenty-seven 3D ASL volumes were collected in 9 minutes. Each PCASL image was acquired with a 3D stack of spirals RARE sequence. Each ASL volume requires two spiral interleaves and control-label pairs with the total time of 9 s.
ASL perfusion image time series were head-motion corrected and normalized to the standard template space using SPM8. The first 3D ASL volume was removed for increased stability. For each subject, the average perfusion image was quantified from the average image across the 26 time points, the perfusion fluctuation was calculated as the voxel-wise standard deviation image across the time points and then divided by the averaged global perfusion. Customized Statistical non-Parametric Mapping (SnPM) was used to compare the difference of average perfusion and perfusion fluctuation maps between BD patients and controls. In the SnPM analysis, perfusion and perfusion fluctuation maps were first globally normalized and then modeled as a multiple linear regression on a voxel-by-voxel basis. The disease state (0 for controls, 1 for BD patients) was used as the only variable. One-thousand random permutations were performed on the disease state (either BD or control). For each permutation, a voxel-level p-value threshold of 0.01 was chosen to define clusters first and then the largest supra-threshold cluster size was calculated. Largest cluster sizes from all 1000 permutations were used to calculate the empirical distribution in order to correct for multiple comparisons among voxels. The maximum t values from all 1000 permutations were used as another measure to correct for the multiple comparisons. The cutoff cluster size and t-value threshold with family-wise error (FWE) of 5% was derived. The correlation of perfusion or perfusion fluctuations with cognitive measures are in progress.
Results & Discussions
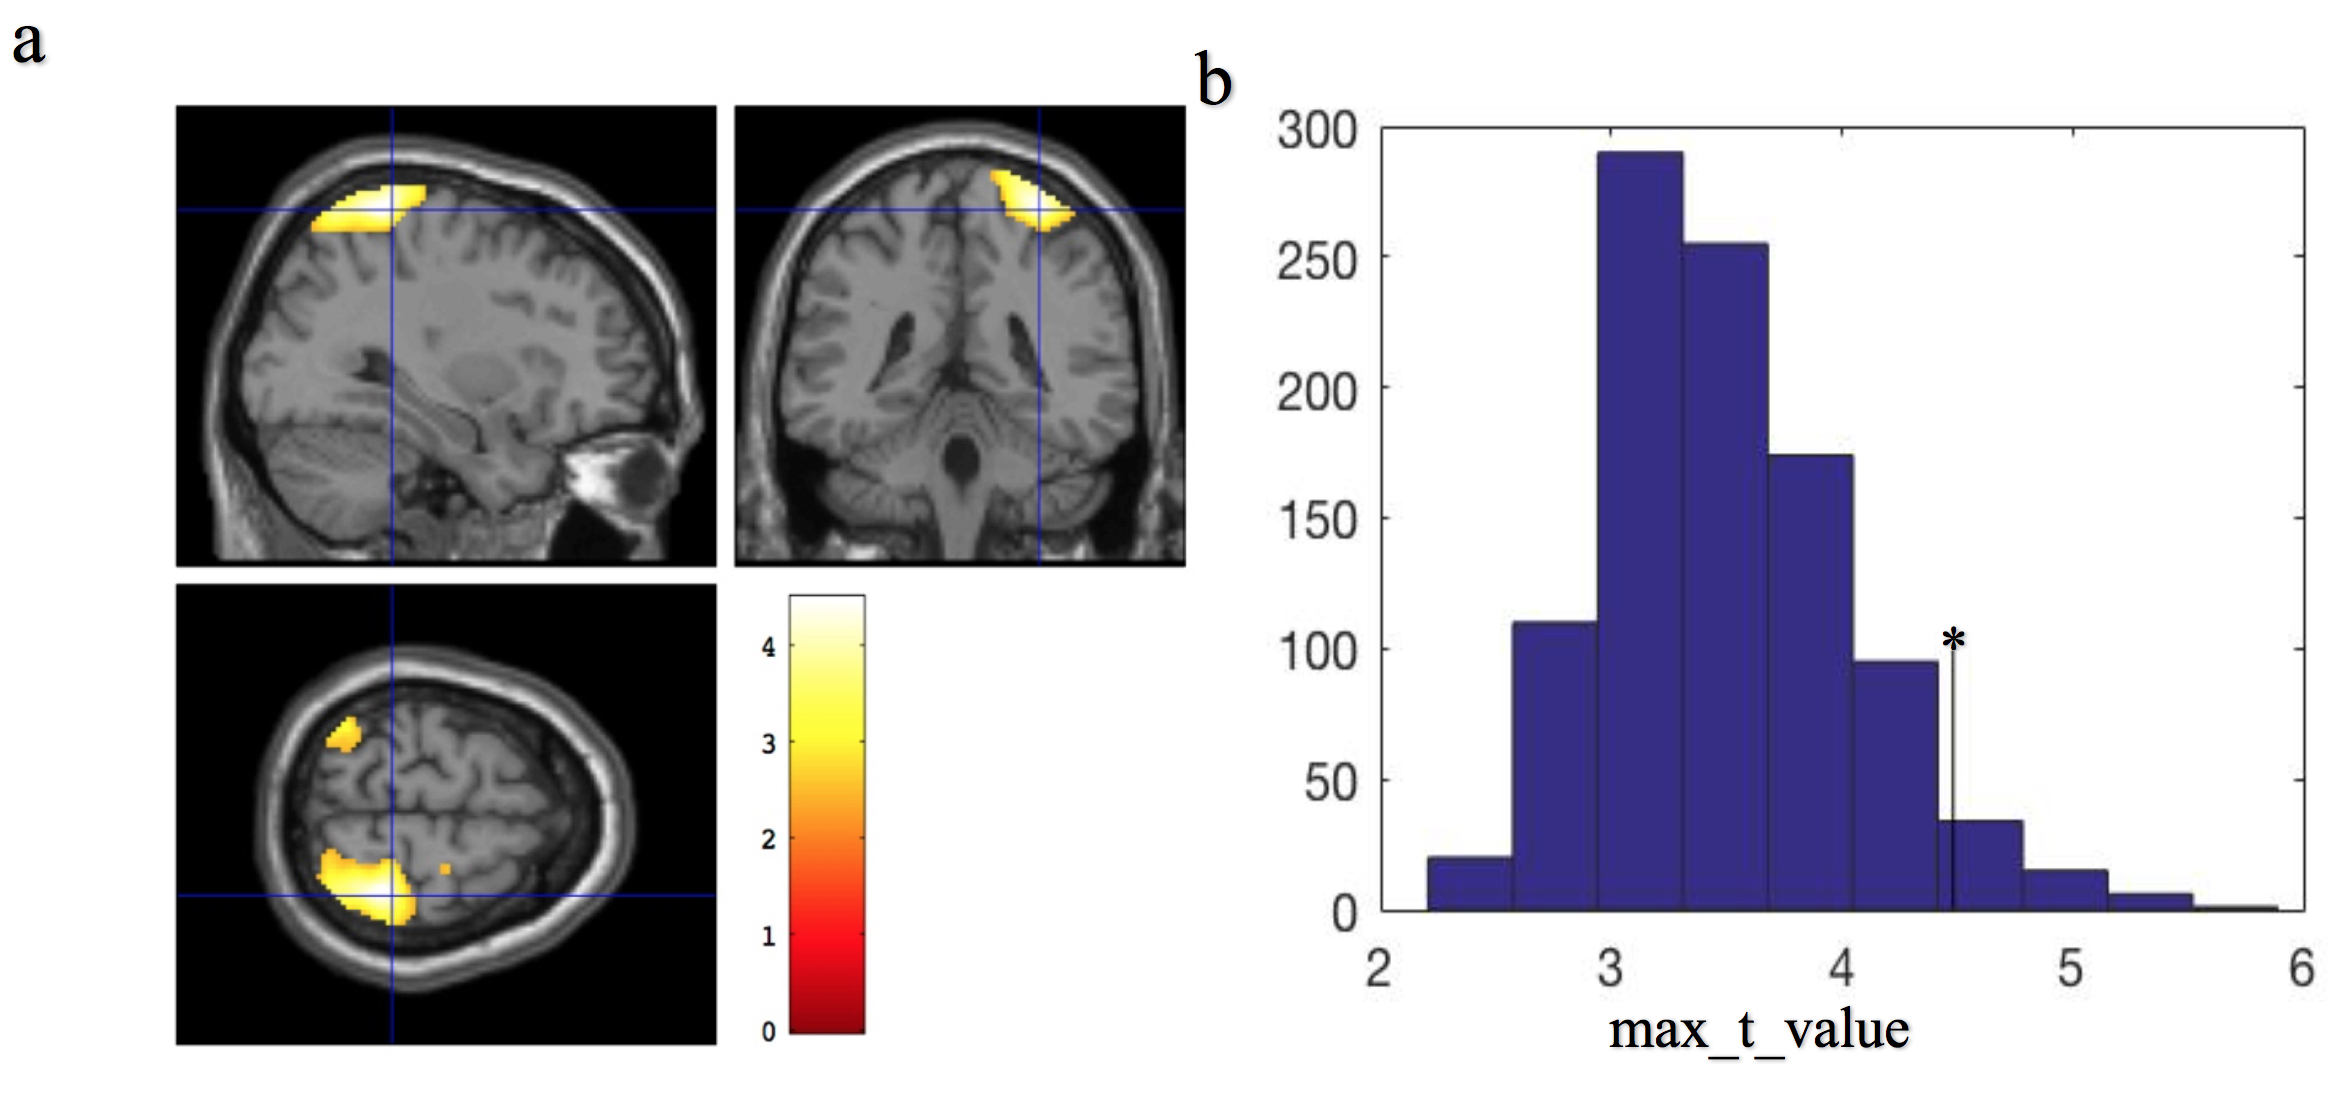
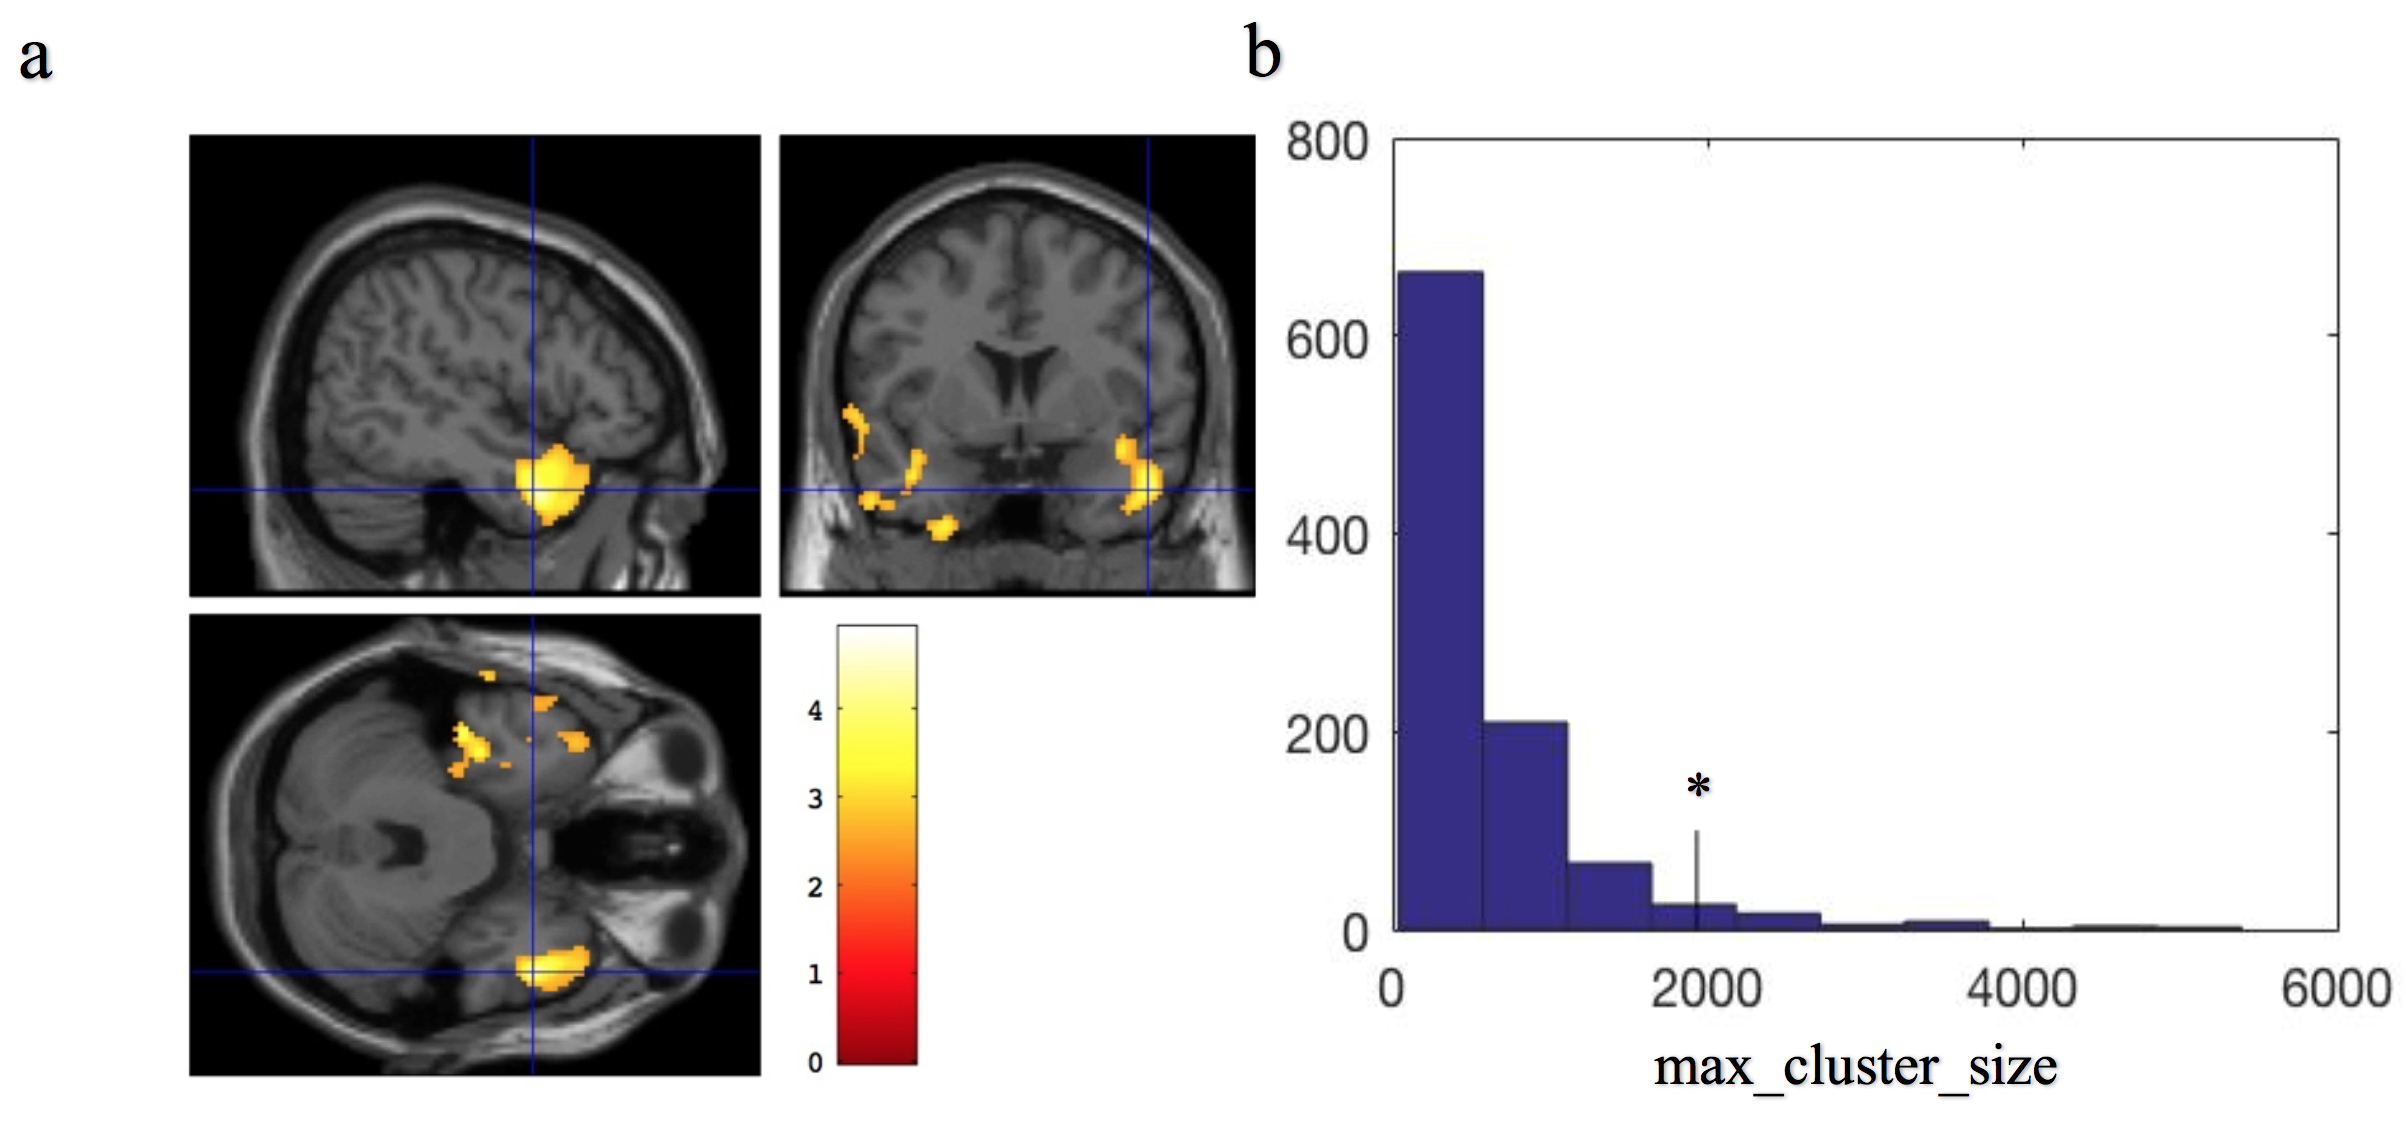
We observed significant perfusion decrease in the posterior lateral regions of the default mode network (DMN) (see Fig. 1a). The t value cutoff threshold from SnPM was 4.63, derived from FWE of 5% maximum t distributions (Fig. 1b). We also observed significant increase of perfusion fluctuations in the parahippocampus and amygdala regions (see Fig. 2a). The cutoff cluster size with FWE of 5% from SnPM was 1800 voxels (Fig. 2b). The observed region with reduced perfusion is consistent with a decreased perfusion in the parietal region found using PET and SPECT [4-6]. The compromised perfusion region is also consistent with abnormal functional connectivity found in the parietal region of DMN for BD patients [9]. The abnormal perfusion fluctuations in the parahippocampus and amygdala regions have never been studied before. However, evidence of perturbed amygdala and parahippocampus functional connectivity has been shown for BD [10, 11]. If confirmed to correlate with cognitive measures, perfusion and perfusion fluctuation, derived together from resting-state ASL time series, may serve as neuroimaging biomarkers for bipolar disorder.Acknowledgements
No acknowledgement found.References
1. Sodhi SK, Linder J, Chenard CA, Miller del D, Haynes WG, and Fiedorowicz JG, Evidence for accelerated vascular aging in bipolar disorder. J Psychosom Res, 2012;73(3):175-9.
2. Migliorini M, Mendez MO, and Bianchi AM, Study of Heart Rate Variability in Bipolar Disorder: Linear and Non-Linear Parameters during Sleep. Front Neuroeng, 2011;4:22.
3. Weiner M, Warren L, and Fiedorowicz JG, Cardiovascular morbidity and mortality in bipolar disorder. Ann Clin Psychiatry, 2011;23(1):40-7.
4. Bhardwaj R, Chakrabarti S, Mittal BR, and Sharan P, A single photon emission computerized tomography (SPECT) study of regional cerebral blood flow in bipolar disorder. World J Biol Psychiatry, 2010;11(2 Pt 2):334-43.
5. Culha AF, Osman O, Dogangun Y, Filiz K, Suna K, Kalkan ON, Gulfizar V, and Beyza A, Changes in regional cerebral blood flow demonstrated by 99mTc-HMPAO SPECT in euthymic bipolar patients. Eur Arch Psychiatry Clin Neurosci, 2008;258(3):144-51.
6. Deckersbach T, Dougherty DD, Savage C, McMurrich S, Fischman AJ, Nierenberg A, Sachs G, and Rauch SL, Impaired recruitment of the dorsolateral prefrontal cortex and hippocampus during encoding in bipolar disorder. Biol Psychiatry, 2006;59(2):138-46.
7. Dai W, Garcia D, de Bazelaire C, and Alsop DC, Continuous flow-driven inversion for arterial spin labeling using pulsed radio frequency and gradient fields. Magn Reson Med, 2008;60(6):1488-97.
8. Dai W, Varma G, Scheidegger R, and Alsop DC, Quantifying fluctuations of resting state networks using arterial spin labeling perfusion MRI. J Cereb Blood Flow Metab, 2016;36(3):463-73.
9. Ongur D, Lundy M, Greenhouse I, Shinn AK, Menon V, Cohen BM, and Renshaw PF, Default mode network abnormalities in bipolar disorder and schizophrenia. Psychiatry Res, 2010;183(1):59-68.
10. Rich BA, Fromm SJ, Berghorst LH, Dickstein DP, Brotman MA, Pine DS, and Leibenluft E, Neural connectivity in children with bipolar disorder: impairment in the face emotion processing circuit. J Child Psychol Psychiatry, 2008;49(1):88-96.
11. Cerullo MA, Fleck DE, Eliassen JC, Smith MS, DelBello MP, Adler CM, and Strakowski SM, A longitudinal functional connectivity analysis of the amygdala in bipolar I disorder across mood states. Bipolar Disord, 2012;14(2):175-84.
Figures