0229
Neural network classification of ADHD based on white matter connectograms derived from diffusion spectrum imaging1Institute of Medical Device and Imaging, National Taiwan University College of Medicine, Taipei, Taiwan, 2Graduate Institute of Brain and Mind Sciences, National Taiwan University College of Medicine, Taipei, Taiwan, 3Department of Psychiatry, National Taiwan University Hospital, Taipei, Taiwan, 4Molecular Imaging Center, National Taiwan University, Taipei, Taiwan
Synopsis
The diagnosis of ADHD relies on psychiatrists’ knowledge and subjective experience. Many studies aimed to develop an objective method to assist diagnosis, but the performance of classification between ADHD and controls was not acceptable for clinical use. Here, we proposed a neural network model based on white matter information to classify ADHD and typically developing controls. Diffusion spectrum imaging and tract-based automatic analysis were used to measure properties of white matter. The neural network classification model was developed with high accuracy in the training and test data. It might be helpful to provide an objective way for diagnosis of ADHD.
Introduction
Attention deficit hyperactivity disorder (ADHD), which affects at least 5 to 7% of school-age children and adolescents[1], has a significant impact on patients’ lives. To date, the diagnosis of ADHD is mainly subjective and relies on the psychiatrists’ experience. Although many efforts recently have been made to investigate the utilization of structural and functional brain images for objective diagnosis purpose, the classification rate of ADHD and controls still remained low[2, 3]. To our knowledge, white matter abnormalities and reduced integrity were found in ADHD patients by using diffusion MRI techniques[4, 5]. Therefore, in this study, we proposed a neural network model to classify ADHD patients and controls based on white matter integrity and expected the model was accurate enough to serve as a computer-aided diagnostics.Materials and Methods
Subjects: 84 ADHD patients (mean age: 10.7 ± 2.51, 61 males) and 88 typically developing (TD) controls (mean age: 11.1 ± 2.34, 64 males) were recruited in the study. The diagnosis of ADHD was performed by a senior psychiatrist in National Taiwan University Hospital.
Image acquisition: T1-weighted imaging and diffusion spectrum imaging (DSI) were acquired on a 3T MRI system (TIM Trio, Siemen). T1-weighted imaging utilized a MPRAGE pulse sequence (TR = 2000 ms, TE = 3 ms, flip angle = 9o, FOV = 256 X 192 X 208 mm2, resolution = 1 X 1 X 1 mm3). DSI utilized a pulsed gradient twice-refocused spin-echo diffusion echo planar imaging sequence using 102 diffusion encoding gradients with the maximum diffusion sensitivity bmax of 4000 s/mm2 (TR = 9600 ms, TE = 130 ms, FOV = 200 X 200 mm2, matrix size = 80 X 80, slice thickness = 2.5 mm).
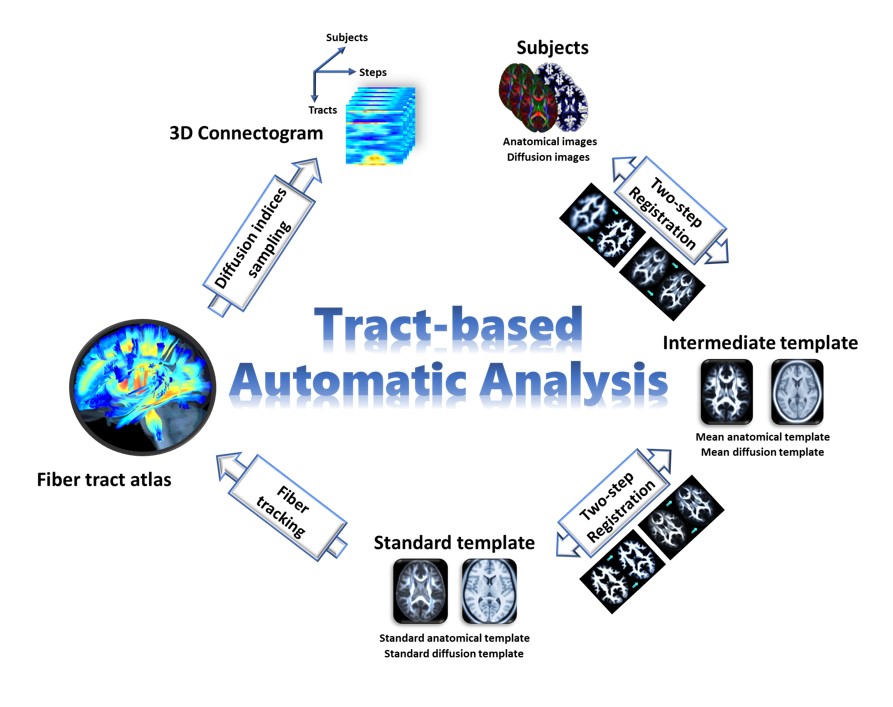
Data analysis: Mean apparent propagator (MAP)-MRI framework[6] was used to reconstruct diffusion-weighted images into 7 diffusion indices, namely generalized fractional anisotropy, axial diffusivity, radial diffusivity, mean diffusivity, non-Gaussianity (NG), NG orthogonal, and NG perpendicular. Whole brain tract-based automatic analysis (TBAA)[7] was implemented to obtain 3D-connectograms of the 7 diffusion indices. X, Y and Z axes of the 3D-connectogram indicate 76 pre-defined tract bundles, number of steps along each tract bundle and number of subjects, respectively (Figure 1).
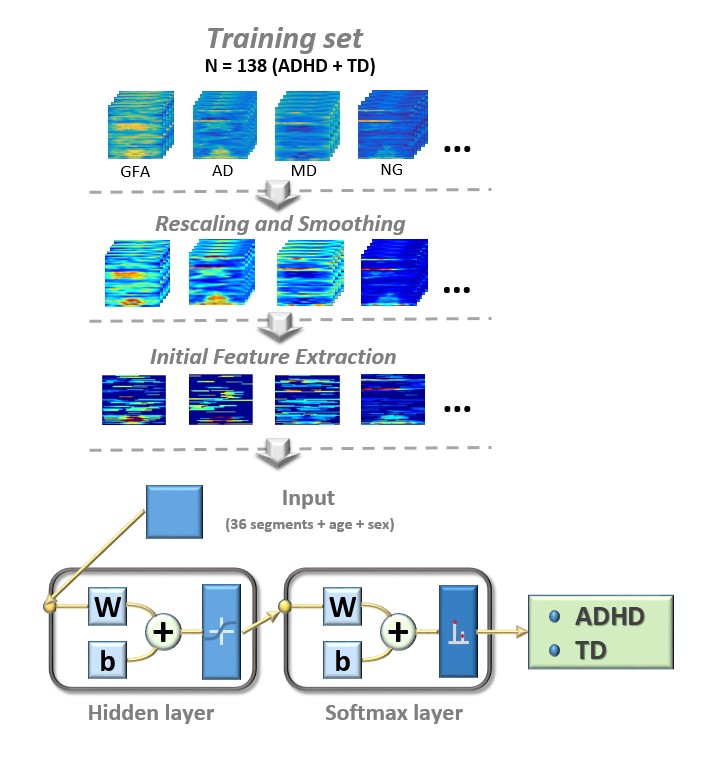
Model estimation: The total 172 subjects were randomly divided into training (N = 138) and test (N = 34) sets. Both sets contained equal proportion of ADHD/TD controls. First, the connectograms from the training set and test set went through preprocessing of rescaling and spatial smoothing. Second, to extract preliminary group-distinguished features, general linear models were estimated on each step of the connectograms in the training set using age, sex and group factor as the independent variables. Continuous steps with significant group difference on the connectograms (criteria: critical value = 0.001 and cluster size larger than 10 steps) were selected and transformed into segments. Third, to create the classification model, 36 selected segments, age and sex factors were inputted into a two-layer feedforward neural network (Figure 2). The neural network with 10 sigmoid hidden neurons and softmax layer was trained with scaled conjugate and gradient propagation. The framework of neural network was implemented by Neural Network Toolbox in Matlab v9.2. Hold-out validation (Training/Validation = 7/1) was used to validate the performance of neural network. Finally, accuracy, sensitivity and specificity were calculated to evaluate the performance of the training and test sets.
Results
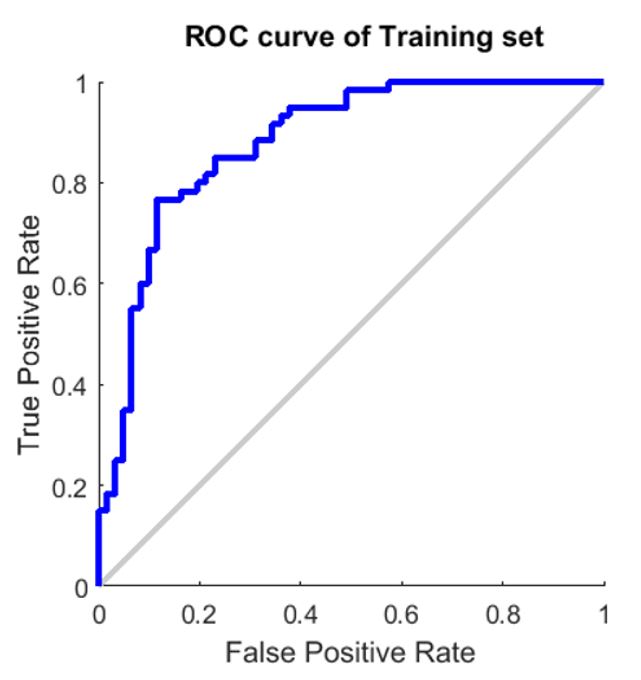
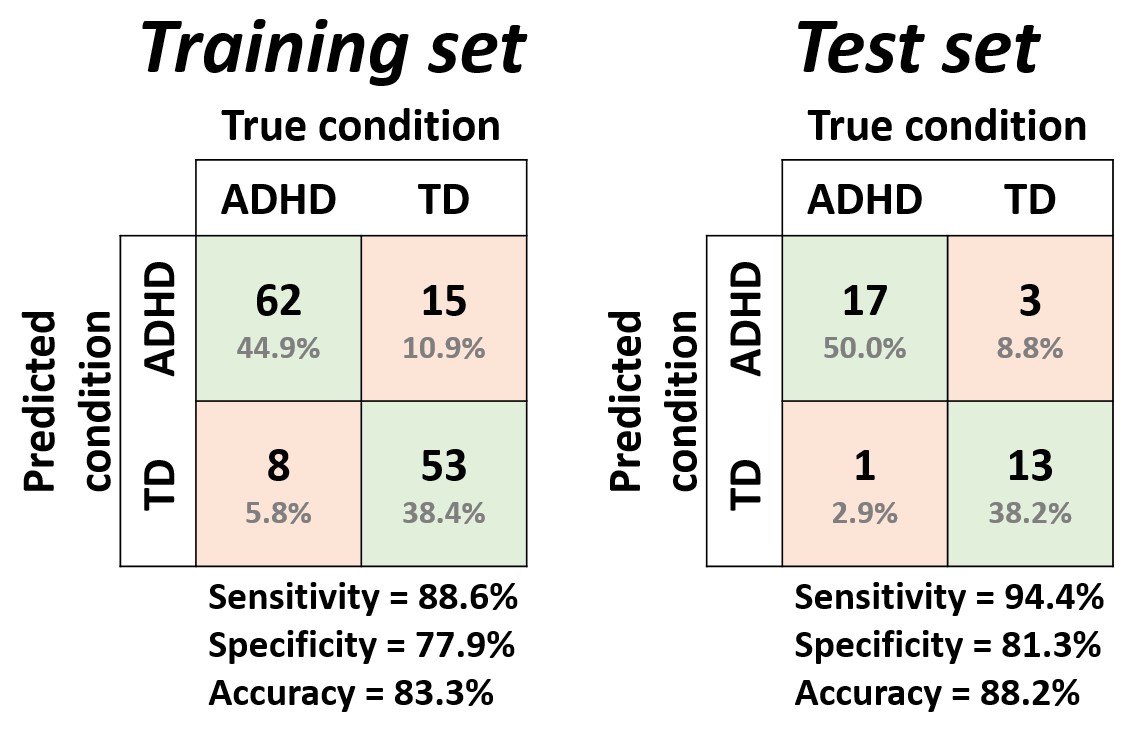
The receiver-operating-characteristics (ROC) curves were visualized to demonstrate the performance of the training model (Figure 3). The accuracy, sensitivity and specificity in the training set were 83.3%, 88.6% and 77.9%, respectively (Figure 4, left). In the result of the test set, the accuracy, sensitivity and specificity were 88.2%, 94.4% and 81.3%, respectively (Figure 4, right).Discussion
We have developed a neural network model to classify ADHD patients and TD controls based on white matter connectograms. This model achieved high accuracy and sensitivity in both training and test sets, enabling classification on individual basis. It might be helpful in assisting clinical diagnosis of ADHD.Acknowledgements
No acknowledgement found.References
1. Willcutt, E.G., The prevalence of DSM-IV attention-deficit/hyperactivity disorder: a meta-analytic review. Neurotherapeutics, 2012. 9(3): p. 490-9.
2. Colby, J.B., et al., Insights into multimodal imaging classification of ADHD. Front Syst Neurosci, 2012. 6: p. 59.
3. Dai, D., et al., Classification of ADHD children through multimodal magnetic resonance imaging. Front Syst Neurosci, 2012. 6: p. 63.
4. Hamilton, L.S., et al., Reduced white matter integrity in attention-deficit hyperactivity disorder. Neuroreport, 2008. 19(17): p. 1705-8.
5. Silk, T.J., et al., White-matter abnormalities in attention deficit hyperactivity disorder: a diffusion tensor imaging study. Hum Brain Mapp, 2009. 30(9): p. 2757-65.
6. Ozarslan, E., et al., Mean apparent propagator (MAP) MRI: a novel diffusion imaging method for mapping tissue microstructure. Neuroimage, 2013. 78: p. 16-32.
7. Chen, Y.J., et al., Automatic whole brain tract-based analysis using predefined tracts in a diffusion spectrum imaging template and an accurate registration strategy. Hum Brain Mapp, 2015. 36(9): p. 3441-58.
Figures