0227

7T MRS in First Episode Psychosis: Neurotransmitter Deficits and Neuronal Impairment
Anna Min Wang1,2, Subechhya Pradhan1,2, Akira Sawa3, and Peter B. Barker1,2

1Department of Radiology and Radiological Science, Johns Hopkins University School of Medicine, Baltimore, MD, United States, 2Kennedy Krieger Institute, Baltimore, MD, United States, 3Department of Psychiatry, Johns Hopkins University School of Medicine, Baltimore, MD, United States

Synopsis

The results of a 7T MRS study of a large cohort of patients with a first episode of psychosis (FEP) and healthy control subjects (HC) are reported. In patients with FEP, significant reductions in the neurotransmitters glutamate and GABA were found in selected gray matter regions, and the neuromodulator NAAG was reduced in white matter. Other metabolic abnormalities were reduced NAA (suggesting neuroaxonal damage) and glutathione. Metabolite differences were also found to depend on diagnosis. This study suggests that 7T MRS is a useful modality for understanding the molecular pathophysiology of psychosis.

Purpose

MR spectroscopy (MRS) offers a non-invasive window into the neurochemical changes associated with psychosis. MRS at 7T offers improved sensitivity and accuracy of detection of more compounds than at lower field strengths, However, to date there have been few MRS studies of psychosis using 7T, or in the critical early stages of the disease (1, 2). The purpose of this study was therefore to investigate brain biochemical changes using the short TE 7T MRS in a large cohort of patients with a first episode of psychosis (FEP) and age-matched healthy control (HC) subjects.

Methods

Subjects: 81 FEP patients (22.4±4.4 y.o., 57 males) and 92 HC subjects (23.3±3.9 y.o., 42 males) were recruited. All FEP patients were scanned within the first two years of disease onset and were on antipsychotic medication. FEP patients were classified into sub-groups according to diagnosis, including schizophrenia (SZ, n = 54) (including schizophrenia (n=41), schizophreniform disorder (n=2) schizoaffective disorder (n=11)), bipolar disorder (BP, n = 18), and the remainder (n=9) as different forms of mood disorders or psychosis NOS (not otherwise specified). MR protocols: All participants were scanned using a 7T scanner (Philips ‘Achieva’, Netherlands) with a 32-channel receive head coil. T1W images were acquired using an MPRAGE sequence (0.8 mm isotropic resolution). Spectra were recorded from bilateral thalamus (THAL, 20×30×15 mm3), left orbitofrontal cortex (OFC; 20×20×20 mm3), anterior cingulate cortex (ACC; 30×20×20 mm3), left dorsolateral prefrontal cortex (DLPFC; 25×20×20 mm3) and left centrum semiovale (CSO; 40×20×15 mm3) using a STEAM sequence (TE/TM/TR = 14/33/3000 ms, 128 NEX). VAPOR water suppression was used, and a water-unsuppressed reference was acquired from each voxel. Data Analysis: Spectra were analyzed in LCModel software and a basis set simulated using the ‘VESPA’ package. Metabolite concentrations were normalized using the unsuppressed water reference. Metabolite concentrations were only included in further statistical analyses when the corresponding Cramér-Rao lower bounds was below 20% except for lactate (Lac) and N-acetylaspartate-glutamate (NAAG) (<30%). MPRAGE images was segmented using ‘SPM8’ and gray matter, white matter (WM) and cerebrospinal fluid (CSF) fractions were calculated for each MRS voxel. Metabolite concentrations were CSF corrected except for Lac. Differences in the concentrations of γ-aminobuytric acid (GABA), glutamate (Glu), glutamine (Gln), glutathione (GSH), Lac (Lac), N-acetylaspartate (NAA) and NAAG between FEP and HC groups, as well as between SZ and BP sub-groups were compared using two-tailed unpaired t-test. False discovery rate (FDR) was used to correct for multiple comparisons. (significant when p<0.05)

Result

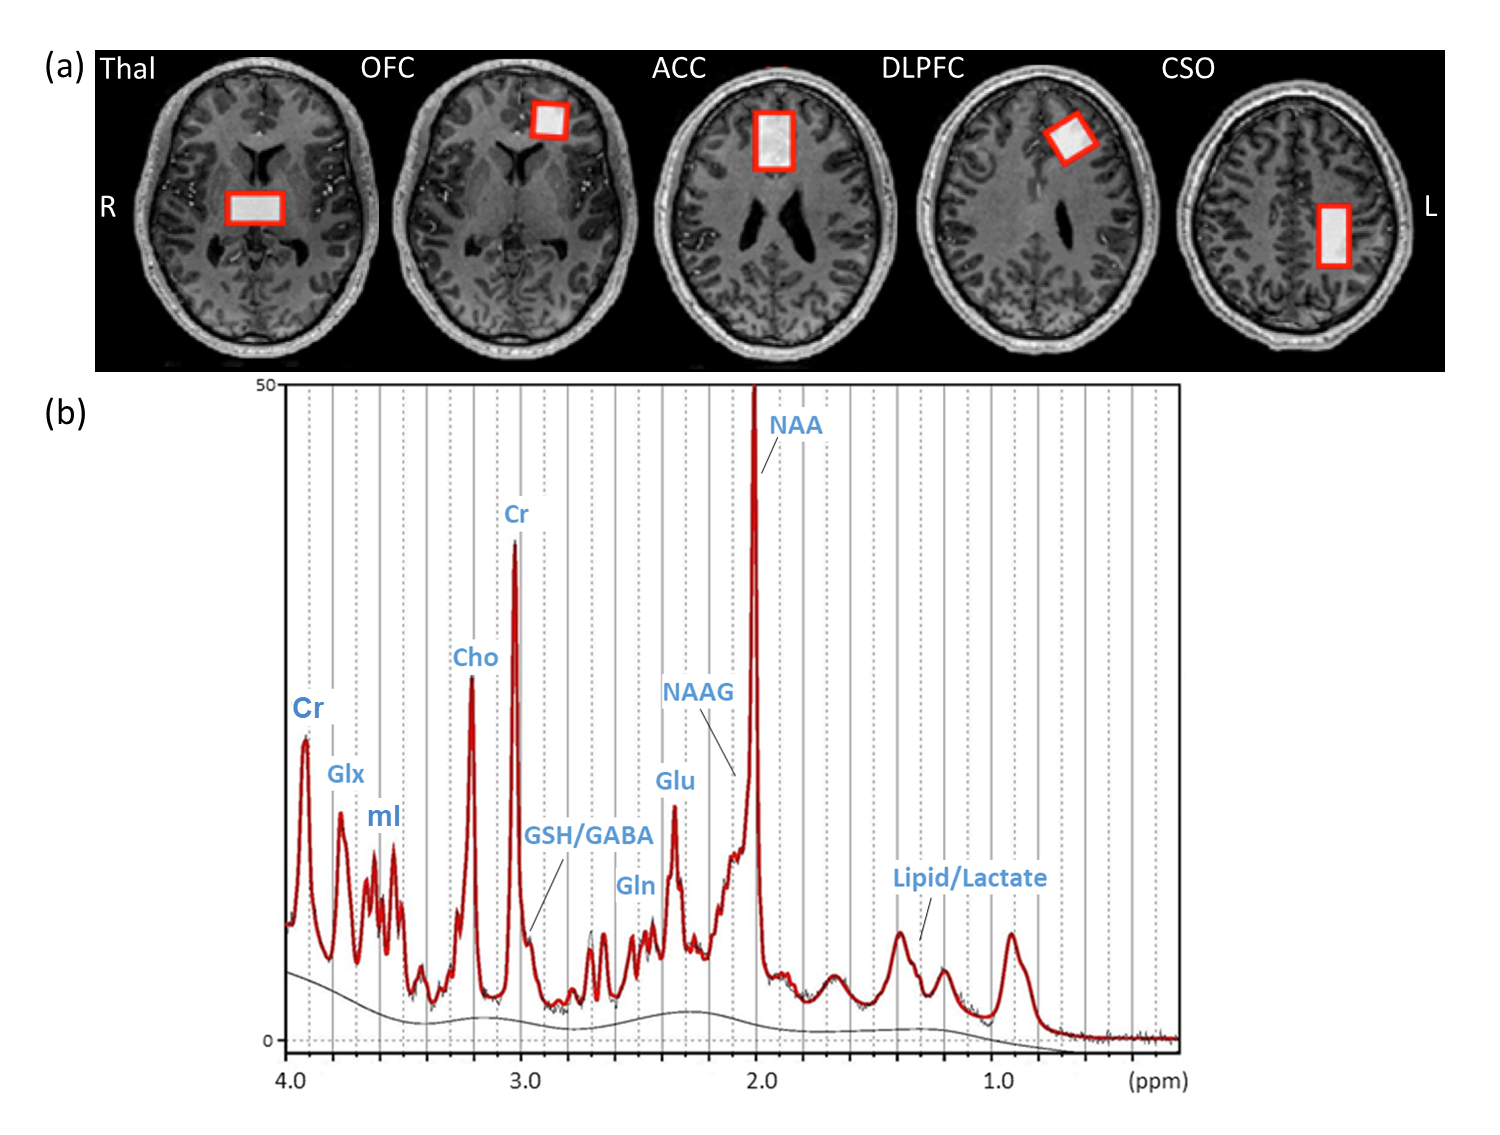
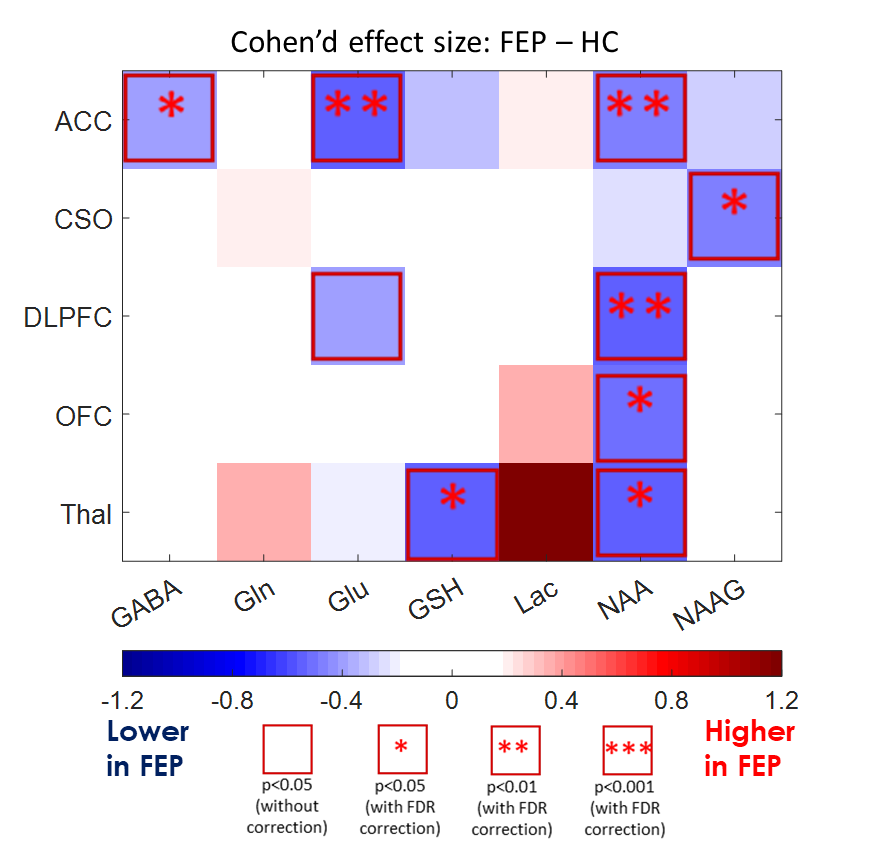
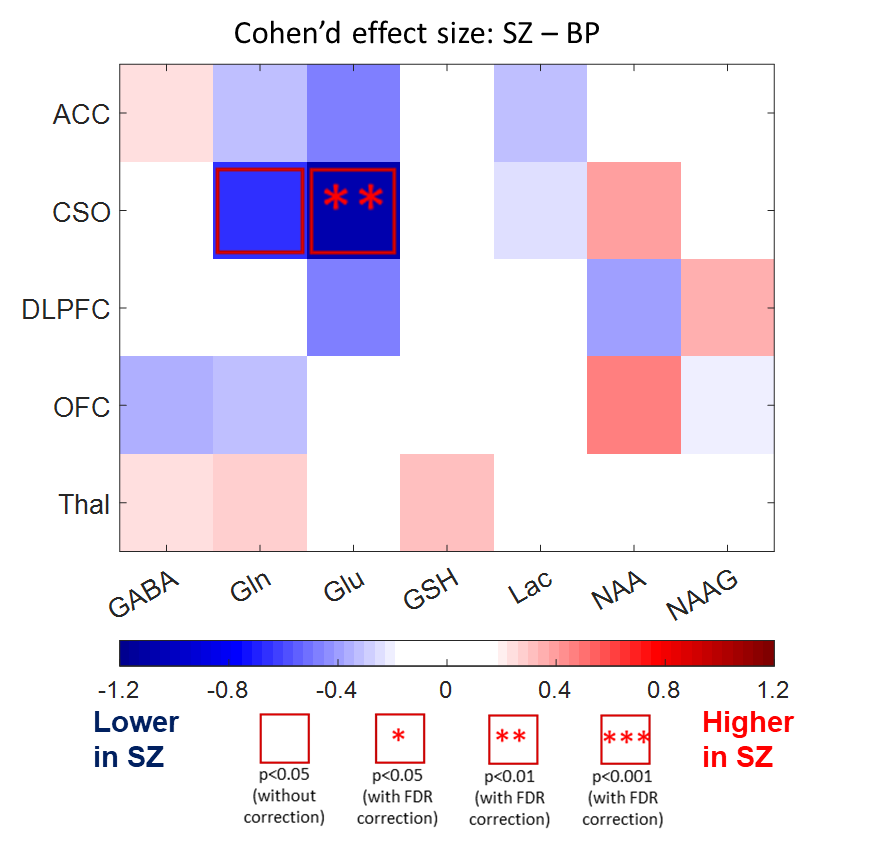
Figure 1a shows T1W images and voxel locations in a healthy control subject. A representative spectrum from the CSO with the LCModel fit is shown in Figure 1b. The concentrations of GABA and Glu in ACC, NAAG in CSO, NAA in ACC, DLPFC, OFC and Thal, as well as GSH in Thal were significantly decreased in FEP patients compared to HC (Figure 2). When comparing FEP metabolite concentrations between different diagnosis sub-groups, Glu was significantly lower in the CSO in SZ sub-group compared to BP (Figure 3).

Discussion

Reduced GABA and Glu in cortical regions, especially in the ACC, suggests involvement of the glutamatergic and GABAergic neurotransmitter systems in FEP (3, 4). NAAG is most abundant in WM, and the CSO voxel (~ 90% of WM) showed reduced levels of NAAG in FEP, again suggesting that the glutamatergic system is involved. The widespread decrease in NAA in FEP in multiple brain regions suggests that, even in the early stage of psychosis, there was already MRS detectable neuronal loss or damage while no significant tissue loss was detected in the T1W anatomical images (data not shown). In addition, the reduction of the GSH might be the indication of oxidative stress in FEP (5). The finding of reduced Glu in CSO in patients with diagnosis of SZ (compared to BP) is interesting in that it implies differential involvement of glutamatergic metabolism in these two diseases. In addition, prediction of disease type may allow for early effective treatment (6).

Conclusion

7T MRS in FEP revealed multiple metabolic changes in neuronal markers, neurotransmitters and other compounds; neuronal impairment is reflected by widespread NAA decreases, while the neurotransmitter systems abnormalities are suggested by reduced levels of Glu, GABA and NAAG. Differences in Glu between patients with a diagnosis of SZ and BP suggests differences in the underlying pathophysiology of these diseases, and may also be useful in making an early diagnosis and triaging patients to the most appropriate therapy at an earlier stage.

Acknowledgements

The authors acknowledge Mitsubishi-Tanabe Pharma. Co. Ltd. for the funding support.

References

1. Merritt K, Egerton A, Kempton MJ, Taylor MJ, McGuire PK. Nature of Glutamate Alterations in Schizophrenia: A Meta-analysis of Proton Magnetic Resonance Spectroscopy Studies. JAMA Psychiatry. 2016;73(7):665-74.

2. Thakkar KN, Rosler L, Wijnen JP, Boer VO, Klomp DW, Cahn W, et al. 7T Proton Magnetic Resonance Spectroscopy of Gamma-Aminobutyric Acid, Glutamate, and Glutamine Reveals Altered Concentrations in Patients With Schizophrenia and Healthy Siblings. Biol Psychiatry. 2017;81(6):525-35.

3. Stone JM, Morrison PD, Pilowsky LS. Glutamate and dopamine dysregulation in schizophrenia--a synthesis and selective review. J Psychopharmacol. 2007;21(4):440-52.

4. Lewis DA, Hashimoto T, Volk DW. Cortical inhibitory neurons and schizophrenia. Nat Rev Neurosci. 2005;6(4):312-24.

5. Fendri C, Mechri A, Khiari G, Othman A, Kerkeni A, Gaha L. Oxidative stress involvement in schizophrenia pathophysiology: a review. L'Encephale. 2006;32(2 Pt 1):244-52.

6. Patel KR, Cherian J, Gohil K, Atkinson D. Schizophrenia: overview and treatment options. Pharmacy and Therapeutics. 2014;39(9):638.

Figures

Figure 1. (a) T1W images from a healthy subject. Red boxes represent the MRS localization for the five brain regions. (b) Typical spectrum acquired from the CSO voxel from a HC subject.

Figure 2. Summary of metabolite concentration differences between FEP and HC groups. Statistically significant differences (p<0.05) are highlighted with one or more asterisks.

Figure 3. Metabolite concentration differences between patients with a diagnosis of SZ and BP. Statistically significant differences (p<0.05) are highlighted with an asterisk.

Proc. Intl. Soc. Mag. Reson. Med. 26 (2018)
0227