0226
Altered Brain Development in Infants and Young Children with at Risk Genetics for Psychiatric Dysfunction1Brown University Warren Alpert School of Medicine, Providence, RI, United States, 2Memorial Hospital, Brown University, Providence, RI, United States, 3Waisman Center, University of Wisconsin, Madison, WI, United States, 4Center for Neuroimaging, King's College, London, United Kingdom
Synopsis
Catechol-O-methyltransferase (COMT) polymorphisms have been implicated as an important contributor to psychosis and cognitive differences. Such cognitive alterations may have a neurodevelopmental basis, however, the effect of COMT polymorphisms on early brain development are unclear. Here, we perform the first longitudinal study of differential cortical maturation in infants and young children ages 1 to 6 based on COMT genotype. We demonstrate altered rates of cortical development in the cingulate, frontal and temporal lobes in children with the rs46480 (Val/Met) genotype, suggesting the COMT genotype has an important impact on brain maturation.
Introduction
Neurochemical modulation of brain development plays a critical role in understanding the earliest brain changes associated with psychiatric disease. Catechol-O-methyltransferase (COMT) is a critical enzyme involved in frontal and temporal lobe dopamine metabolism1. Specifically, the rs4680 Valine(Val)108/158 Methionine(Met) polymorphism (Val/Met) has been shown through convergent functional genomics to be a significant genetic variant correlated with an increased risk of schizophrenia2. One study examined cross-sectional analysis of infant brain structure and demonstrated reduced temporal lobe volume in Val/Met heterozygotes but increased parietal lobe volume in Val/Val homozygotes3. Cortical thickness increases have also been associated with increasing numbers of Met158 allele in adolescents4. While these studies provide insight into neuroanatomical differences that begin to emerge during infancy3 and later adolescent development4, they fail to consider longitudinal trajectories of infant and early childhood neurodevelopment where both cortical and subcortical structures undergo dynamic changes5,6.Purpose
In this work, we performed the first longitudinal analysis of differential brain development in healthy infants and young children (1 to 6 years of age) prior to onset of psychiatric illness and stratified by COMT rs4680 polymorphism.Methods
Longitudinal high-resolution T1-weighted images were obtained from 70 infants and young children (total of 99 imaging data sets), grouped according to COMT rs4680 polymorphism. Scanning sequences were based on standardized anatomical T1-weighted MP-RAGE7 images. COMT genotype was determined through PCR analysis of buccal cells and subjects were divided into three groups. Subjects recruited were between the ages of 1 year to 6 years and all data was acquired on a 3T Siemens Tim Trio scanner during non-sedated sleep or while watching a movie7. Advanced Normalization Tools bias correction was performed9, and cortical thickness and subcortical volume values were calculated and analyzed using Freesurfer (version 6.0)10. Non-linear mixed-effects models were used to characterize cortical development from 34 specific brain regions per hemisphere and 34 subcortical regions. Analysis consisted of generating mixed effects models of cortical thickness maturation through exploratory hypothesis testing of all 68 distinct brain regions. Significance was defined as p ≤.05 corrected for multiple comparisons.Results
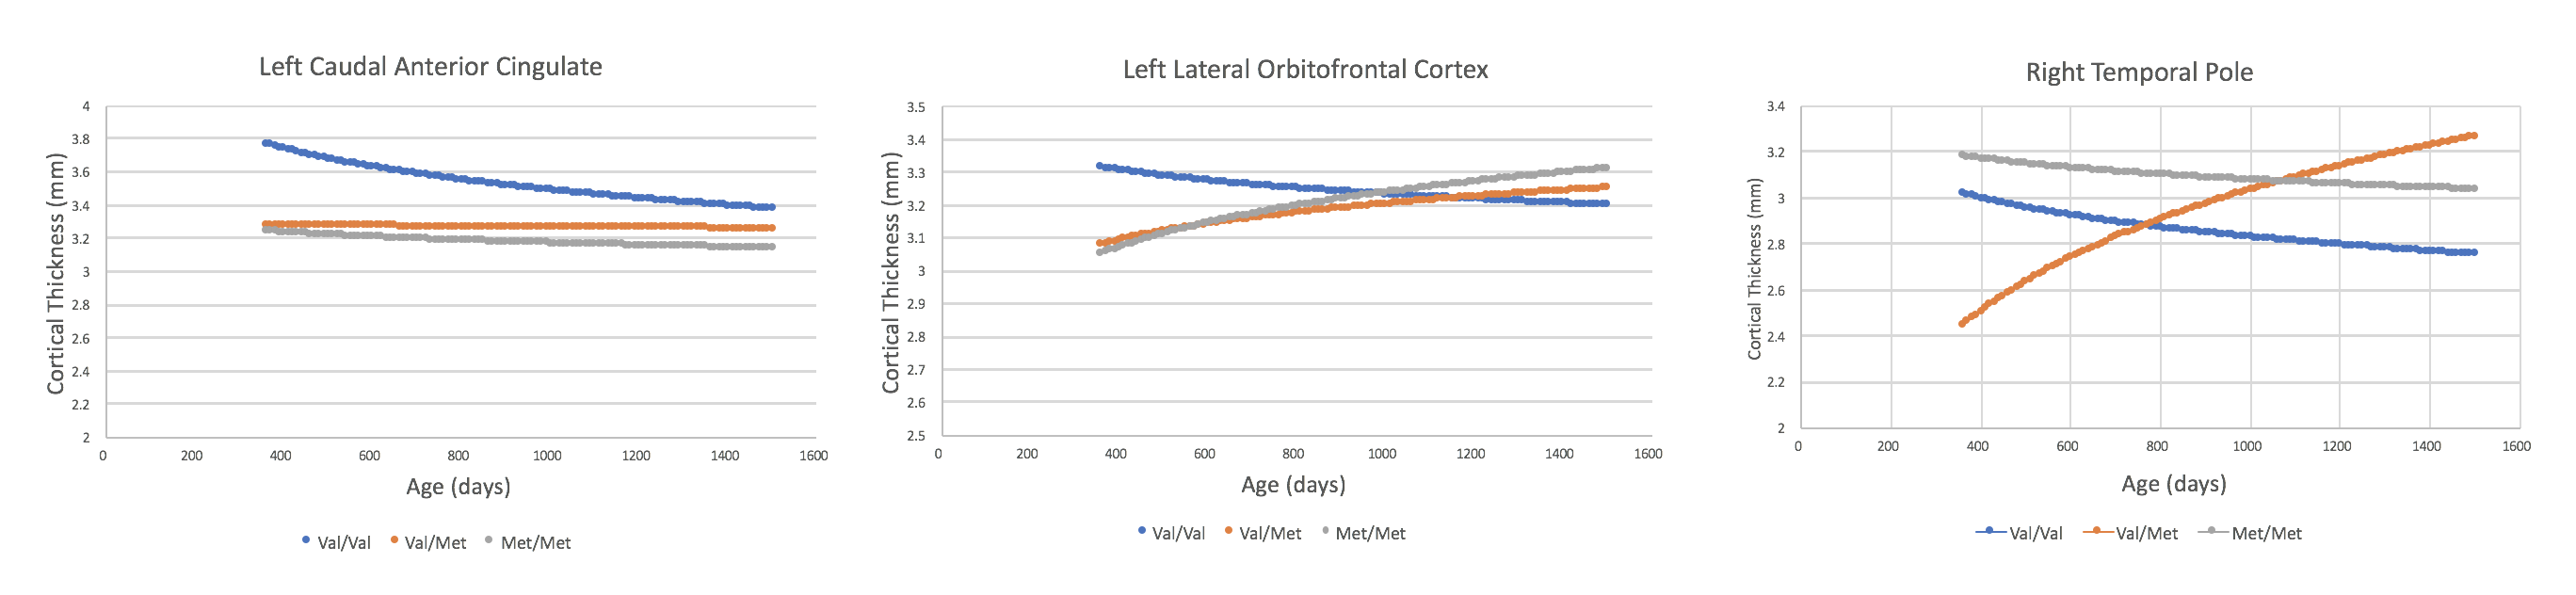
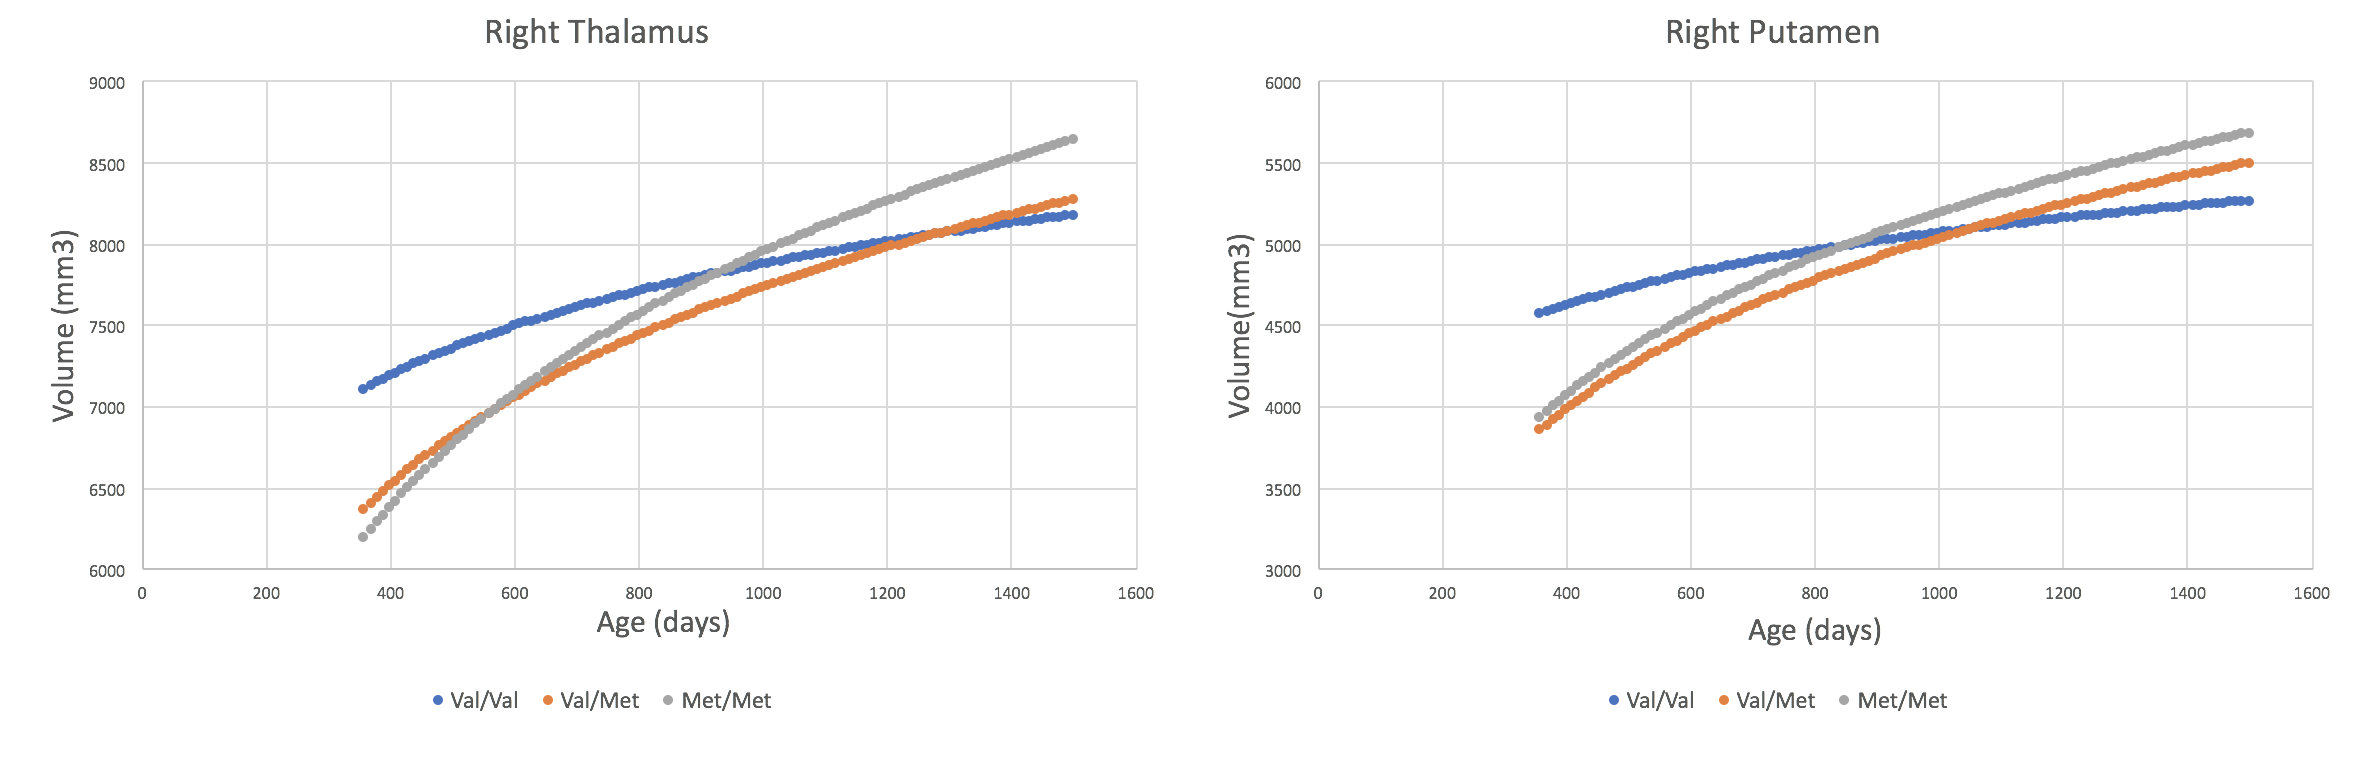
Our sample comprised 23 subjects with the Val/Val genotype, 32 with the Val/Met genotype, and 14 with the Met/Met genotype. Participants in each group were matched for race, ethnicity, birth weight, gestational duration, maternal age, delivery type, breast vs. bottle feeding, in utero smoke exposure. Cortical thickness trajectories showed longitudinal differences between Val/Val and Val/Met cohorts in the cingulate, fusiform gyrus, orbitofrontal cortex, temporal pole, transverse temporal gyrus, entorhinal cortex, and frontal pole. For these regions, the Val/Met and the Met/Met cohorts demonstrate thicker cortex in orbitofrontal cortex and temporal pole with respect to the Val/Val genotype, but thinner cortex in cingulate substructures encompassing the caudal anterior cingulate. Significant longitudinal differences were observed in subcortical volume in the right thalamus and right putamen, with Val/Val genotype starting off with the greatest volume, but having the smallest volume by 6 years of age; while, the Met/Met genotype has the greatest volume by 6 years of age.Discussion
The longitudinal findings on differential brain development based on COMT genotype presented builds upon and extends prior results with respect to both cortical and subcortical structures3. Consistent with prior studies, we demonstrate that COMT rs46480 polymorphisms significantly influence the development of temporal lobe structures bilaterally and extend these results throughout the first 6 years of development. This is consistent with the hypothesis that COMT polymorphisms moderate cortical anatomy in frontal and temporal, and cingulate cortex3,4, 11. Our results further extend observed differences of orbitofrontal and cingulate cortex development in adolescents4,11 to neurodevelopmental differences in infants and young children. Data presented here supports the theory that altered neurochemical environment from COMT variants influences brain development as early as one year of age.Conclusion
In this study we sought to identify the impact of COMT rs46480 polymorphisms have on longitudinal subcortical and cortical development in a young cohort of infants and children. We have demonstrated that region specific trajectories of subcortical and cortical development are significantly different between infants and young children based on COMT genotype. While the relationship of these findings and long-term brain differences remains unclear, COMT genotype status plays an important role in influencing early neurodevelopment.Acknowledgements
No acknowledgement found.References
1. Garris, P. A., and R. M. Wightman. "Different kinetics govern dopaminergic transmission in the amygdala, prefrontal cortex, and striatum: an in vivo voltammetric study." Journal of Neuroscience14.1 (1994): 442-450
2. Ayalew, M., et al. "Convergent functional genomics of schizophrenia: from comprehensive understanding to genetic risk prediction." Molecular psychiatry 17.9 (2012): 887-905
3. Knickmeyer, Rebecca C., et al. "Common variants in psychiatric risk genes predict brain structure at birth." Cerebral cortex 24.5 (2013): 1230-1246.
4. Shaw, P., et al. "Effects of the Val158Met catechol-O-methyltransferase polymorphism on cortical structure in children and adolescents." Molecular psychiatry 14.4 (2009): 348.
5. Remer, Justin, et al. "Quantifying cortical development in typically developing toddlers and young children, 1–6 years of age." NeuroImage 153 (2017): 246-261.
6. Croteau-Chonka, Elise C., et al. "Examining the relationships between cortical maturation and white matter myelination throughout early childhood." NeuroImage 125 (2016): 413-421.
7. Dean III, Douglas C., et al. "Pediatric neuroimaging using magnetic resonance imaging during non-sedated sleep." Pediatric radiology 44.1 (2014): 64-72.
8. Deoni, Sean CL, et al. "Gleaning multicomponent T1 and T2 information from steady‐state imaging data." Magnetic Resonance in Medicine 60.6 (2008): 1372-1387.
9. Sled, John G., Alex P. Zijdenbos, and Alan C. Evans. "A nonparametric method for automatic correction of intensity nonuniformity in MRI data." IEEE transactions on medical imaging 17.1 (1998): 87-97. 10. Fischl, Bruce. "FreeSurfer." Neuroimage 62.2 (2012): 774-781.
11. McIntosh, Andrew M., et al. "Relationship of catechol-O-methyltransferase variants to brain structure and function in a population at high risk of psychosis." Biological psychiatry 61.10 (2007): 1127-1134.
Figures