0223
Multimodal ASL/PET/mRNA-expression analysis reveals CBF changes after single dose of antipsychotics depend on dopamine D2 receptor density profiles.1Department of Neuroimaging, Institute of Psychiatry, Psychology & Neuroscience, King's College London, London, United Kingdom, 2Imanova Ltd., Centre for Imaging Sciences, Hammersmith Hospital, London, United Kingdom, 3Division of Brain Sciences, Department of Medicine, Imperial College London, London, UK, London, United Kingdom, 4Translational Medicine Neuroscience and Biomarkers, F. Hoffmann-La Roche Ltd, Basel, Switzerland, 5Department of Experimental and Clinical Medical Sciences, University of Udine, Udine, Italy, 6Department of Basic Medical Science, Neuroscience and Sense Organs, University of Bari Aldo Moro, Bari, Italy
Synopsis
In this study, we tested whether CBF changes after acute administration of antipsychotics in healthy volunteers are associated with receptor distribution profiles of one of their main targets, namely the dopamine D2 receptor. Receptor distribution profiles were extracted from an in-house [18F]Fallypride template and from the Human Allen Brain Atlas. Results show that changes in CBF measures are directly proportional to dopamine D2 receptor levels as indexed by PET maps and mRNA expression levels. Overall the present study shows evidence that CBF is ultimately a functional marker which can be adopted in drug challenges to inform the drug development process.
Background, problem and purpose
Antipsychotic drugs produce marked functional effects as measured with MRI haemodynamic markers like Cerebral Blood Flow (CBF)1-3. These effects are thought to depend on dopamine D2 receptor (D2R) blockade4, although their relationship with antipsychotic pharmacodynamics has not been fully established yet. In fact, the haemodynamic nature of CBF measures makes difficult to interpret drug effects in terms of altered neurotransmission function. In the present work, we tested whether CBF changes induced by different antipsychotics mirror receptor distribution profiles of one of the main target of these compounds, namely the D2R. We evaluated the correlation of CBF variation with receptor density as measured with PET and brain mRNA expression extracted from the Allen Human Brain Atlas.Methods
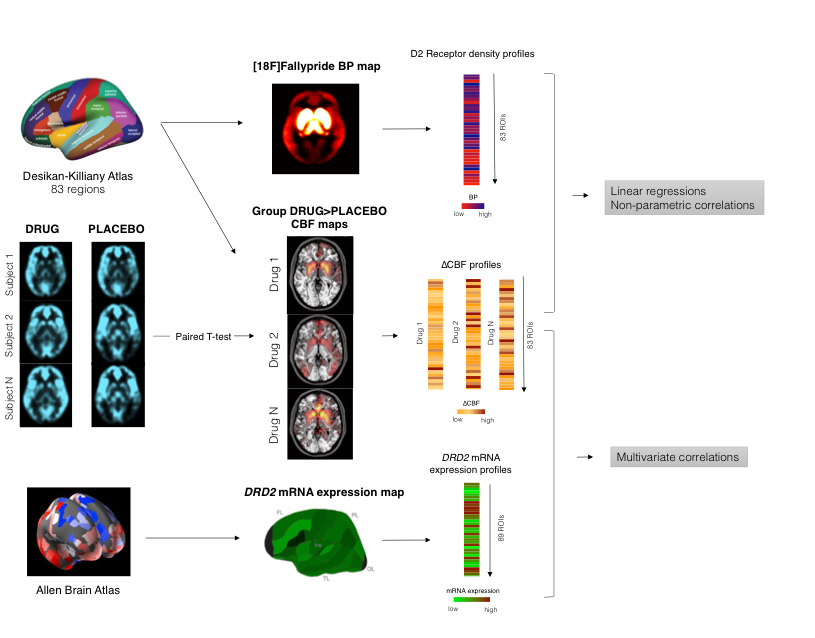
Forty-two healthy male subjects were enrolled in a double blind, randomized, placebo-controlled, crossover study. Participants were randomized in two equal parallel groups to receive a single dose of antipsychotic/placebo in three separate sessions. In Group 1 placebo, olanzapine 7.5mg (OLA) or haloperidol 3mg (HAL) were administered before the MRI scan. In Group 2 participants received placebo, 0.5mg (lowRIS) or 2mg (highRIS) of risperidone. Regional CBF was assessed with arterial spin labelling, acquired on a 3T scanner using a pseudo-continuous ASL (pCASL) sequence with a multi-shot, segmented 3D stack of axial spirals (8-arms) readout with a resultant spatial resolution of 2x2x3mm3. Three control-label pairs were used to derive a perfusion-weighted difference image. The labelling RF pulse had a duration of 1.5s and a post-labelling delay of 1.5s. CBF maps data were co-registered to individual structural T1 image, normalized into MNI space by using a study-specific structural template created with DARTEL and the smoothed with an 8mm FWHM kernel. For each antipsychotic, a paired T-test was performed in SPM12. A template image of dopamine D2 receptor density was derived from PET scans using the high affinity D2/D3 antagonist ligand [18F]-Fallypride5. The template was created by averaging 6 [18F]Fallypride non displaceable binding potential (BPND) whole brain maps acquired in healthy volunteers. Brain mRNA expression values for DRD2 gene (coding for D2R) were extracted from the Human Allen Brain Atlas dataset6 by using the MENGA toolbox7. CBF contrast images and the [18F]Fallypride BPND template were segmented into 83 ROIs by using the Desikan-Killiany Atlas8. The regional changes in CBF against placebo (∆CBF) were compared with BPND and gene expression maps using multivariate correlations. Figure 1 summarizes the whole analysis framework.Results
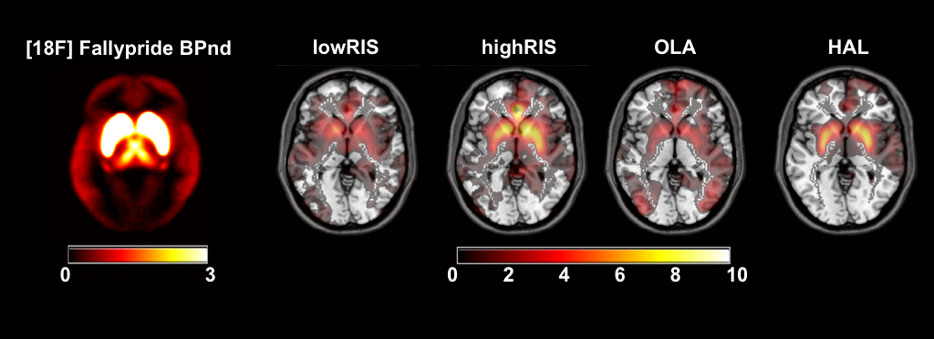
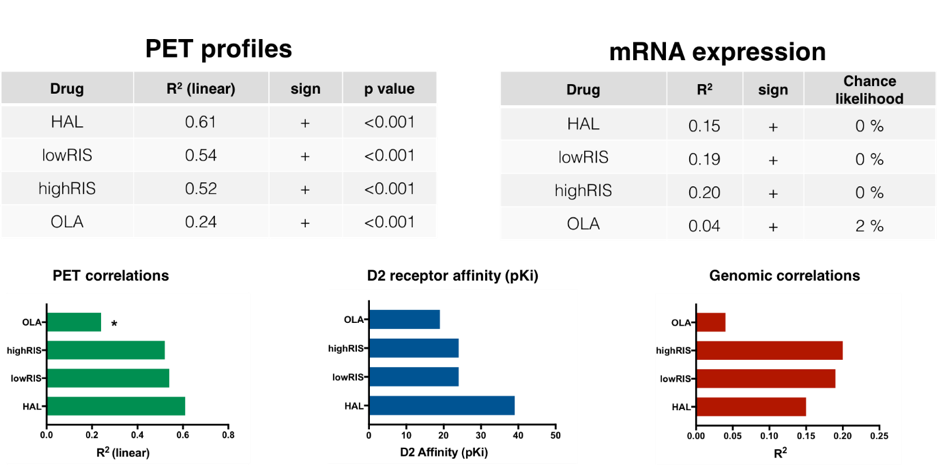
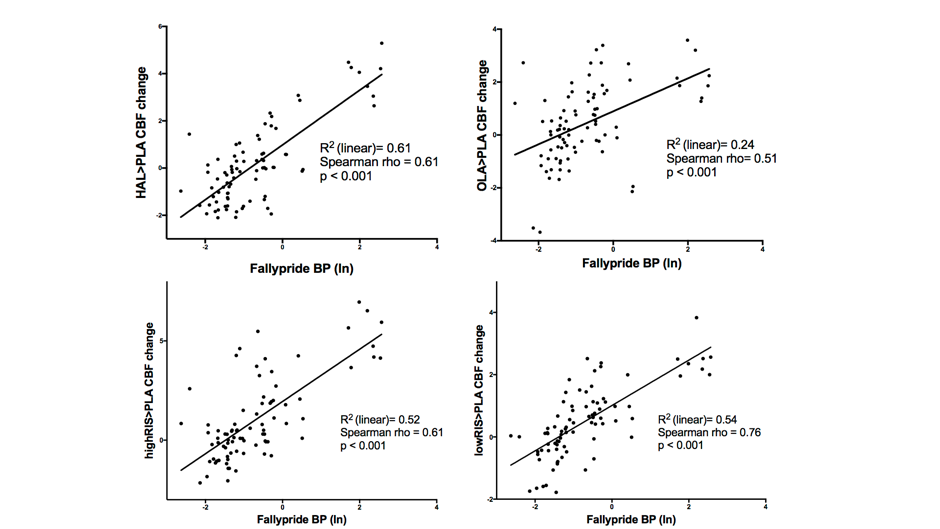
Figure 2 shows the [18F]Fallypride BPND map and group DRUG>PLACEBO CBF contrast images for each antipsychotic. All antipsychotics increased CBF especially in the basal ganglia, which is a brain region highly populated by D2R. Figure 3 and Figure 4 summarize the results of the correlation analyses. For all antipsychotics, CBF changes in each ROI were directly proportional to [18F]Fallypride BP values (all p<0.001) and DRD2 mRNA expression levels (all chance likelihood <2%). In addition, OLA which is known to have lower affinity with D2R as compared with the other drug tested9, showed weaker association between ∆CBF and receptor profiles.Discussion
Consistently with the literature1-4, we found that a single dose of antipsychotic in healthy volunteers increased CBF mainly in the basal ganglia. Moreover, to the best of our knowledge, this is the first time that this effect is showed to be directly proportional to D2R concentration in the brain, as indexed by PET BPND maps and mRNA expression levels. As expected10, mRNA expression levels explained less variance in ∆CBF than PET derived map. Interestingly, the association strength between ∆CBF and brain receptor distribution profiles mirrored differential D2R affinity between the tested drugs9. Overall, these results indicate that CBF increases after administration of a single dose of antipsychotics actually reflect known pharmacodynamics profile of these compounds. Further work will determine whether this approach is able to separate the specific contribution of different receptor systems (i.e. dopamine and serotonin receptors) for drugs with multiple targets like antipsychotics. While individualised receptor profile maps may bring more precision to the method, CBF is ultimately a functional marker and this work is important in bridging the considerable gap between the pharmacokinetic and pharmacodynamic effects of compounds. This is especially valuable for profiling compounds known to bind to multiple targets and may even be useful for compounds with unknown or poorly characterised targets. These methods could therefore be adopted as biologically reliable and non-invasive tools for drug development.Acknowledgements
This work represents independent research part funded by the National Institute for Health Research (NIHR) Biomedical Research Centre at South London and Maudsley NHS Foundation Trust and King’s College London. The views expressed are those of the author(s) and not necessarily those of the NHS, the NIHR or the Department of Health.
Contract grant sponsor: Hoffmann – La Roche Pharmaceuticals.
References
1. Handley, R. et al. Acute effects of single‐dose aripiprazole and haloperidol on resting cerebral blood flow (rCBF) in the human brain. Hum. Brain Mapp. 34, 272–282 (2013).
2. Fernández-Seara, M. A. et al. Effects on resting cerebral blood flow and functional connectivity induced by metoclopramide: a perfusion MRI study in healthy volunteers. Br. J. Pharmacol. 163, 1639–1652 (2011).
3. Hawkins, P. C. T. et al. An investigation of regional cerebral blood flow and tissue structure changes after acute administration of antipsychotics in healthy male volunteers. Hum. Brain Mapp. 73, 102–13 (2017).
4. Goozee, R., Handley, R., Kempton, M. J. & Dazzan, P. A systematic review and meta-analysis of the effects of antipsychotic medications on regional cerebral blood flow (rCBF) in schizophrenia: Association with response to treatment. Neuroscience & Biobehavioral Reviews 43, 118–136 (2014).
5. Mukherjee, J., Yang, Z.-Y., Das, M. K. & Brown, T. Fluorinated benzamide neuroleptics—III. Development of (S)-N-[(1-allyl-2-pyrrolidinyl)methyl]-5-(3-[18F]fluoropropyl)-2,3-dimethoxybenzamide as an improved dopamine D-2 receptor tracer. Nuclear Medicine and Biology 22, 283–296 (1995).
6. Hawrylycz, M. J. et al. An anatomically comprehensive atlas of the adult human brain transcriptome. Nature 489, 391–399 (2012).
7. Rizzo, G., Veronese, M., Expert, P., Turkheimer, F. E. & Bertoldo, A. MENGA: A New Comprehensive Tool for the Integration of Neuroimaging Data and the Allen Human Brain Transcriptome Atlas. PLoS ONE 11, e0148744–20 (2016).
8. Desikan, R. S. et al. An automated labeling system for subdividing the human cerebral cortex on MRI scans into gyral based regions of interest. NeuroImage 31, 968–980 (2006).
9. McCormick, P. N. et al. The antipsychotics olanzapine, risperidone, clozapine, and haloperidol are D2-selective ex vivo but not in vitro. Neuropsychopharmacology 35, 1826–1835 (2010).
10. Liu, Y., Beyer, A. & Aebersold, R. On the Dependency of Cellular Protein Levels on mRNA Abundance. Cell 165, 535–550 (2016).
Figures