0220
Fast multi-component T1 and T2 correlation measurements using steady-state free precession1Magnetic Resonance and X-ray Imaging Department, Fraunhofer Development Center X-ray Technology (EZRT), Würzburg, Germany, 2Experimental Physics 5, University of Würzburg, Würzburg, Germany
Synopsis
An inversion recovery bSSFP measurement allows to generate a spectrum of the apparent relaxation time T1* and hence to identify multiple components in a voxel. However, it is not possible to extract unambiguous T1 and T2 information for each individual component. Here, we demonstrate that this limitation can be overcome by an additional bSSFP measurement without inversion pulse. Additive and subtractive combinations of the measured signal courses provide enough information for assigning unambiguous T1, T2 and proton density values to each component. In that way, 2D T1-T2 correlation spectra can be generated voxel-wise in a very time-efficient manner.
Introduction
An inversion recovery (IR) balanced steady-state free-precession (bSSFP) measurement with a radial readout is a fast acquisition technique for generating quantitative parameter maps.1,2 This sequence also allows to separate multiple components within a voxel-element by generating a T1* spectrum of the apparent relaxation time (T1*) using the inverse Laplace transform.3,4 However, for an individual peak in such a spectrum there exists no unique solution for T1 and T2 values since several tissues may have the same T1* value even though they differ in T1 and T2. Here we demonstrate that T1, T2 and proton density (PD) can be obtained for multiple components in one voxel-element using two bSSFP measurements.Methods
Assuming
a single tissue component, quantitative T1, T2 and PD
values can be simultaneously obtained from an IR bSSFP measurement, when the
initial signal after inversion (S0), the steady-state signal (Sstst)
and T1* are determined. Additionally, multiple components can be
identified by analyzing the IR bSSFP signal course using the inverse Laplace
transform. However, the spectral amplitudes of the resulting T1*
spectrum depend on the sum of S0 and Sstst and hence it
is not possible to extract T1 and T2 information for an
individual T1* peak. To overcome this limitation, two bSSFP
measurements can be performed,
one with an inversion pulse and one without an inversion pulse prior to the bSSFP
readout.5 Both signals approach the same steady-state but from a
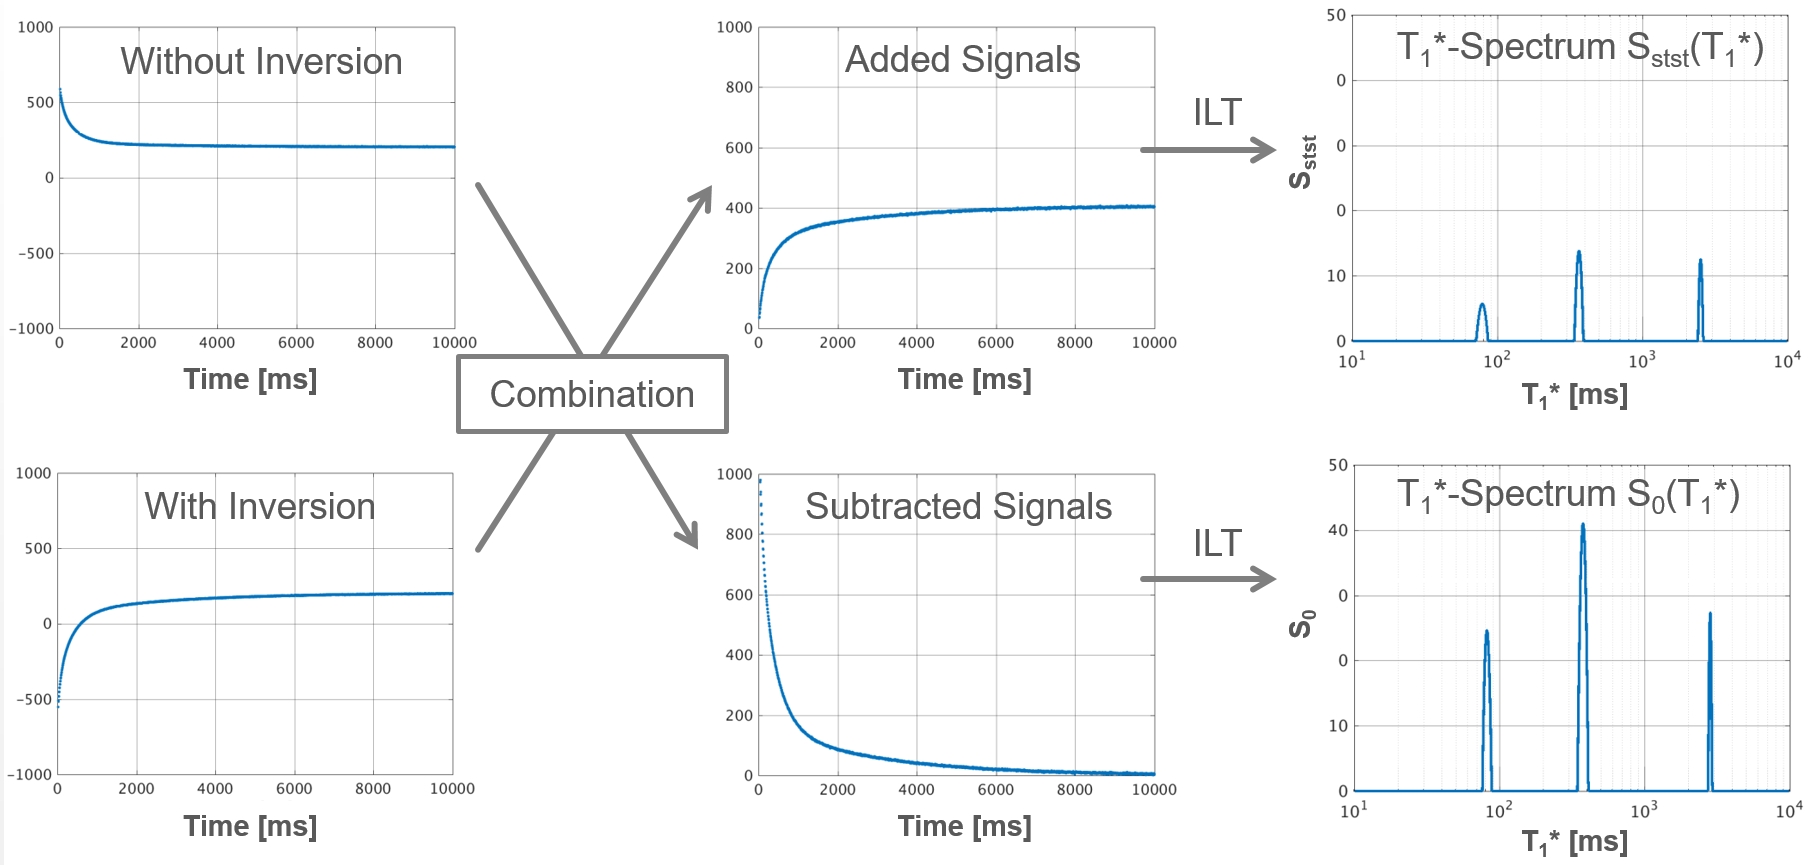
different initial signal. The added signals depend only on Sstst and
T1*:
$$S_{add}(t)=2·S_{stst}·(1-exp(\frac{-t}{T_1^*})) $$
The subtracted signals depend only on S0 and T1*:
$$S_{sub}(t)=2·S_0·exp(\frac{-t}{T_1^*}) $$
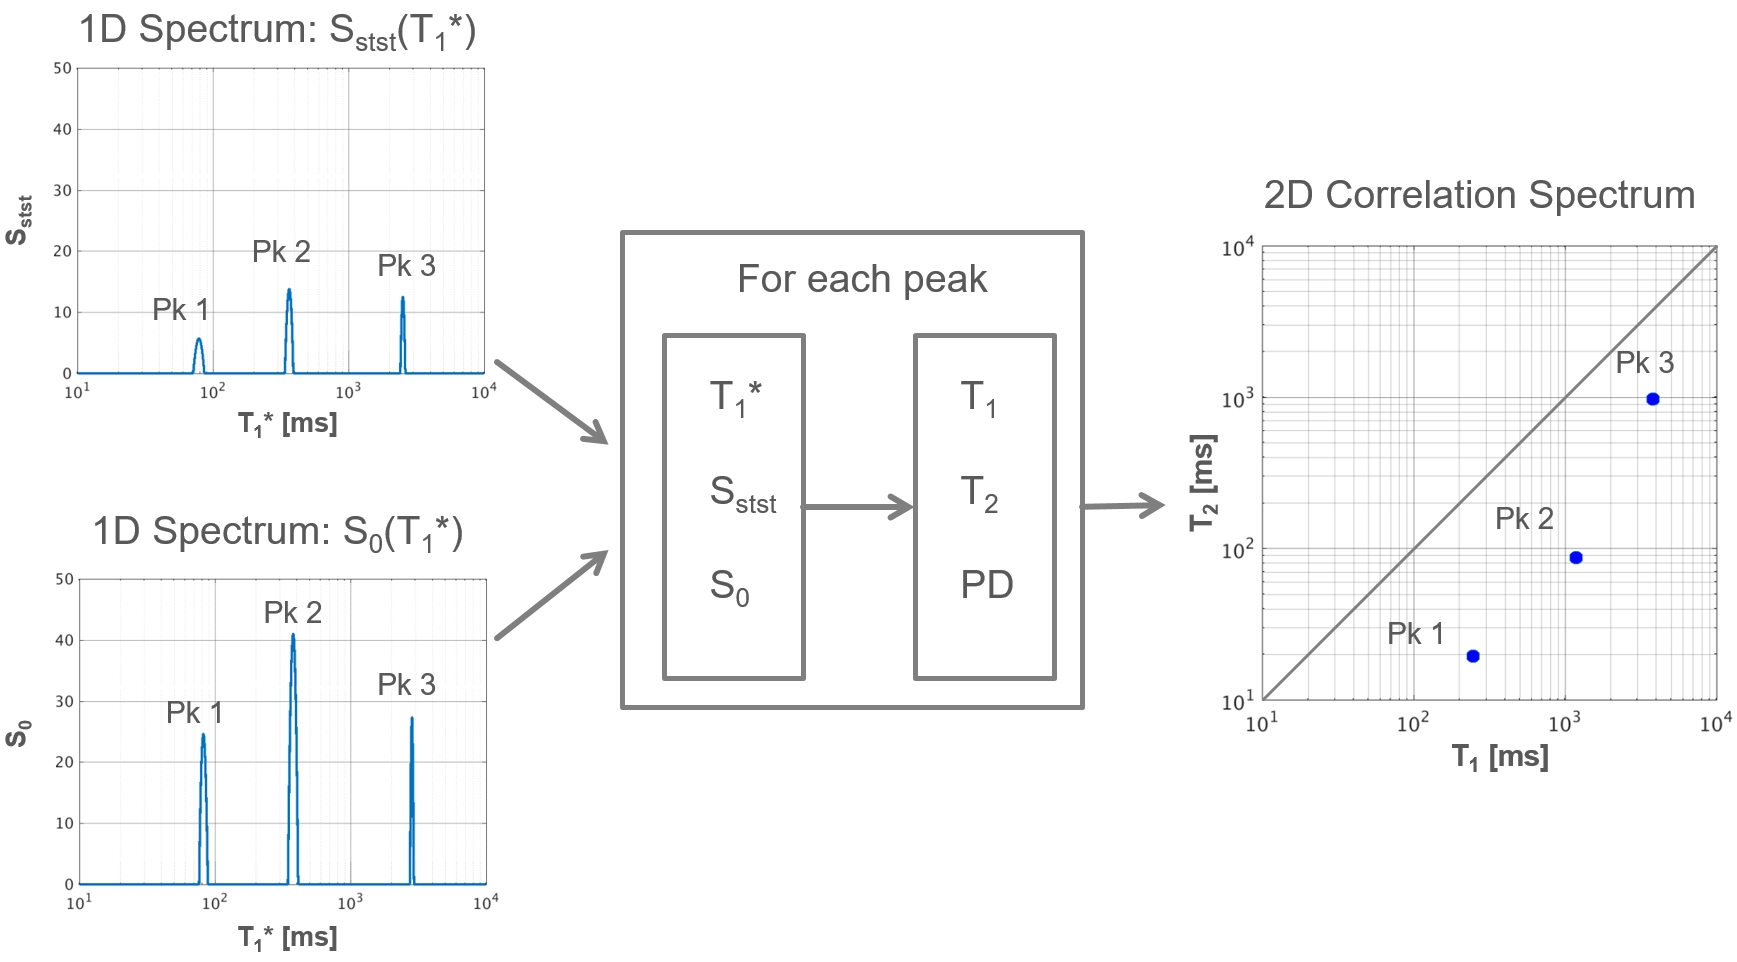
T1* spectra can be generated from Sadd(t) and Ssub(t) as shown in Fig. 1. The areas under the peaks of the resulting T1* spectra represent S0 and Sstst respectively and are used to calculate T1, T2 and PD for each peak. The result can then be plotted in a 2D correlation spectrum (Fig. 2).
Phantom measurements were performed on a 3T MRI system to validate the principle of this technique. The phantom contained four different components - pure water, water with contrast agent, and sunflower oil with two specific chemical substances. 2048 echoes were acquired without phase encoding (TR = 4.6 ms, excitation angle = 60°). Spatially resolved reference measurements for T1 and T2 were performed using an inversion recovery spin-echo based sequence with different inversion times for T1 estimation and multiple spin-echo experiments with varying echo times for the calculation of T2.
In vivo experiments with 2048 radial projections were performed with a projection increment of 38.98° (TR = 5.0 ms, excitation angle = 40°). This tiny golden angle reduces eddy currents and provides sufficient k-space information for a narrow sliding window reconstruction with a high temporal fidelity.6 In total 408 images per measurement were reconstructed using the T1* shuffling method.4,7
T1* spectra were generated by applying the inverse Laplace transform on the added as well as the subtracted signals and T1, T2 and PD were calculated for each appearing peak.
Results
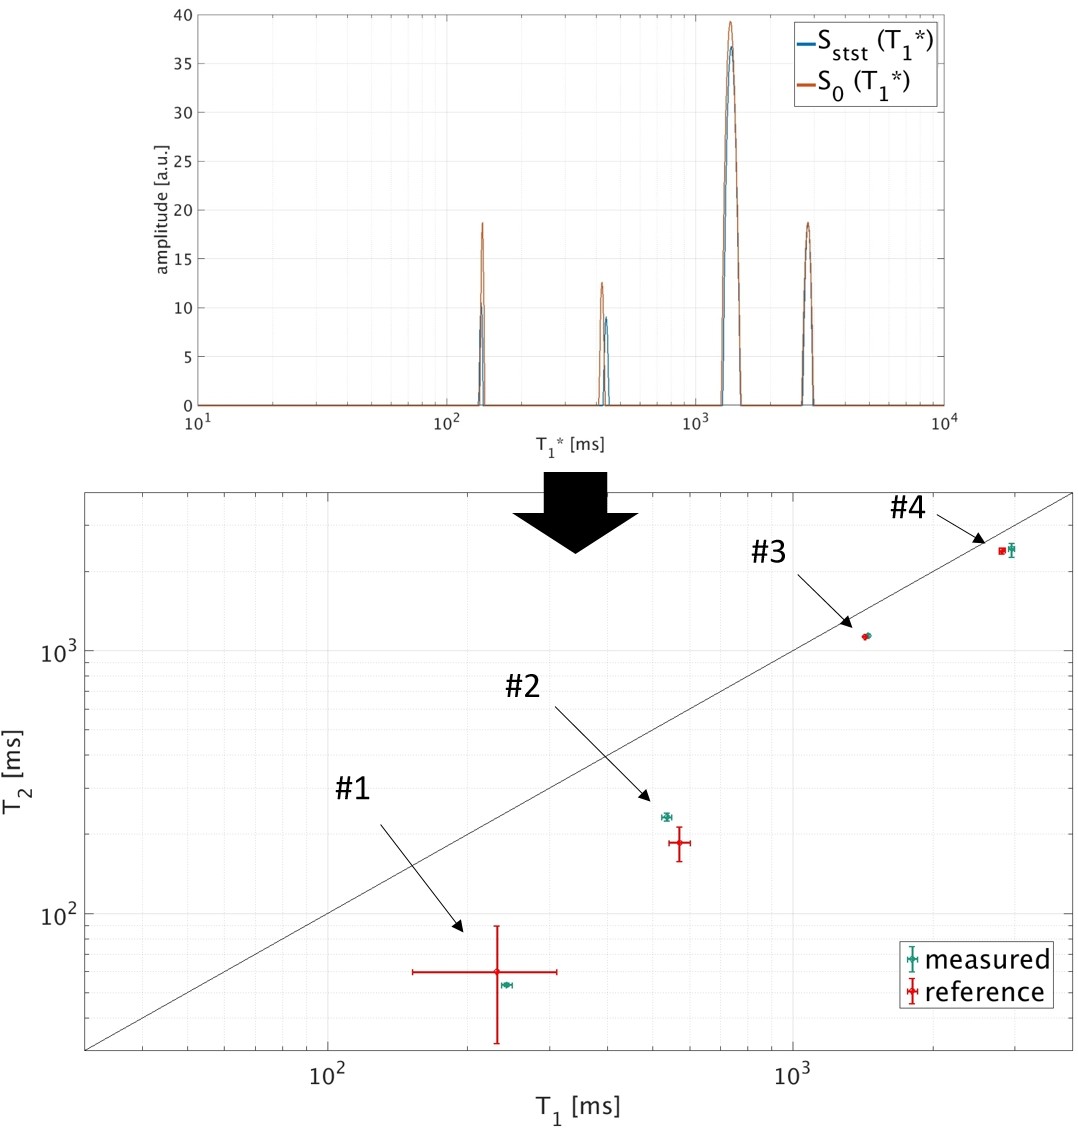
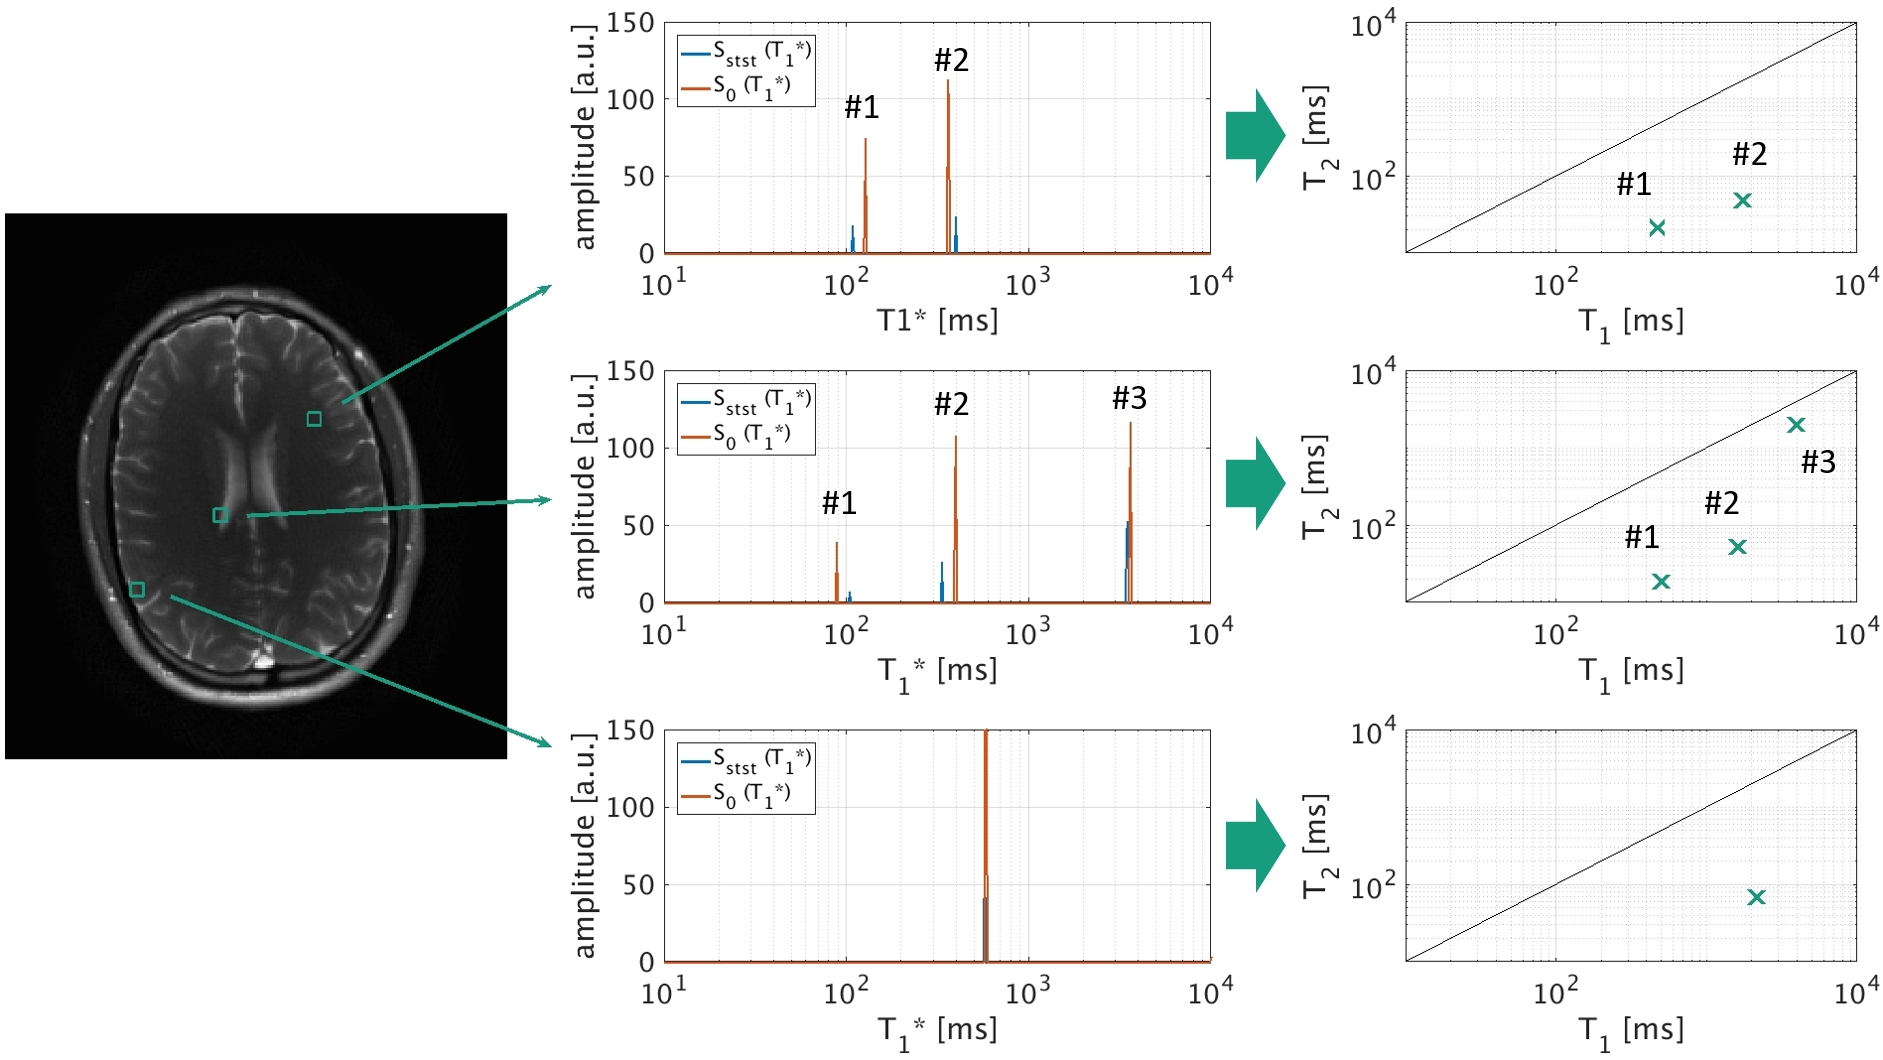
The phantom experiment shows an excellent agreement with the reference measurements. Fig. 3 illustrates the spectra from the subtracted and added signals as well as the resulting T1/T2 correlation spectrum. In vivo results are shown in Fig. 4 and highlight the added and subtracted spectra from three exemplary voxels obtained by the inverse Laplace transform. The resulting T1/T2 pairs in the correlated spectra indicate e.g. myelin (T1* ≈ 100 ms), white matter (T1* ≈ 400 ms), gray matter (T1* ≈ 550 ms) and the cerebrospinal fluid (CSF) (T1* ≈ 3300 ms) in the expected brain areas.
Deviations from literature T1 and T2 values may occur due to B0 inhomogeneities and inaccurate flip angle information. Furthermore, deviations from the ideal radial trajectory may alter the steady-state signal and hence lead to a mismatch between the positions of the individual peaks of the combined T1* spectra.
Conclusion
In this work promising results for fast spatially-resolved measurements of multi-component T1 and T2 correlation spectra were presented. This technique enables the quantification of a relaxation time distribution arising from multiple tissue components within one voxel-element. Such information can be helpful in neurodegenerative diseases where e.g. the fraction of Myelin with its short component within white matter is very meaningful. Advantages over other approaches are the short scan time (2∙10 s + 10 s waiting period per slice) and the fact that this method is not based on a specific signal model.Acknowledgements
References
1. Schmitt P. et al.: Inversion Recovery TrueFISP: Quantification of T1, T2, and Spin Density. MRM 2004; 51:661–667.
2. Ehses P. et al.: IR TrueFISP With a Golden-Ratio-Based Radial Readout: Fast Quantification of T1, T2, and Proton Density. MRM 2013; 69:71-81.
3. Hargreaves B.A. and Nishimura D.G.: Relaxometry using Transient Steady-State Free Precession Imaging. Proc. ISMRM 2003.
4. Pfister J. et al.: Simultaneous T1/T2 measurements in combination with PCA-SENSE reconstruction (T1* shuffling) and multicomponent analysis. Proc. ISMRM 2017.
5. Pfister J. et al.: Fast spatially-resolved multi-component T1 and T2 parameter mapping. Proc. ESMRMB 2017.
6. Wundrak S. et al.: A Small Surrogate for the Golden Angle in Time-Resolved Radial MRI Based on Generalized Fibonacci Sequences. IEEE Transactions on Medical Imaging 2015; 34:1262-1269.
7. Tamir J.I. et al.: T2 Shuffling: Sharp, Multicontrast, Volumetric Fast Spin-Echo Imaging. MRM 2017; 77:180-195.
Figures