0217
Echo Planar Time-resolved Imaging (EPTI)1A. A. Martinos Center for Biomedical Imaging, Department of Radiology, Massachusetts General Hospital, Charlestown, MA, United States, 2Harvard-MIT Health Sciences and Technology, MIT, Cambridge, MA, United States, 3Center for Biomedical Imaging Research, Department of Biomedical Engineering, Tsinghua University, Beijing, China
Synopsis
A new technique, termed Echo Planar Time-resolved Imaging (EPTI), was developed to address EPI’s geometric distortion and blurring, and to provide new temporal signal evolution information across the EPI readout window. Using only a few shots, a time-series of multi-contrast images can be created free of distortion and blurring (up to 100 T2- and T2*-weighted images with time interval of an EPI echo spacing). This should make EPTI useful for numerous applications where undistorted images across multiple-contrasts are desired. We demonstrated EPTI in brain to simultaneously map T2, T2*, and tissue phase, as well as to provide SWI.
Introduction
Echo planar imaging (EPI) is a commonly-used MR acquisition technique due to its fast speed. However, there are two major problems with EPI: i) geometric distortion along the phase-encoding direction, and ii) its ability to only obtain a single-contrast image at the effective echo time, with blurring effects from other time points in the EPI readout. These problems significantly compromise EPI’s image quality in functional/diffusion/perfusion imaging, and limit its ability to achieve high-quality anatomical and quantitative imaging.
In this study, a new technique based on EPI, termed Echo Planar Time-resolved Imaging (EPTI), was developed to address these issues. This approach not only achieves distortion- and blurring- free imaging, it is also capable of obtaining up to 100 T2&T2*-weighted images across the EPI readout window, spaced at a time interval equal to EPI’s echo-spacing (~1ms). This should make it useful to numerous applications where high-SNR undistorted images or multiple-contrast images are desired. Here, we validated EPTI by applying it to simultaneously map T2, T2*, and tissue phase, as well as to provide susceptibility weighted imaging (SWI) in the brain.
Methods
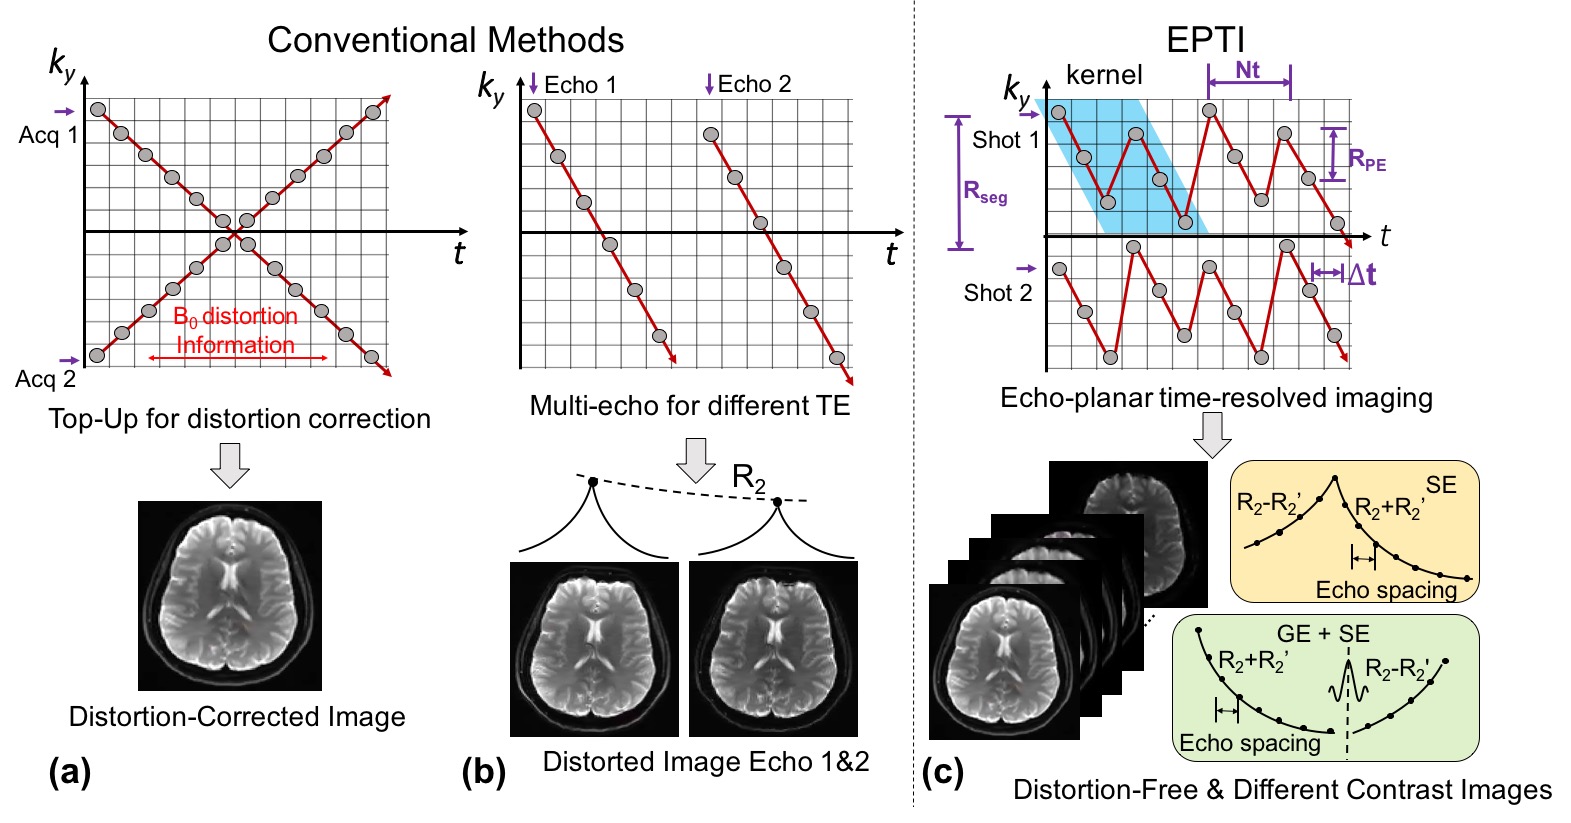
To understand how EPTI works, a different perspective of EPI signal space, ky-t space, is introduced in Fig.1. For single-shot EPI (SS-EPI), the signal is acquired to fill a 45° diagonal line in the ky-t space, with T2/T2* decay and susceptibility-induced phase accumulating over time, leading to blurring and distortion in the final image. To correct for distortion, a pair of datasets with reversed phase-encoding is usually acquired[1,2]. Such acquisition obtains two +/-45° diagonal lines in the ky-t space, with more information to estimate and correct for the susceptibility-induced distortion (Fig.1a). To obtain multiple-contrast images, multi-echo EPI methods[3,4] can be used as shown in Fig1.b, but suffer from limited number of echoes as well as image distortions and blurring.
If we acquire data to fully-sampled ky-t space, distortion- and blurring- free images with different contrasts can be obtained at different echo times with a spacing-interval of an echo-spacing. Such fully-sampled ky-t data can be achieved through several existing techniques, such as EPSI[5] which acquires horizontal lines in ky-t space for different shots, and PSF-encoded EPI[6,7] which acquires multiple diagonal lines for different PSF encodings. However, these techniques require extremely long scans, especially for high-spatial resolution.
To achieve an optimal acquisition to resolve the temporal evolution of EPI signals, EPTI is proposed with “tilted-CAIPI” reconstruction[8]. As shown in Fig1.c, each EPTI-shot covers a segment of ky-t using a zig-zag trajectory with an interleaved acceleration in the phase-encoding direction. The zig-zag trajectory ensures that neighboring ky-points are acquired only a few milliseconds apart, and contain small B0-inhomogeneity induced phase and T2* decay that can be estimated well by parallel imaging and B0-inhomogeneity-informed reconstruction[8]. Here, the reconstruction utilizes compact kernels to interpolate under-sampled ky-t space to fully-sampled ky-t, which requires an acquisition of low-resolution calibration scan. Partial Fourier in ky can also be implemented into EPTI to reduce the number of shots/segments.
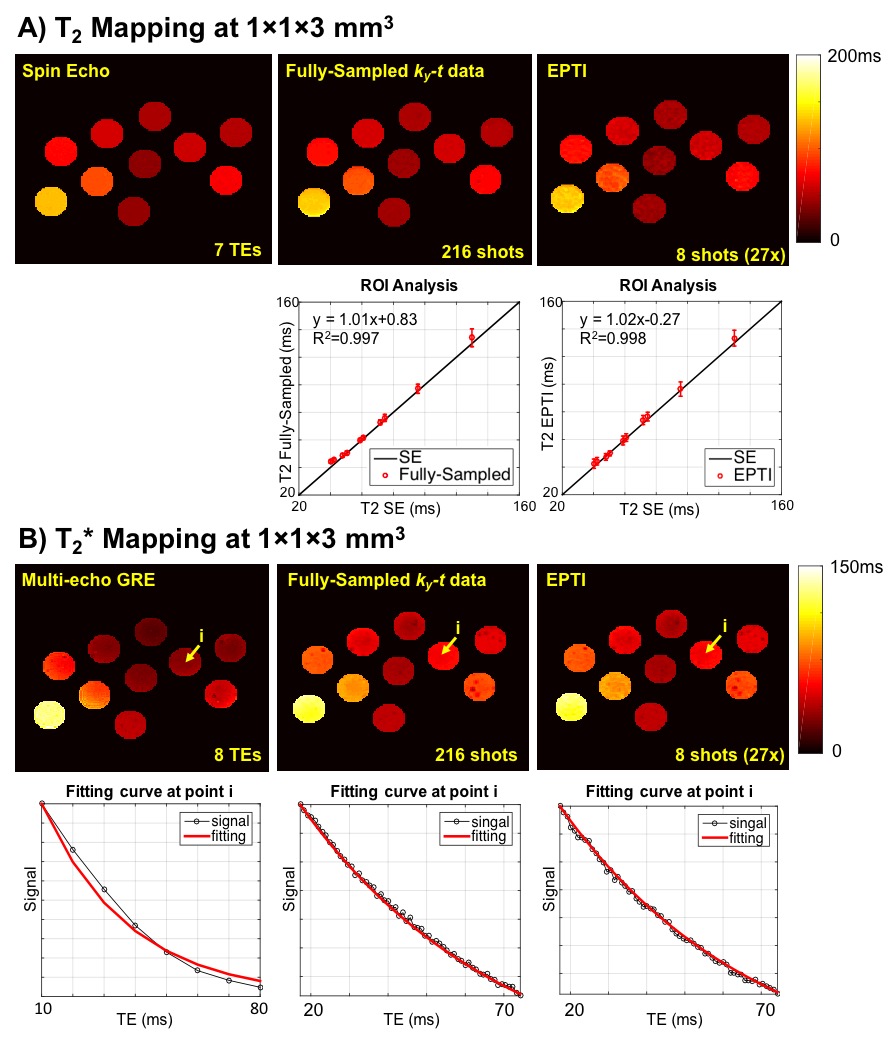
EPTI can be used for quantitative T2&T2* mapping, using single spin-echo or dual-echo (gradient-echo & spin-echo) acquisition (Fig.1c), and for SWI using the gradient-echo portion(s) of the same acquisition. Phantom and in-vivo experiments were performed at 3T to validate EPTI (see acquisition parameters in figure captions).
Results
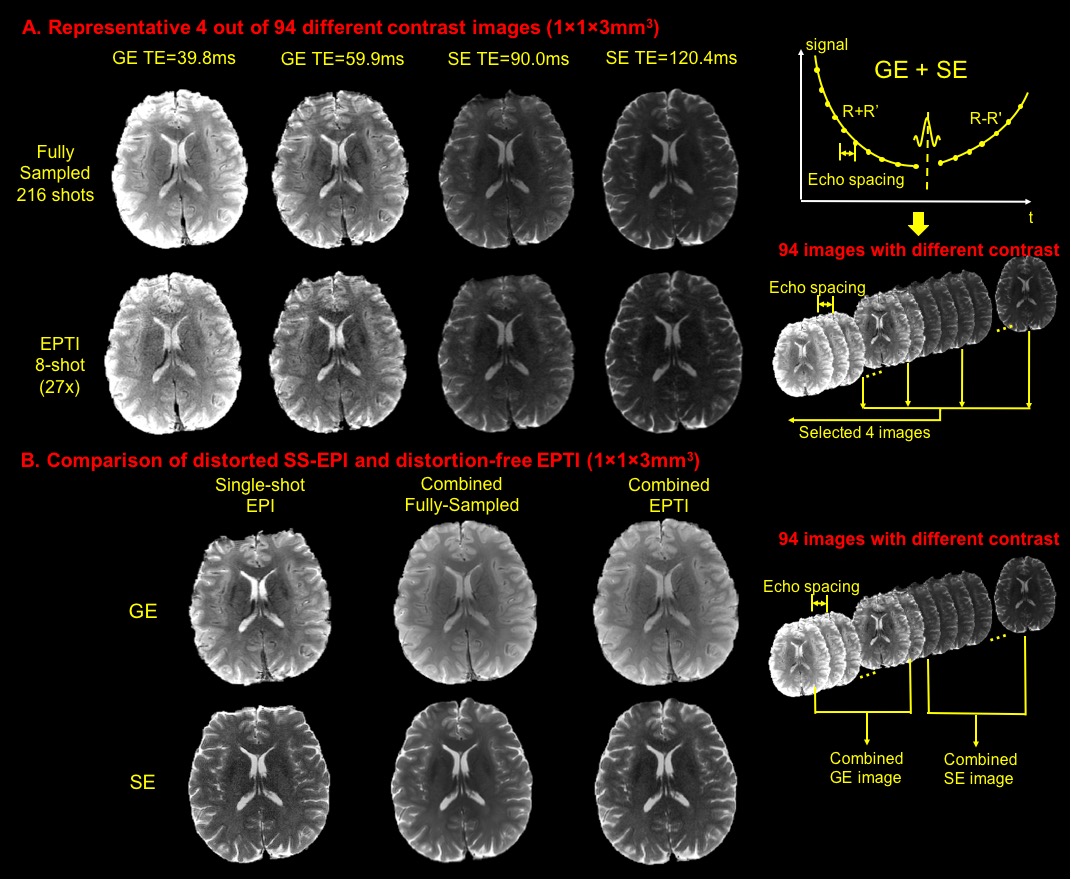
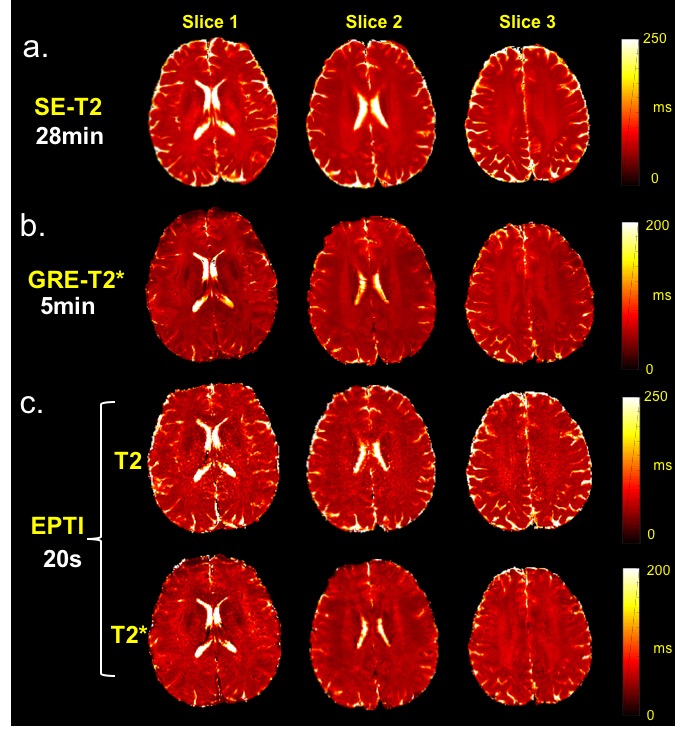
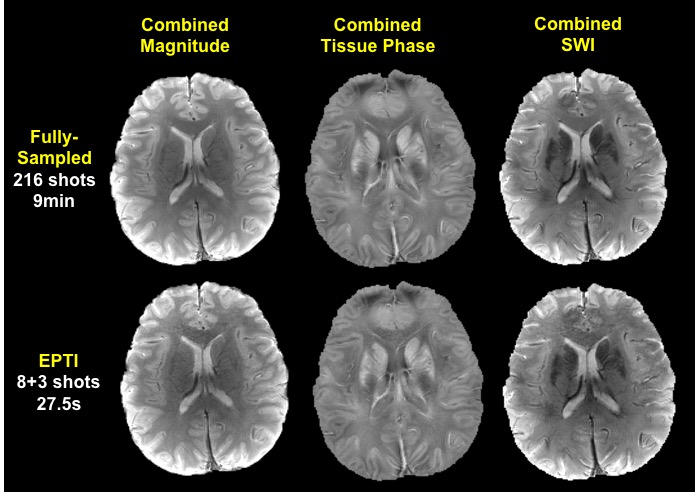
In phantom (Fig.2), EPTI achieves comparable T2 mapping to multi-TE acquisitions of standard-SE sequence, and more convincing T2* fittings compared to 8-echo GRE. Accelerated EPTI (8-shot, 27×) performed comparably to fully-sampled 216-shot acquisition, with slightly increased noise. In Fig.3A, multiple-contrast brain images from 8-shot EPTI are of similar quality to ones from fully-sampled data. In Fig.3B, combined GE and SE EPTI images show significant SNR-enhancement without distortion and blurring, when compared to SS-EPI. In Fig.4, simultaneous T2&T2* mapping in brain using EPTI shows close estimation to gold-standard SE and GRE mapping, at dramatically reduced acquisition time (20s across multiple slices compared to 28+5min). High quality tissue-phase and SWI can be obtained together with T2&T2* maps as per Fig.5.Discussion and Conclusion
EPTI is an efficient technique for distortion- and blurring- free anatomical imaging, multiple-contrast imaging and quantitative imaging. In this study, EPTI allows simultaneous quantitative T2&T2* mapping and SWI in 30s at 1×1×3mm3 across multiple slices. This could translate to whole-brain coverage in ~30s if combined with SMS=2. EPTI can also be further combined with multi-inversion[9] for simultaneous T1, T2 and T2* mapping. Moreover, the multi-echo property of EPTI renders it applicable to many applications, such as for improving phase/SWI/QSM and fMRI through better signal modeling[10-13].Acknowledgements
This work was supported in part by NIH research grants: R01EB020613, R01EB019437, R24MH106096, P41EB015896, and the shared instrumentation grants: S10RR023401, S10RR019307, S10RR019254, S10RR023043.References
1. Zahneisen B, Aksoy M, Maclaren J, Wuerslin C, Bammer R. Extended hybrid-space SENSE for EPI: Off-resonance and eddy current corrected joint interleaved blip-up/down reconstruction. NeuroImage 2017;153:97-108.
2. Andersson JLR, Skare S, Ashburner J. How to correct susceptibility distortions in spin-echo echo-planar images: application to diffusion tensor imaging. NeuroImage 2003;20:870-888.
3. Kundu P, Inati SJ, Evans JW, Luh WM, Bandettini PA. Differentiating BOLD and non-BOLD signals in fMRI time series using multi-echo EPI. NeuroImage 2012;60:1759-1770.
4. Barth M, Reichenbach JR, Venkatesan R, Moser E, Haacke EM. High-resolution, multiple gradient-echo functional MRI at 1.5 T. Magn. Reson. Med. 1999;17:321-329.
5. Mansfield P. Spatial mapping of the chemical shift in NMR. Magn. Reson. Med. 1984;1:370-386.
6. Zeng H, Constable RT. Image distortion correction in EPI: comparison of field mapping with point spread function mapping. Magn. Reson. Med. 2002;48:137-146.
7. Robson MD, Gore JC, Constable RT. Measurement of the point spread function in MRI using constant time imaging. Magn. Reson. Med. 1997;38:733-740.
8. Dong Z, Wang F, Reese TG, Manhard MK, Bilgic B, Wald LL, Guo H, Setsompop K. Tilted-CAIPI for Highly Accelerated Distortion-Free EPI with Point Spread Function (PSF) encoding. Submitted to: In Proceedings of the 26th Annual Meeting of ISMRM 2018.
9. Cohen O, Polimeni JR. Optimized inversion-time schedules for quantitative T1 measurements based on high-resolution multi-inversion EPI. Magn. Reson. Med. 2017.
10. Wharton S, Bowtell R. Fiber orientation-dependent white mattercontrast in gradient echo MRI. Proc Natl Acad Sci USA 2012;109:18559–18564.
11. Cronin MJ, Wang N, Decker KS, Wei H, Zhu WZ, Liu C. Exploring the origins of echo-time-dependent quantitative susceptibility map-ping (QSM) measurements in healthy tissue and cerebral micro-bleeds. NeuroImage 2017;149:98–113.
12. Wang Y, Liu T. Quantitative susceptibility mapping (QSM): decoding MRI data for a tissue magnetic biomarker. Magn. Reson. Med. 2015;73: 82-101.
13. Kundu P, Voon V, Balchandani P, et al. Multi-echo fMRI: A review of applications in fMRI denoising and analysis of BOLD signals. NeuroImage, 2017.
Figures