0215
DP-TSE MRF: Rapid and Accurate T2 and ADC Quantification Using Diffusion-Prepared Turbo Spin-echo Magnetic Resonance Fingerprinting1Biomedical Engineering, University of Virginia, Charlottesville, VA, United States, 2Center for Brain Imaging Science and Technology, Department of Biomedical Engineering, Zhejiang University, Hangzhou, China, 3State Key Laboratory of Modern Optical Instrumentation, College of Optical Science and Engineering, Zhejiang University, Hangzhou, China
Synopsis
This study proposes a rapid and accurate MR fingerprinting (MRF) framework based on a diffusion-prepared, turbo spin-echo (DP-TSE) sequence. Compared to both conventional parametric mapping and recent FISP-based MRF methods, the proposed framework provides accurate T2 maps and three main apparent diffusion coefficients (ADCs) for 15 slices within 7 minutes. This new MRF strategy can achieve accurate, inherently co-registered, high resolution T2 and ADC maps simultaneously.
Introduction:
The IR-FISP MRF1,2 approach has shown potential for rapid T1 and T2 mapping. However, since FISP-based methods collect gradient echoes, the T2 estimation is inevitably biased by the T2* effect. Additionally, when using an IR pulse, strong T1 interactions can confound the estimated T2, producing a prominent T1-weighted effect. Recently, ADC estimations using the MRF method3 have been proposed, but the need for an additional ECG trigger and 1min for each diffusion direction per slice make it less practical.
Previously, a new MRF method based on IR-TSE4 we proposed was demonstrated to obtain a more accurate T2 map. In this study, we combine the DP-TSE module with MRF framework, dubbed “DP-TSE MRF”, to simultaneously obtain accurate, high resolution, distortion-free T2 and ADCs maps in a reasonable time.
Method:
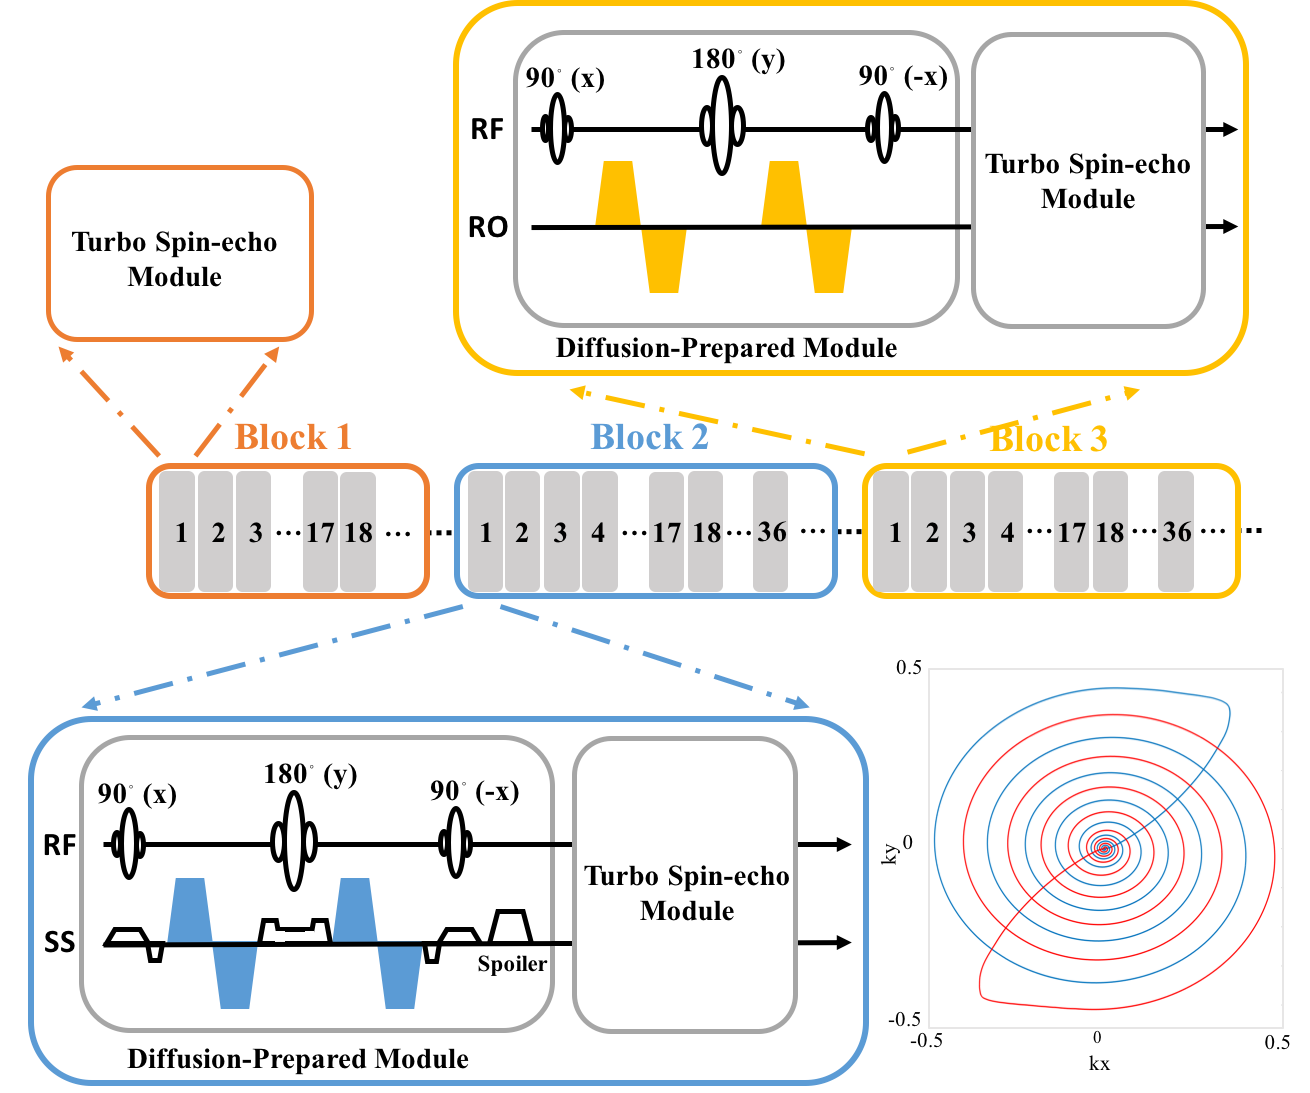
The procedure of the proposed method includes the following steps: (i) We designed a diffusion-prepared5 turbo spin-echo (DP-TSE) sequence with multiple blocks and measurements as shown in Fig.1. K-space was traversed using an 18-arm retraced spiral-in/out readout6 with the center region of k-space fully-sampled per arm. The central, oversampled region of k-space provided non-rigid motion correction for each diffusion imaging block. Variable TEs and b-values were utilized where b-values varied sinusoidally from 400-800 s/mm2 along the measurement dimension and six-TE varied from 22-132 ms along the echo dimension. (ii) A slice-selective diffusion preparation was used to enable interleaved, multislice DP-TSE acquisitions. Bipolar diffusion gradients were used to reduce the cardiac and respiratory motion artifacts. The slice sickness of the DP module was set to two times that of the TSE module to limit the flow effect. The total acquisition time per measurement was set to 2.2s for 15 slices. (iii) A dictionary of total 21675 elements was generated using these acquisition parameters in EPG7. The calculated entries of dictionary were rearranged4 along the measurement dimension in each block. (iv) A sliding-window matching algorithm8 was used in both dictionary and corresponding data in each block. The T2 values first derived from block 1 were then utilized as pre-calculated knowledge while estimating the ADCs from blocks 2-4.
All the experiments were performed on a 3T scanner (MAGNETOM Prisma, Siemens, Erlangen, Germany) with a 20-channel head coil in both a phantom and human subjects. In this study, each slice produced a total of 198 measurements over the four blocks with six-echo acquired per measurement. The slice thickness was 3 mm and in-plane spatial resolution of 1.0 × 1.0 mm2 was achieved for the FOV of 240 × 240 mm2. For validation, the corresponding T2 and ADC maps were also evaluated using a multi-TE, SE sequence and a single-shot diffusion-weighted EPI (SS-DW EPI) sequence with a b-value of 1000 s/mm2, as the gold-standard references.
Results and Discussion:
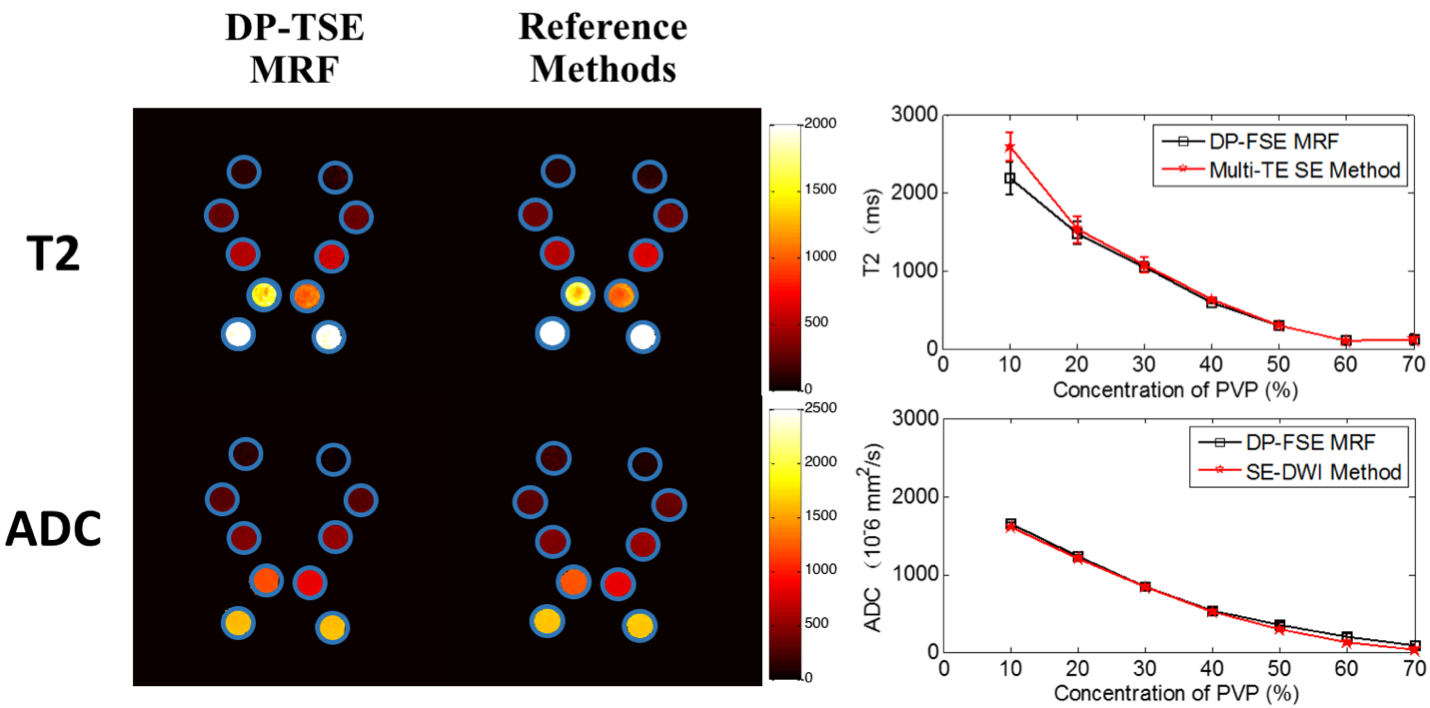
The T2 and ADC maps of phantom study are shown in Fig.2. The matched trends between these methods indicate that T2 and ADC parameters from DP-TSE MRF are in good agreement with those of multi-TE SE and SS-DW EPI.
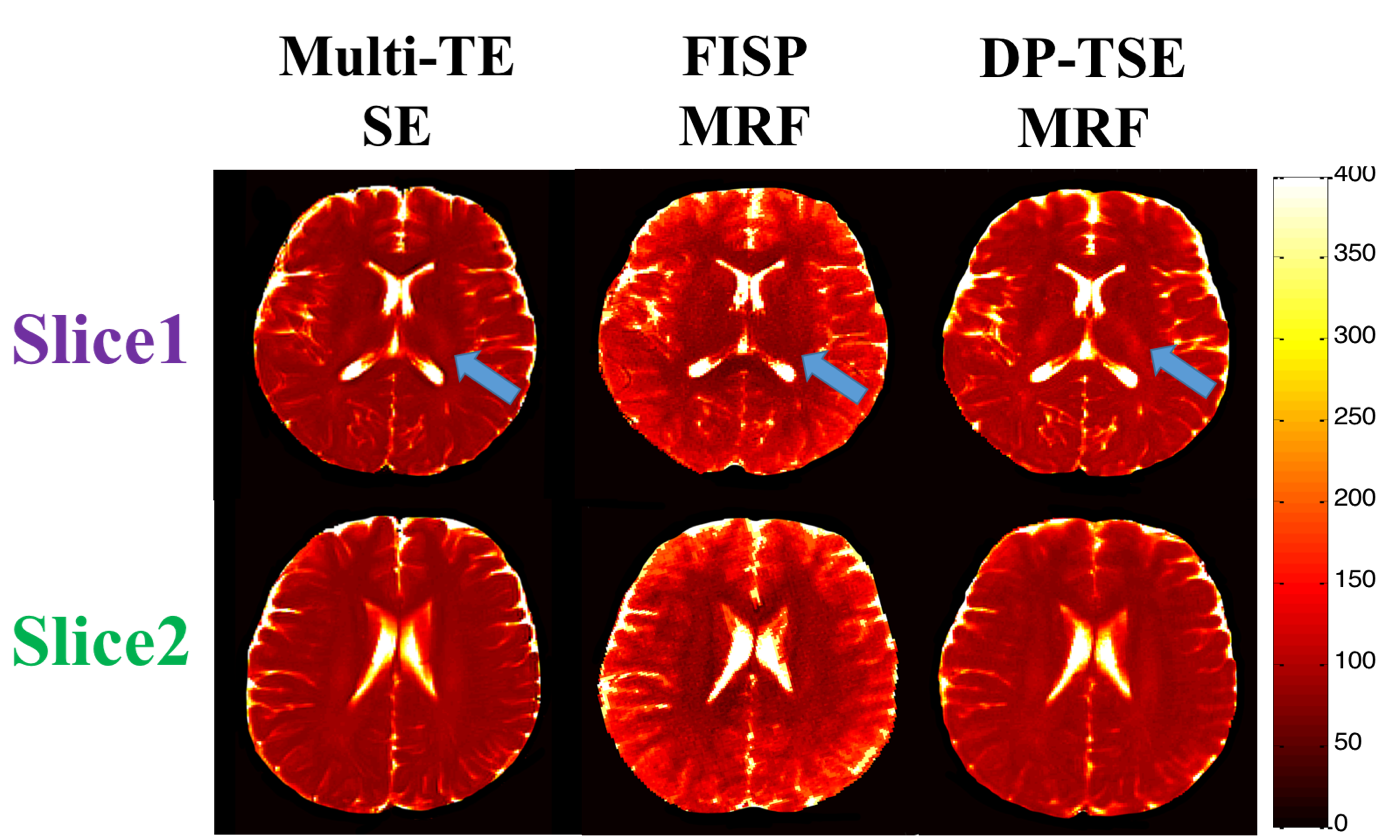
Two slices of from the T2 map acquired during the in-vivo study obtained with multi-TE SE, FISP-MRF and DP-TSE MRF methods are displayed in Fig.3. The blue arrows point to the structures of white matter (WM) in T2 map from the DP-TSE MRF sequence, which show the similar results while from FISP-MRF showing great differences, when compared with that from the multi-TE SE. Besides, the overall T2 values from FISP-MRF are the highest while from the reference are the lowest. Table.1 lists the averaged T2 values of these methods in typical ROIs, such as gray matter (GM) and WM. The results both shown in Fig.3 and Table.1 indicate that the proposed method likely provides more accurate T2 values with smaller standard deviation than FISP-MRF.
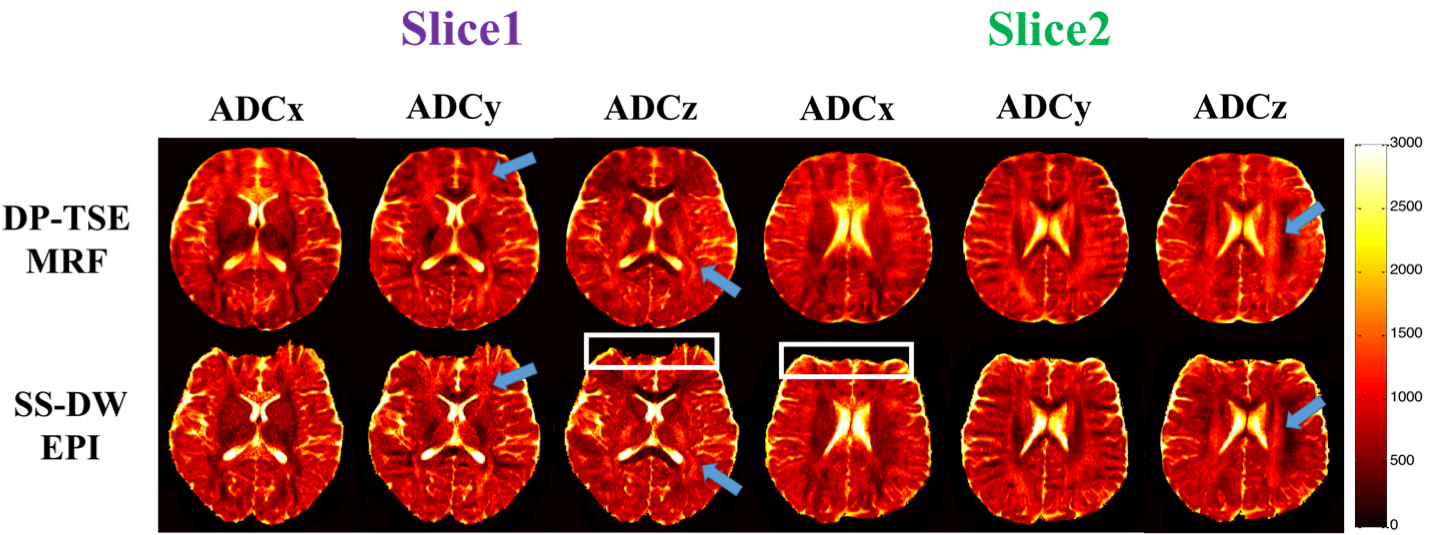
Two slices of three in vivo ADCs maps collected using the DP-TSE MRF and SS-DW EPI methods are shown in Fig.4. The white boxes indicate the severe image distortions in the SS-DW EPI acquisition, prohibiting practical co-registration. The blue arrows point to the obvious fiber detection in three orthogonal directions and the similar results between these methods. Table.1 lists the averaged ADC values from these methods in some representative ROIs (e.g. GM and different fiber components in WM). Due to the high resolution, the ADCs maps of the SS-DW EPI image display a relatively low SNR and are more sensitive to B0 inhomogeneity. For DP-TSE MRF, motion-induced phase corruption would be reduced greatly through SNAILS9 reconstruction but would still be invalid in some time points when the cardiac pulsation is strong.
Acknowledgements
No acknowledgement found.References
1. Ma D, Gulani V, Seiberlich N, Liu K, Sunshine JL, Duerk JL, Griswold MA. Magnetic resonance fingerprinting. Nature 2013;495(7440):187-192.
2. Jiang Y, Ma D, Seiberlich N, Gulani V, Griswold MA. MR fingerprinting using fast imaging with steady state precession (FISP) with spiral readout. Magn Reson Med 2015;74(6):1621-1631.
3. Jiang Y, Hamilton J, Lo W, Wright K, Ma D, Coristine A, Seiberlich N, Gulani V, Griswold MA. Simultaneous T1, T2 and Diffusion Quantification using Multiple Contrast Prepared Magnetic Resonance Fingerprinting. Proceeding 25th Annu Meet ISMRM, Honolulu. 2017:1171.
4. Liao C, Cao X, Wang Z, Li Q, Chen Y, Ye H, Ding Q, He H, Zhong J. IR-TSE MRF: Rapid and Accurate Parametric Mapping Using Inversion-recovery Turbo Spin Echo and MR Fingerprinting. Proceeding 25th Annu Meet ISMRM, Honolulu. 2017:3964.
5. Thomas DL, Pell GS, Lythgoe MF, Gadian DG, Ordidge RJ. A quantitative method for fast diffusion imaging using magnetization-prepared TurboFLASH. Magn Reson Med. 1998;39(6):950-960. doi:DOI 10.1002/mrm.1910390613.
6. Law CS, Glover GH. Interleaved spiral-in/out with application to functional MRI (fMRI). Magn Reson Med 2009;62:829–834.
7. Weigel M. Extended phase graphs: dephasing, RF pulses, and echoes - pure and simple. J Magn Reson Imaging 2015;41(2):266-295.
8. Cao X, Liao C, Wang Z, Ye H, Chen Y, He H, Chen S, Ding Q, Liu H, Zhong J. Robust Sliding-Window Reconstruction for Accelerating the Acquisition of MR Fingerprinting. Magn Reson Med. 2016, doi: 10.1002/mrm.26521.
9. Liu C, Bammer R, Kim D, et al. Self-navigated interleaved spiral (SNAILS): Application to high-resolution diffusion tensor imaging. Magn Reson Med., 2004, 52(6):1388-96.
Figures