0206
Quantitative MRI in early intervertebral disc degeneration: T1rho correlates better than T2 and ADC with biomechanics and matrix content1Orthopedic Surgery, Academic Medical Center, Amsterdam, Netherlands, 2Orthopedic Surgery, VU University Medical Center, Amsterdam, Netherlands, 3Epidemiology and Biostatistics, VU University Medical Center, Amsterdam, Netherlands, 4Plastic, Reconstructive and Hand Surgery, VU University Medical Center, Amsterdam, Netherlands, 5Oral and Maxillofacial Surgery, VU University Medical Center, Amsterdam, Netherlands, 6Biomedical Engineering and Physics, Academic Medical Center, Amsterdam, Netherlands
Synopsis
We correlated quantitative T2, T1rho and Apparent Diffusion Coefficient (ADC) values to disc mechanical behavior and gold standard early DDD markers in a graded degenerated lumbar IVD caprine model to assess their potential for early DDD detection. T1rho nucleus values correlate better than T2 and ADC with biomechanical, histological, and GAG changes.
INTRODUCTION
Low-back pain (LBP) has been correlated to the presence of intervertebral disc (IVD) degeneration on T2w MRI. It remains challenging, however, to accurately stage degenerative disc disease (DDD) based on T2w MRI and measurements of IVD height, particularly for early DDD.1-6
In this study, we correlated quantitative T2, T1rho and ADC values to disc mechanical behavior and gold standard early DDD markers in a graded degenerated lumbar IVD caprine model to assess their potential for early DDD detection.
METHODS
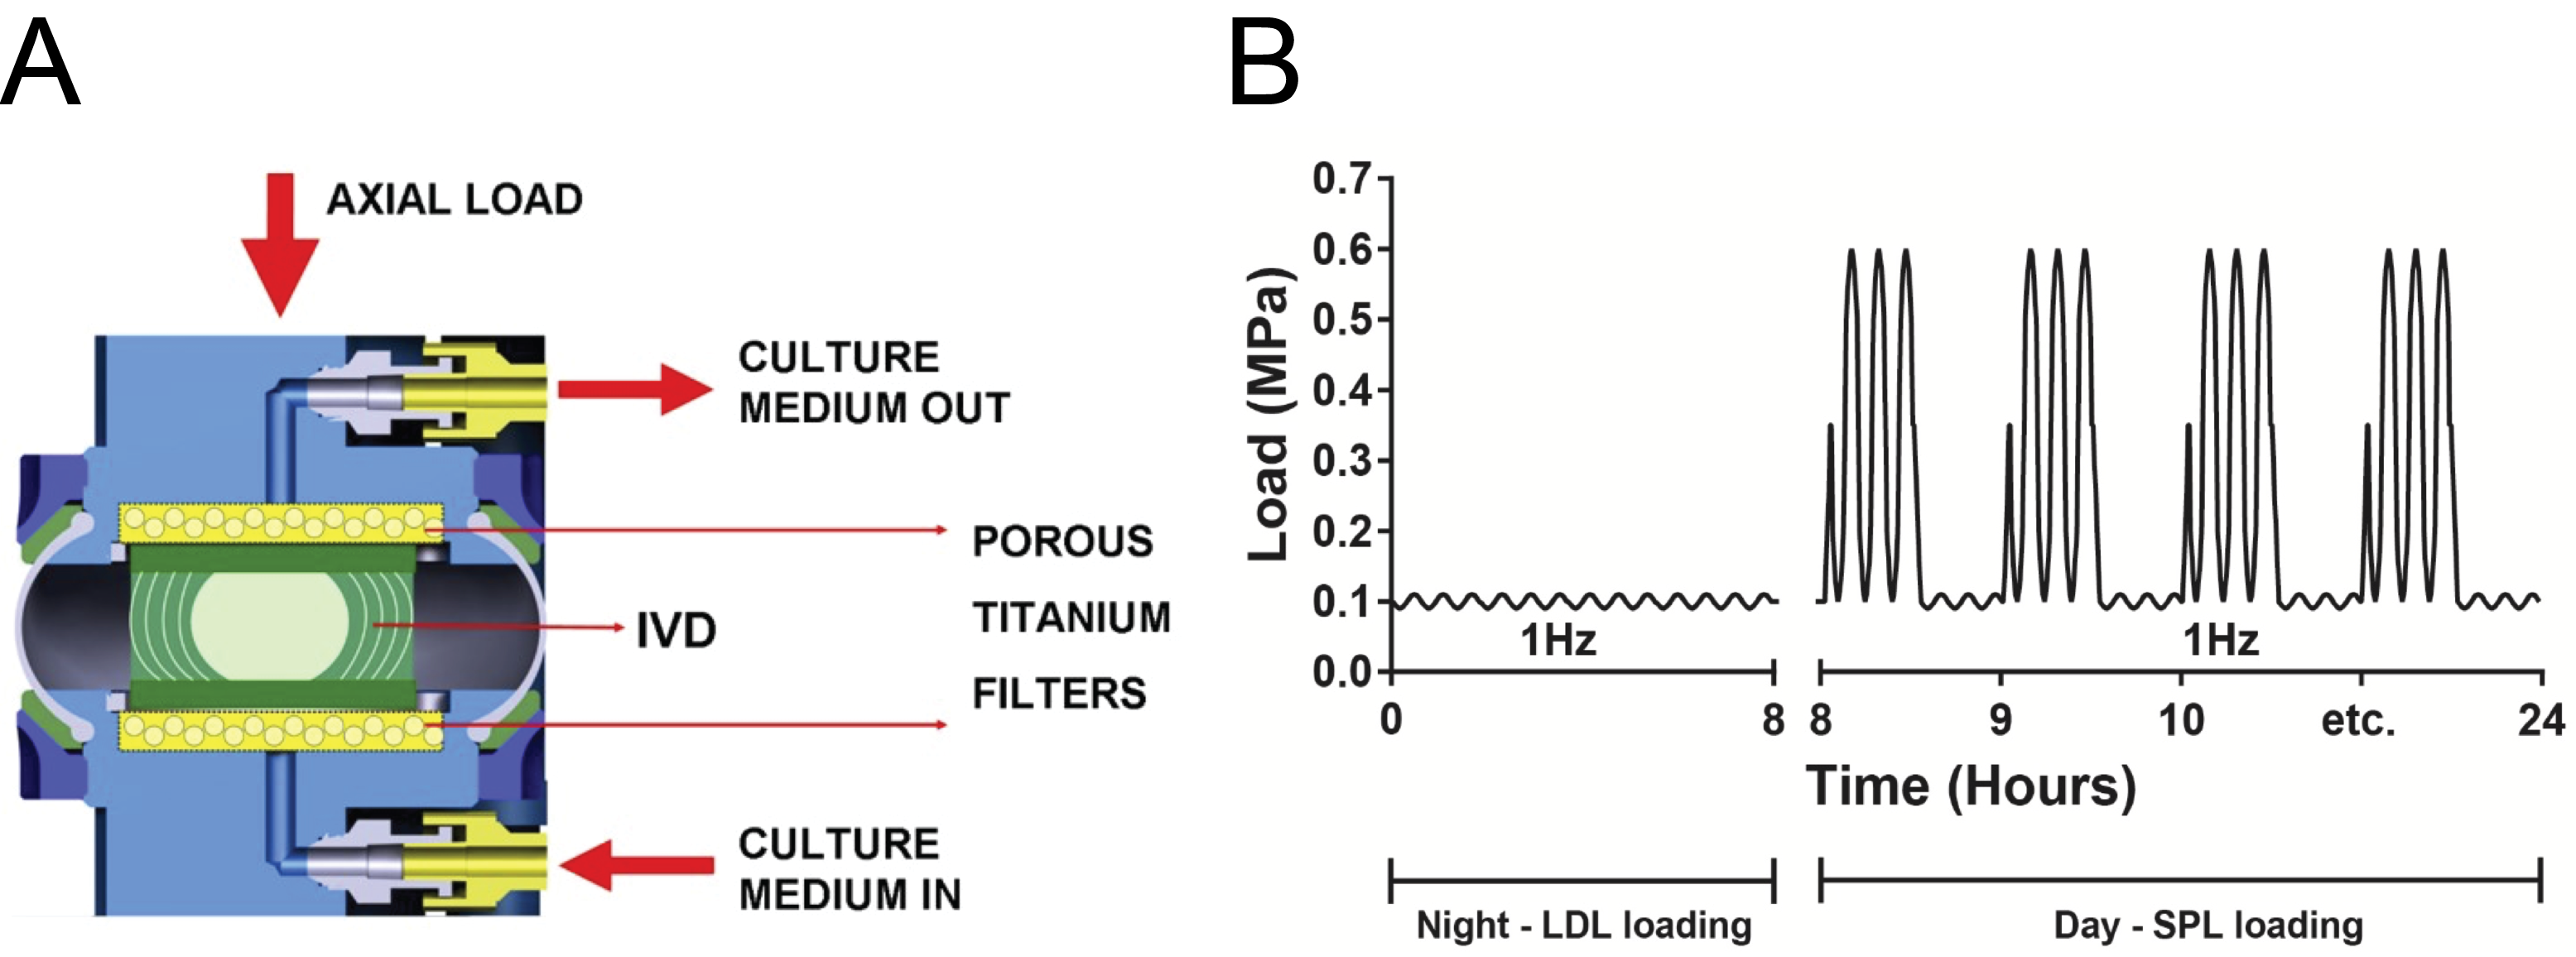
Lumbar caprine IVDs were injected with either 0.25 U/ml or 0.5 U/ml Chondroïtinase ABC (Cabc) to trigger early DDD-like degeneration. Injection with PBS served as control. IVDs were cultured in a bioreactor for 20 days under axial dynamic physiological loading (Figure 1).
High-resolution 9.4 T MR images were obtained prior to intervention and after culture. MRI measurements consisted of T2 mapping (multi-echo sequence, TR=3000ms, TE=9-108ms, 12 echoes, NA=2, matrix=128x128, acquisition time=9m36s), T1rho mapping (spin-lock preparation with gradient echo readout, TR=5000ms, TE=5ms, spin-lock RF amplitude=1000Hz, spin-lock time=5, 10, 20, 40, 60, 80, and 100ms, NA=1, matrix=128x128, acquisition time=37m20s) and ADC mapping (diffusion tensor spin-echo imaging sequence, TR=2000ms, TE=20ms, number of diffusion gradient directions=10, diffusion b-value=1000 s/mm2, one image with b-value=0s/mm2, NA=1, matrix=128x128, acquisition time=23m28s). For all sequences: slice thickness=1mm and FOV=30x30mm2.
Quantitative MR results were correlated to mechanical recovery behavior, histological degeneration grading (Rutges scoring), and the content of glycosaminoglycans (GAGs) and water. At day 20, mechanical recovery behavior during dynamic loading was quantified by fitting the relaxation displacement with a stretched exponential function, according to δ=(δ∞-δ0)[1-exp (-t/τ)β].
RESULTS
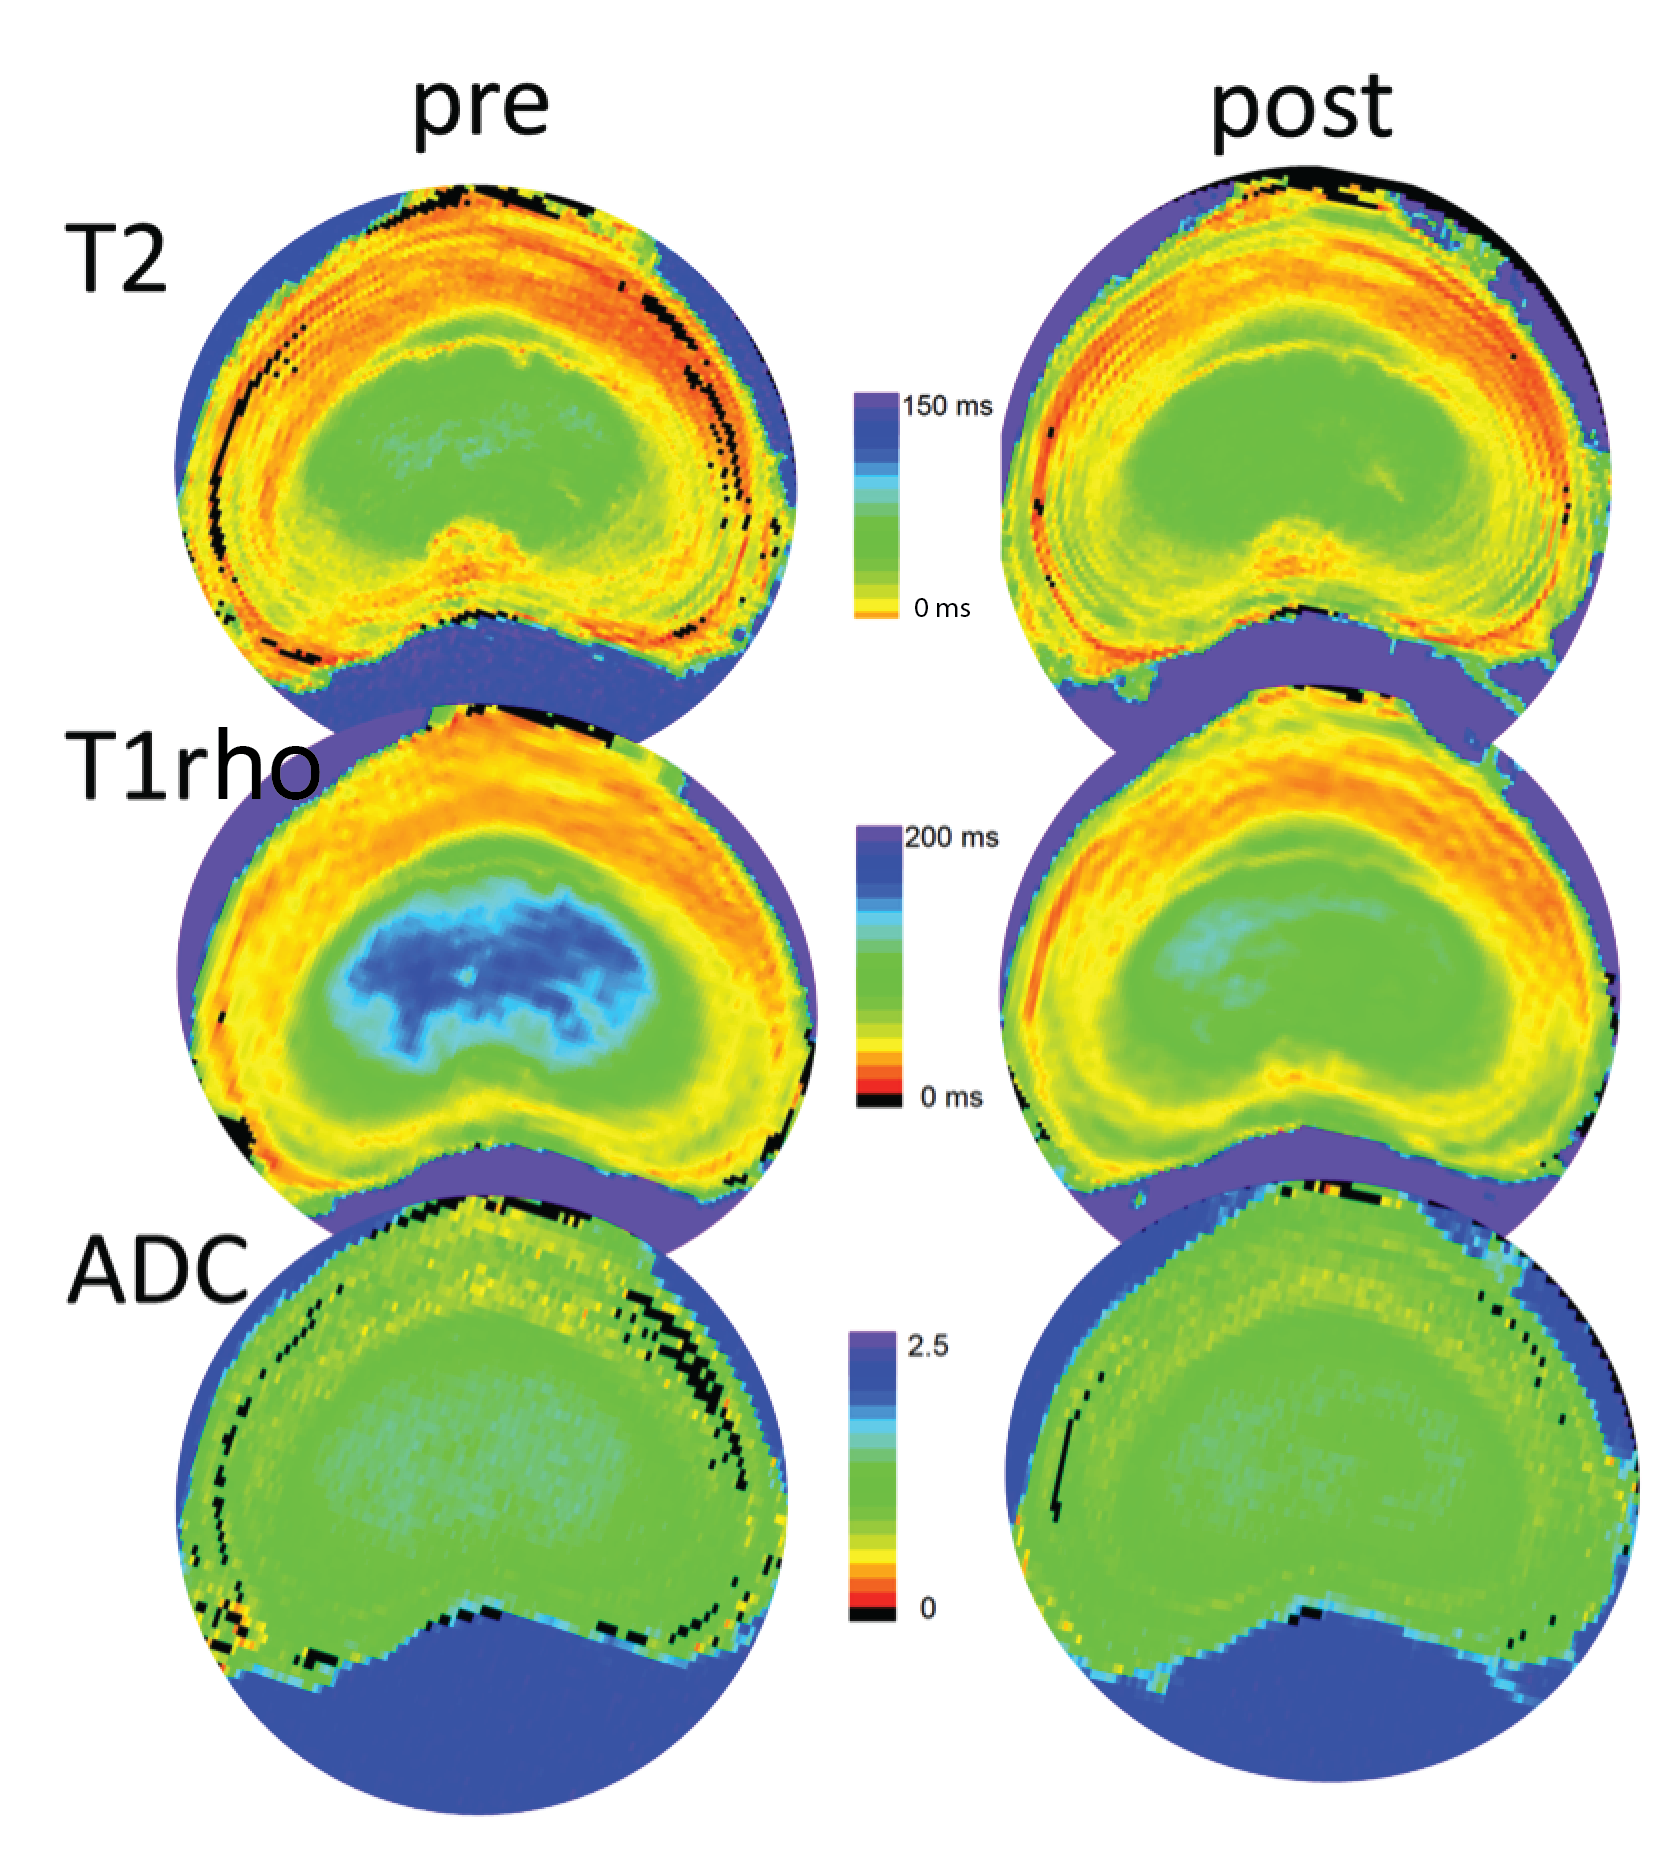
All MR sequences detected changes in matrix composition, with T1rho showing largest changes pre-to-post in the nucleus region and ADC in the anterior and posterior annulus. Figure 2 contains representative quantitative parameter maps (T2, T1rho, and ADC) of a mid-level transverse slice of 0.25 Cabc-injected IVD pre- and post-experiment. Post-culture T2 and T1rho values in all three experimental groups were significantly lower in the nucleus region compared to baseline (p<0.001). When comparing the measured changes between T2 and T1rho in the nucleus, T1rho dropped significantly more (overall average 12%; p<0.001) in all intervention groups. ADC values in the anterior and posterior outer-annulus of the 0.5 Cabc group displayed a larger drop in signal than those for the 0.25 Cabc and PBS group. However, when compared with PBS none were significant different in any region.
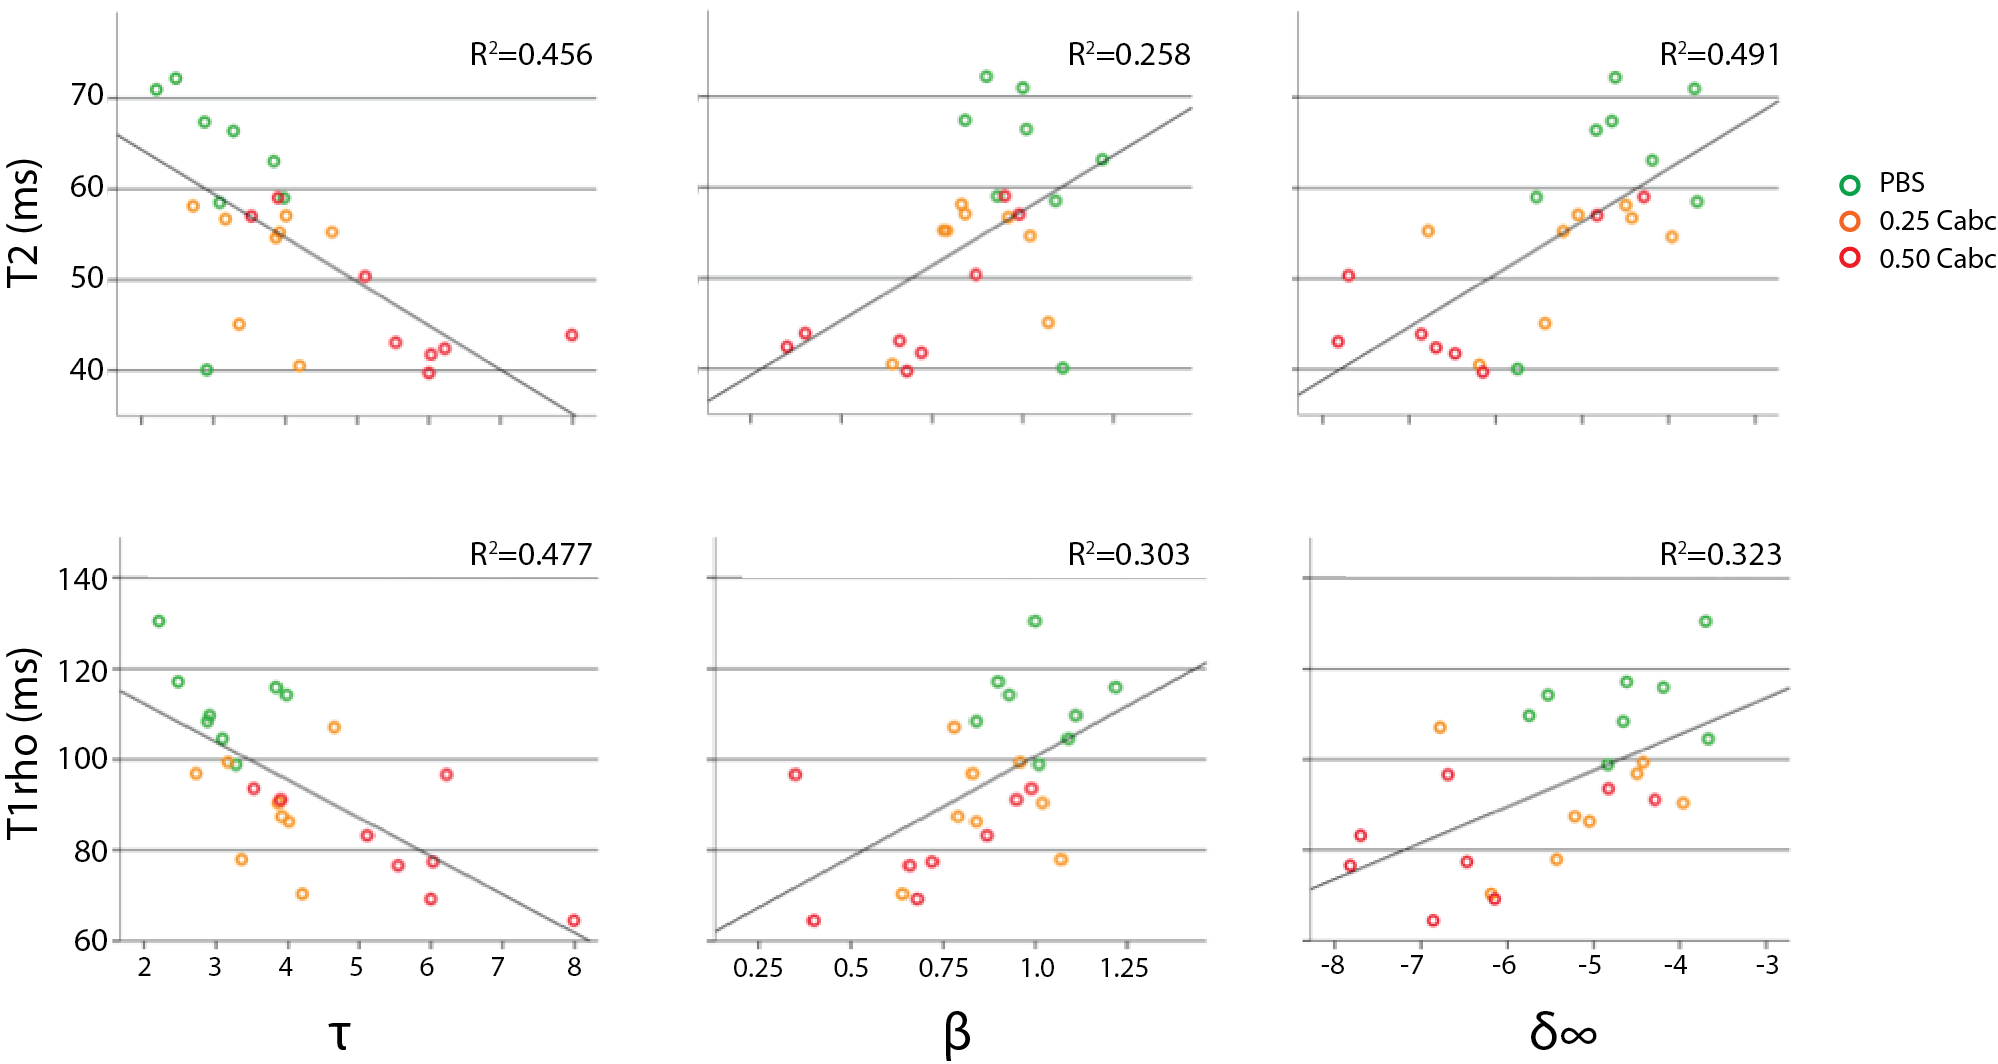
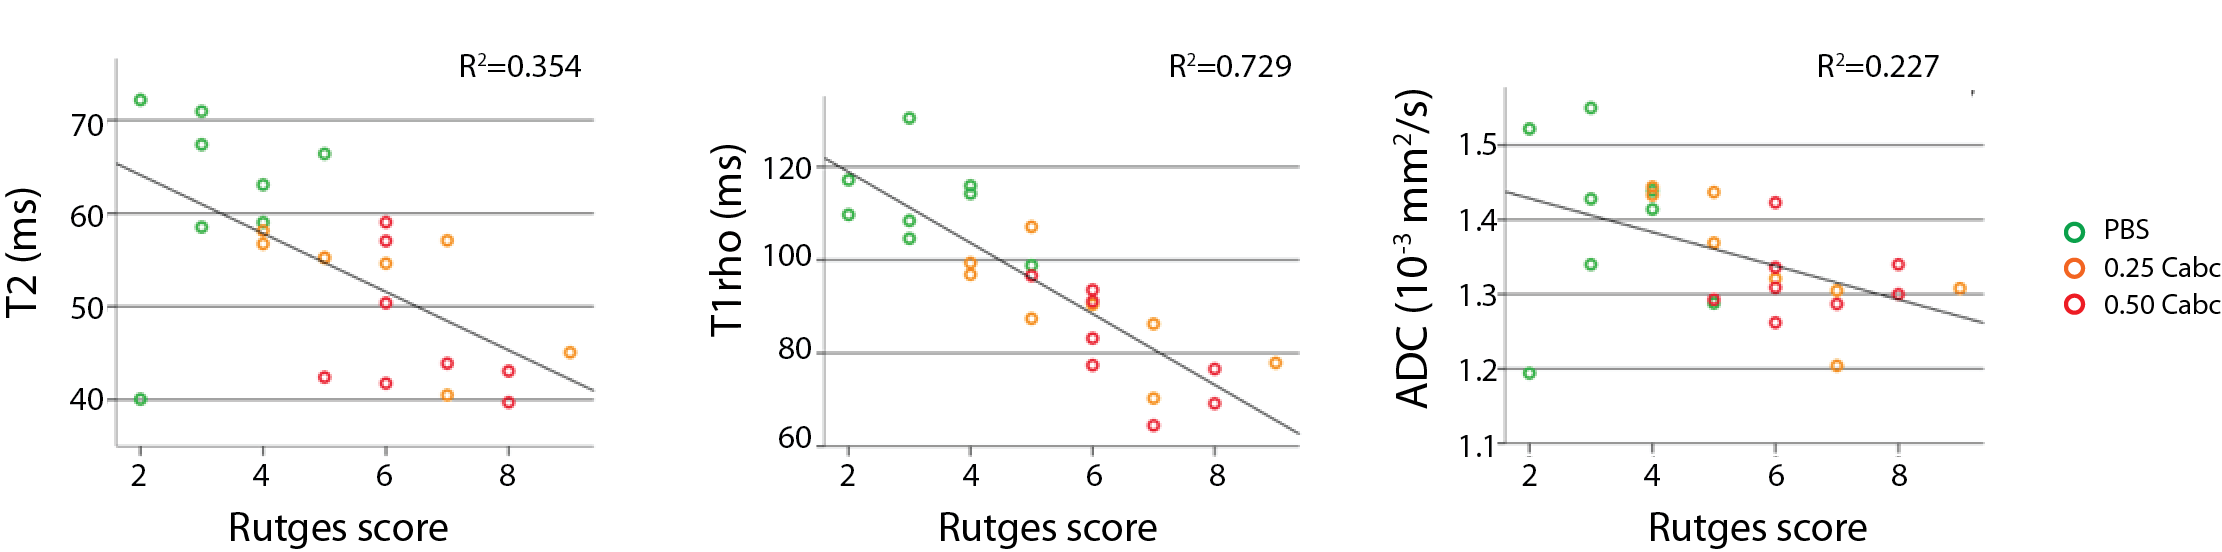
Quantitative MRI readouts were correlated to disc biomechanics after loading and degeneration (Figure 3). T2 and T1rho nucleus values had an equal negative moderate correlation with τ. For β and δ∞ both had a moderate positive correlation. For the ADC neither the separate outer-annulus region values nor a mean outer-annulus value showed any correlation (data not shown). Figure 4 shows the correlations between MRI and the histological score for degeneration. The Rutges score in the PBS group was the lowest (mean score=3.6), corresponding with no or mild degenerative changes. Both Cabc groups had scores ranging between 4 and 9 (0.25 Cabc, mean score=5.8; 0.5 Cabc, mean score=6.2), showing mild to moderate degenerative changes. T1rho values correlated strongly with the degeneration score, and significantly better than T2 and ADC nucleus values.
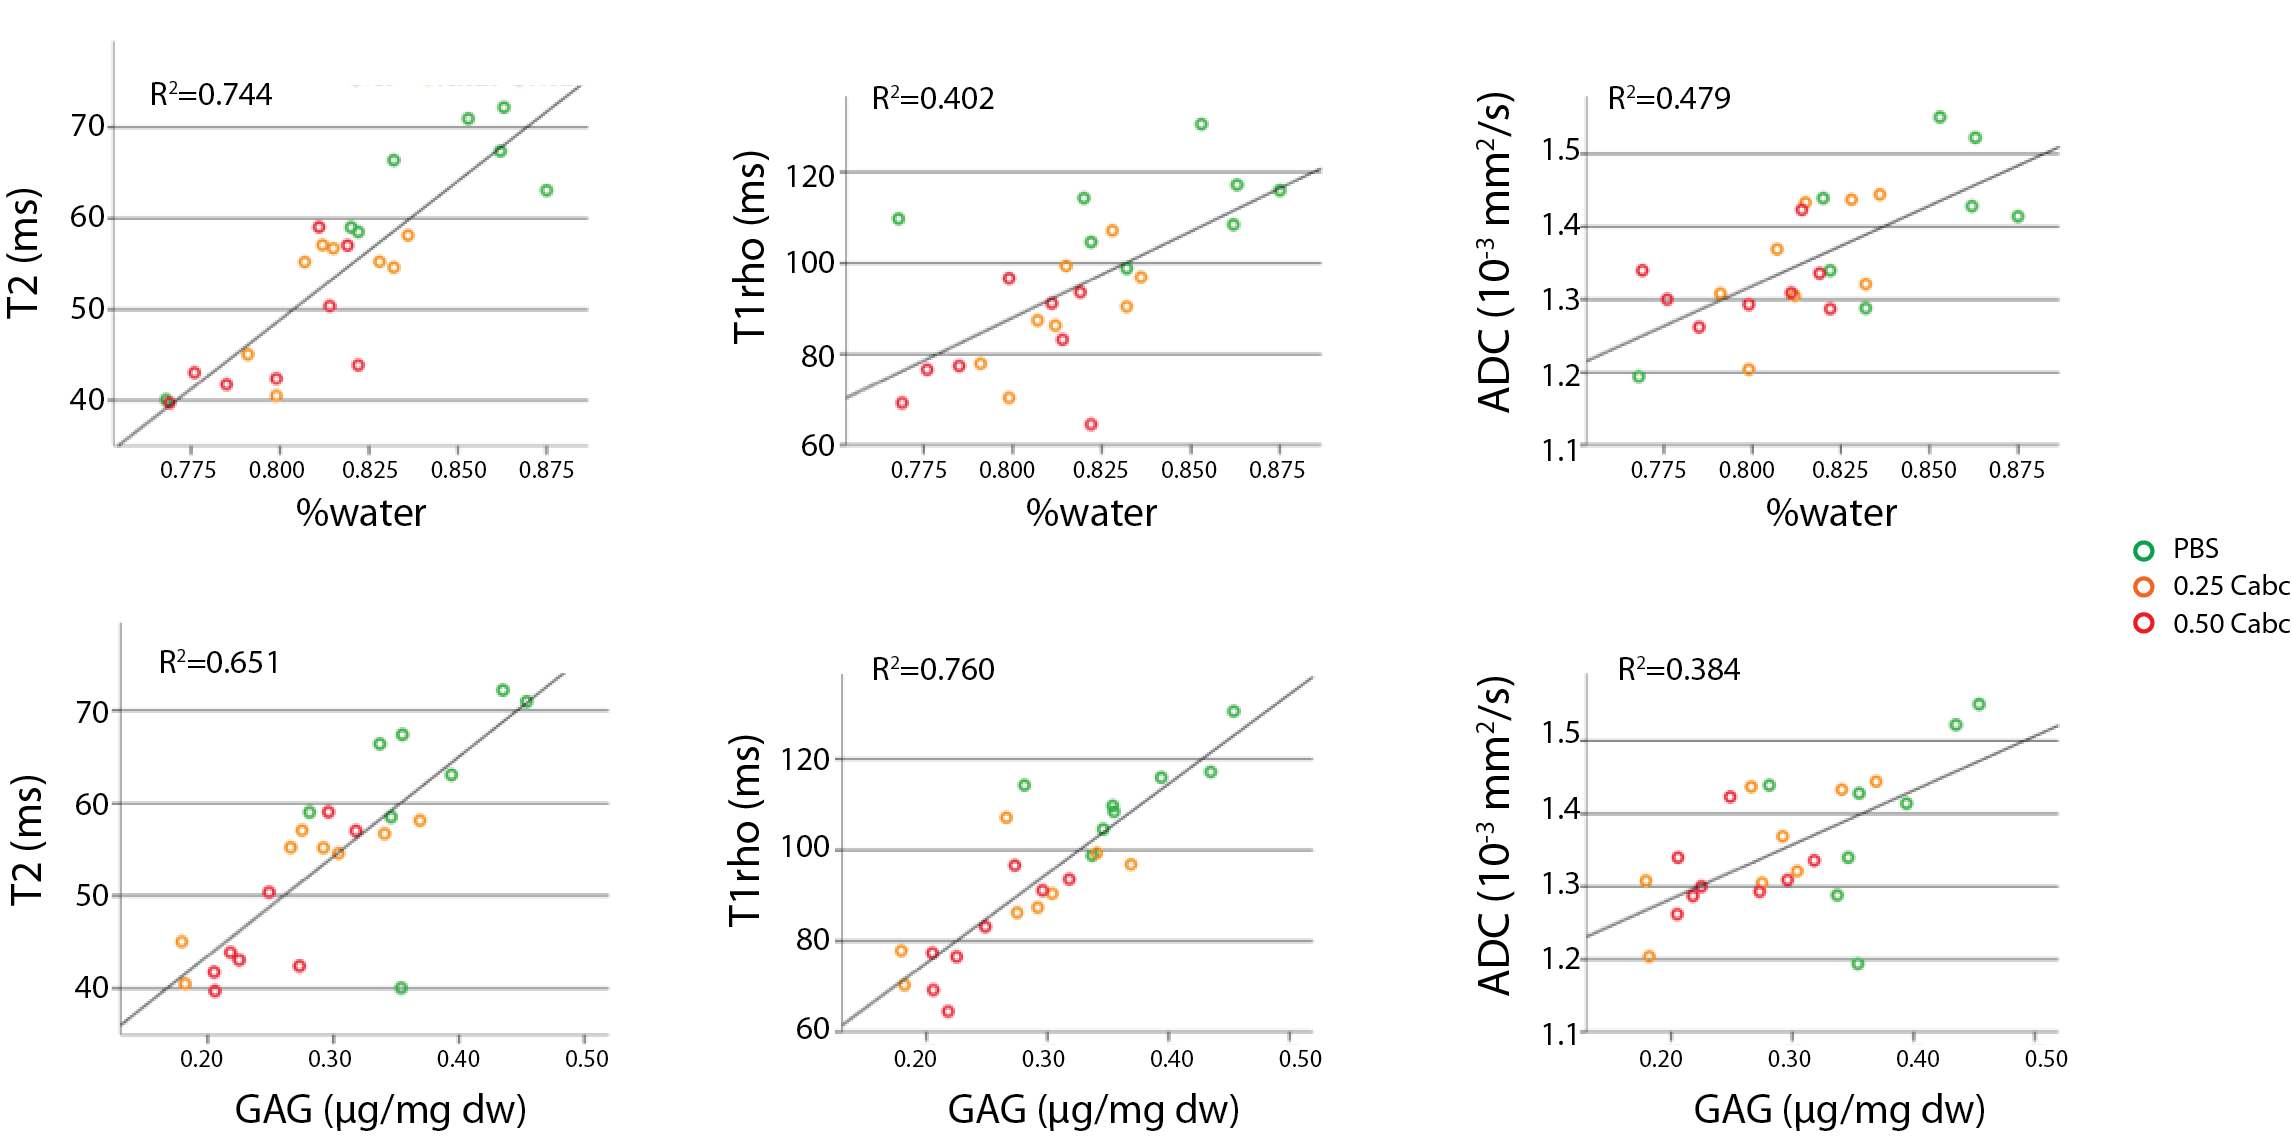
Finally, MRI readouts were correlated to matrix-content (water and GAG) in the nucleus (Figure 5). T2 had a strong positive correlation with water content, significantly better than T1rho and ADC, which displayed a modest positive correlation. T1rho had the strongest positive correlation to GAG-content, significantly better than T2 and ADC.
CONCLUSIONS
In this study we demonstrated that quantitative MR mapping, and T1rho in particular, is sensitive to small degenerative changes in the IVDs matrix. To our knowledge, this is the first study to directly compare the correlation of quantitative high-resolution T2, T1rho, and ADC maps with actual disc mechanical recovery behavior. These correlations combined with histology and GAG-content in a lumbar IVD large-animal model and region-specific results, demonstrate that T1rho nucleus values correlate with GAG content, histological degeneration, as well as disc mechanical properties to a higher degree than T2 and ADC.
Acknowledgements
References
1. Waris E, Eskelin M, Hermunen H, Kiviluoto O, Paajanen H. Disc degeneration in low back pain: a 17-year follow-up study using magnetic resonance imaging. Spine (Phila Pa 1976 ). 2007;32(6):681-4.
2. Erkintalo MO, Salminen JJ, Alanen AM, Paajanen HE, Kormano MJ. Development of degenerative changes in the lumbar intervertebral disk: results of a prospective MR imaging study in adolescents with and without low-back pain. Radiology 1995;196(2):529-33.
3. Jensen TS, Albert HB, Soerensen JS, Manniche C, Leboeuf-Yde C. Natural course of disc morphology in patients with sciatica: an MRI study using a standardized qualitative classification system. Spine 2006;31(14):1605-12.
4. Boden SD, Davis DO, Dina TS, Patronas NJ, Wiesel SW. Abnormal magnetic-resonance scans of the lumbar spine in asymptomatic subjects. A prospective investigation. The Journal of bone and joint surgery American volume 1990;72(3):403-8.
5. Jensen MC, Brant-Zawadzki MN, Obuchowski N, Modic MT, Malkasian D, Ross JS. Magnetic resonance imaging of the lumbar spine in people without back pain. N Engl J Med 1994;331(2):69-73.
6. Jensen MC, Kelly AP, Brant-Zawadzki MN. MRI of degenerative disease of the lumbar spine. Magn Reson Q 1994;10(3):173-90.
Figures