0205
Local associations between intervertebral disc T1rho/T2, muscle health, physical activity, and clinical disability using voxel-based relaxometry1UCSF/UC Berkeley Graduate Program in Bioengineering, University of California, San Francisco, San Francisco, CA, United States, 2Radiology and Biomedical Imaging, University of California, San Francisco, San Francisco, CA, United States
Synopsis
Region of interest based analysis of intervertebral disc composition in low back pain populations is (1) time-consuming and (2) limited in reproducibility, even more so in patients with advanced degeneration. This study applies voxel-based relaxometry (VBR) to investigate the spatial distributions of T1ρ and T2 in lumbar intervertebral discs, and their association to patient reported outcomes and spinal muscle health. Our results demonstrate the potential to use VBR as a tool to more effectively measure biochemical differences in the intervertebral discs across low back pain subgroups and monitor changes over time.
Introduction
Low back pain (LBP) is the leading cause of disability globally, affecting between 15-35% of the population at some point in their lifetime.1 Despite the high prevalence, LPB etiology and pathogenesis remain unclear. Consequently, LPB treatments fail to deliver consistent results across patient populations. There is a growing need for non-invasive imaging biomarkers which better differentiate LBP patient subgroups and characterize disease phenotypes in order to effectively target treatments.
Intervertebral disc degeneration, as determined on anatomical MR images, is positively correlated with low back pain.2,3 Previous studies have shown MR parameters such as T1ρ/T2 relaxation are sensitive to the biochemical changes of early stage disc degeneration: proteoglycan loss, dehydration, and disorganization of annular collagen.4,5 For quantitative image analysis, these studies have relied on region-of-interest (ROI) methods, calculating average relaxation values per compartment. However, it is difficult to accurately and reproducibly separate the nucleus from the annulus, especially in patients with severe deformity and degeneration. This study aims to demonstrate the feasibility of using voxel-based relaxometry (VBR) to semi-automatically and reproducibly explore the spatial distribution of T1ρ, T2 in LBP patients. Specifically, this study seeks to examine the association between relaxation values, muscle health, and patient reported outcomes and variables.
Methods
Twelve patients with documented low back pain were recruited and consented as per Committee on Human Research protocol. Figure1 details patient reported outcomes and variables. MR images of T12 to S1 were acquired on a 3T scanner (GE 750W; GE Healthcare, Waukesha, WI) with 8-12 elements of a GEM Posterior Array Embedded coil. MR imaging protocol included an 8min sagittal simultaneous T1ρ/T2 sequence (MAPSS)6: TR=5.8ms, BW=62.5kHz, FOV=200mm, voxel_size=0.8x0.8x8mm, TSL=0/10/40/80ms, FSL=500Hz, TE=0/12/25/51ms. Modified Pfirrmann grading was performed by a board-certified radiologist on a 5min T2W sagittal 3D FSE image. A 7min axial IDEAL (3D EFGRE) sequence was acquired for manual segmentation and quantification of spinal muscle volume and fat fraction.
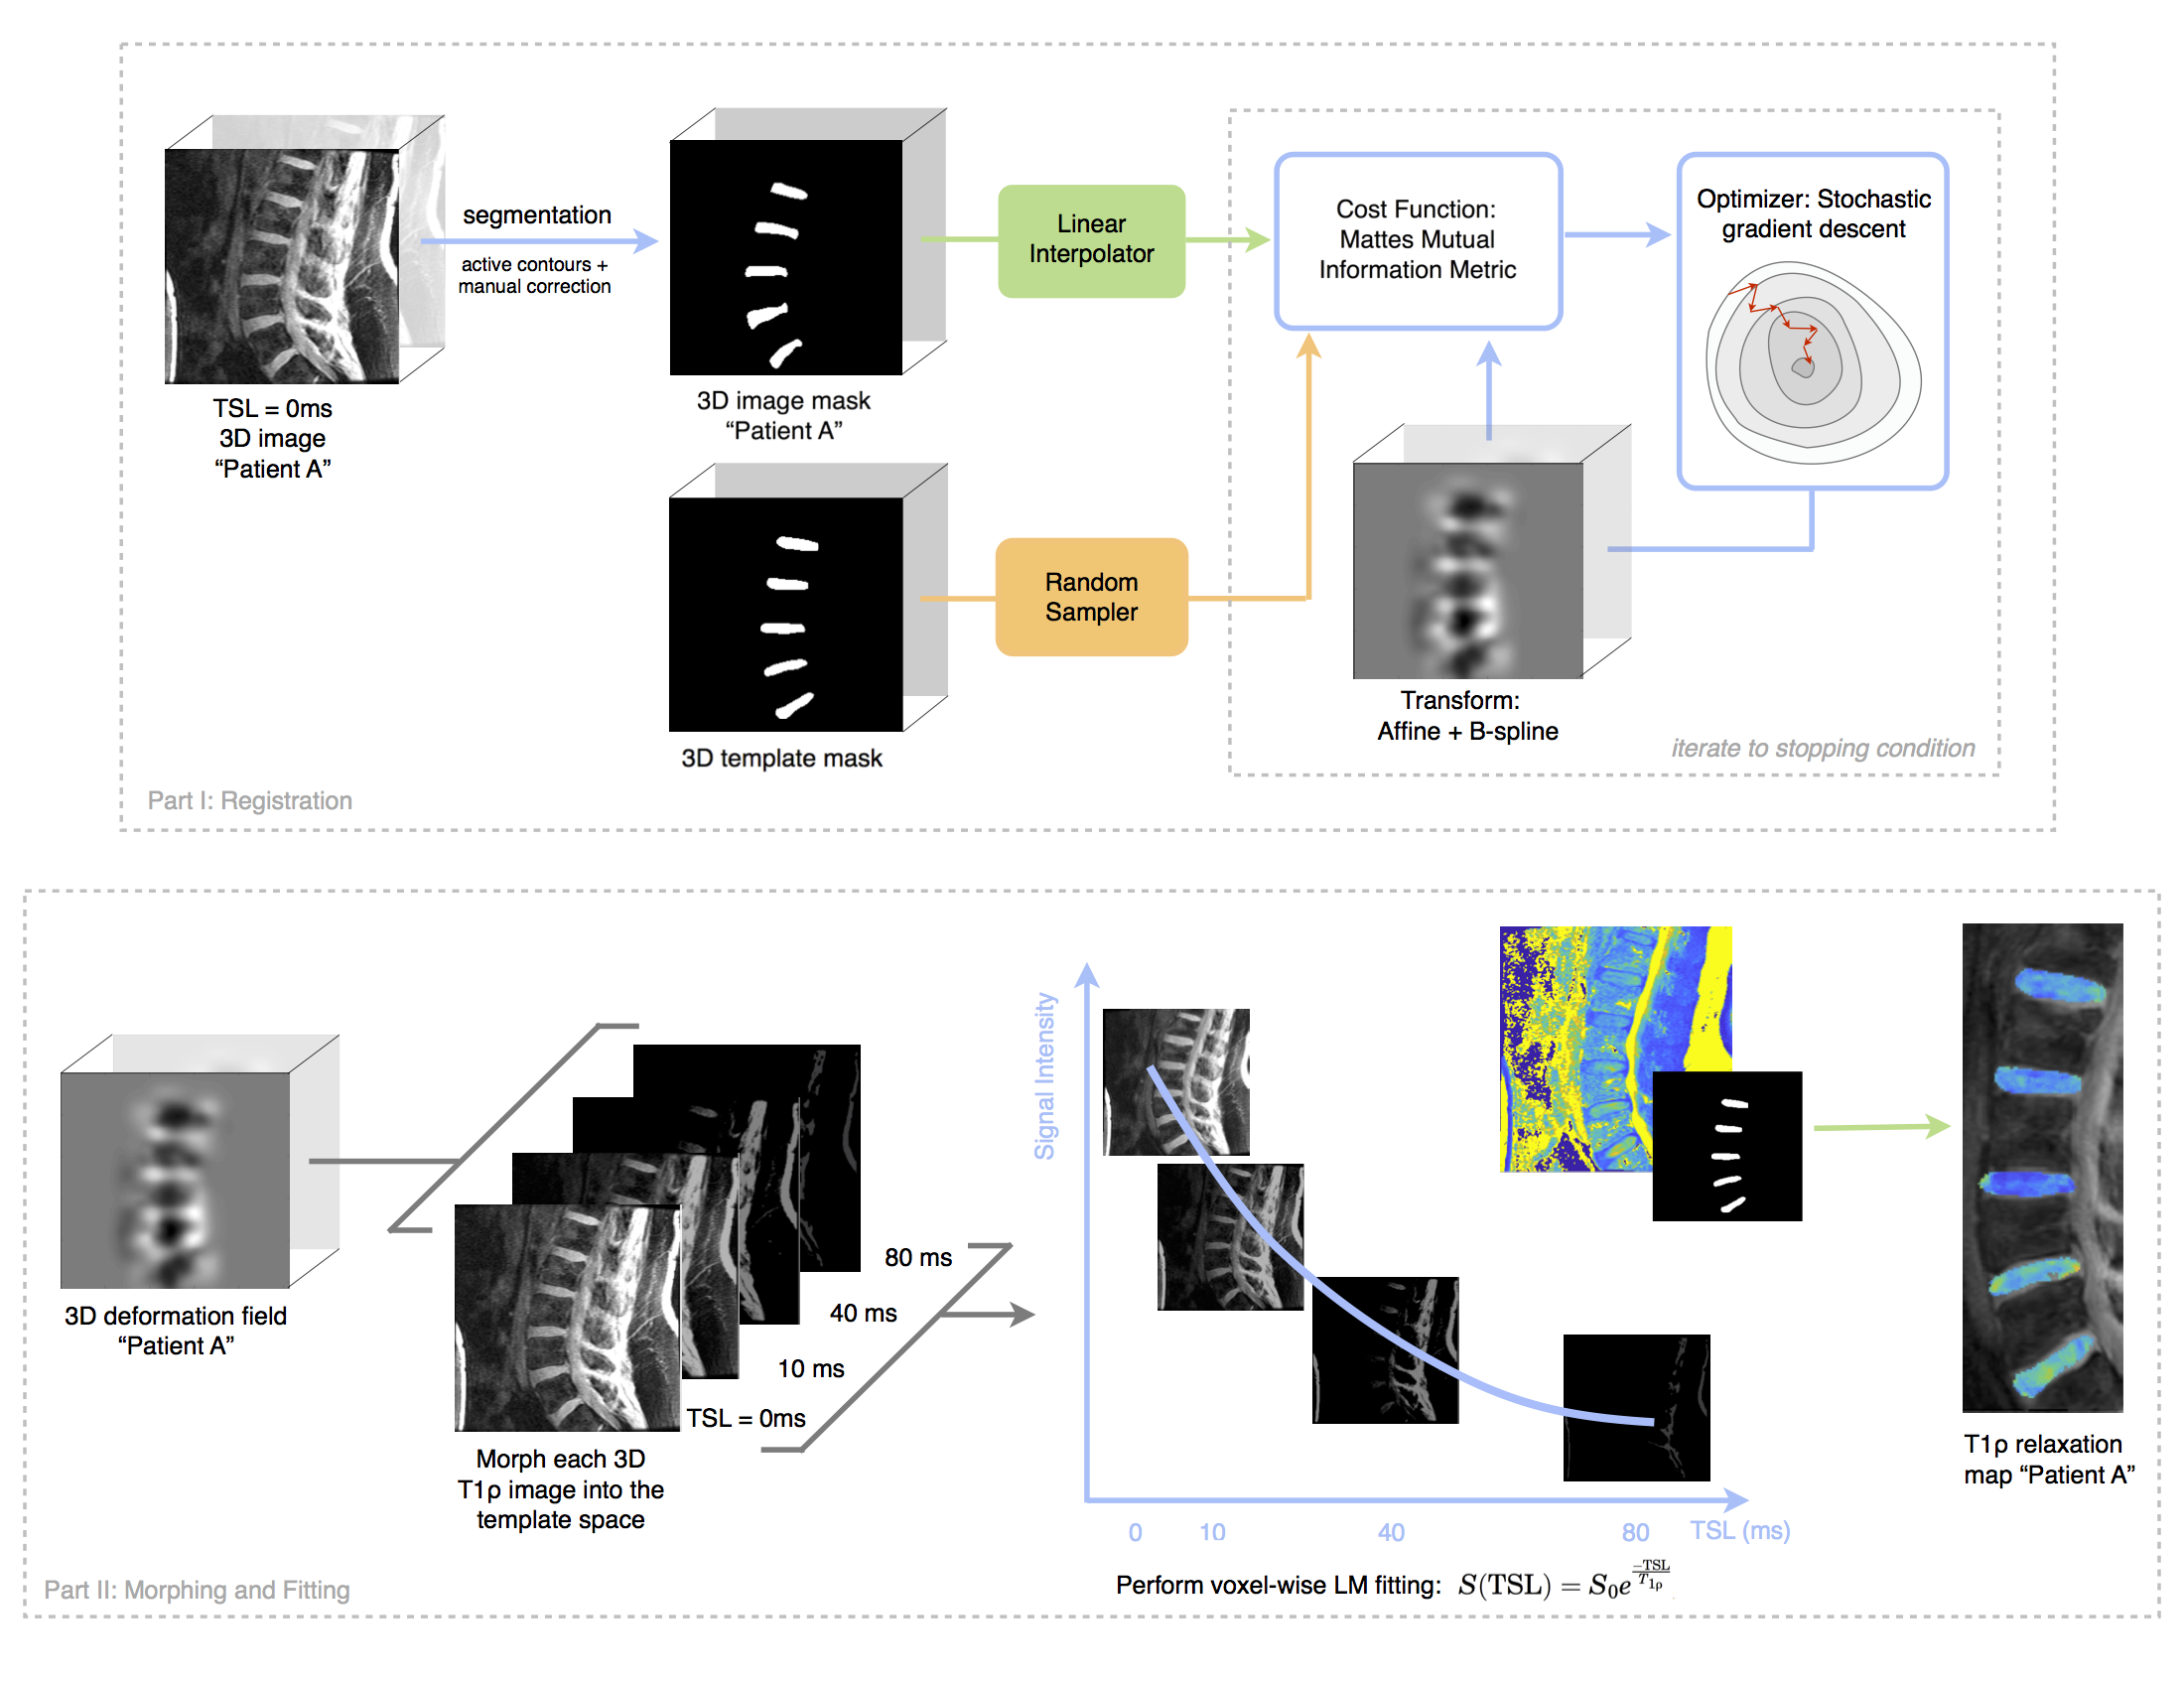
Image segmentation, registration, and fitting was performed using Elastix7 and an in-house Matlab processing package (IPP)8 Figure2. Image volumes were aligned to the MIP in the axial plane. Lumbar intervertebral discs were segmented semi-automatically using active contours and corrected manually for cases of severe degeneration. Binary masks were created to accommodate morphometric differences between subjects during the global affine and B-spline registration to a template mask. The resulting 3D deformation fields were applied to T1ρ and T2 images, and monoexponential fitting was performed on a voxel-by-voxel basis. Resulting maps were checked visually to ensure local distributions of relaxation values were preserved. Voxel-wise statistics were computed using Pearson’s correlation for T1ρ/T2 correspondence and partial correlations for voxel-to-variable analysis adjusting for gender and age.
Results and Discussion
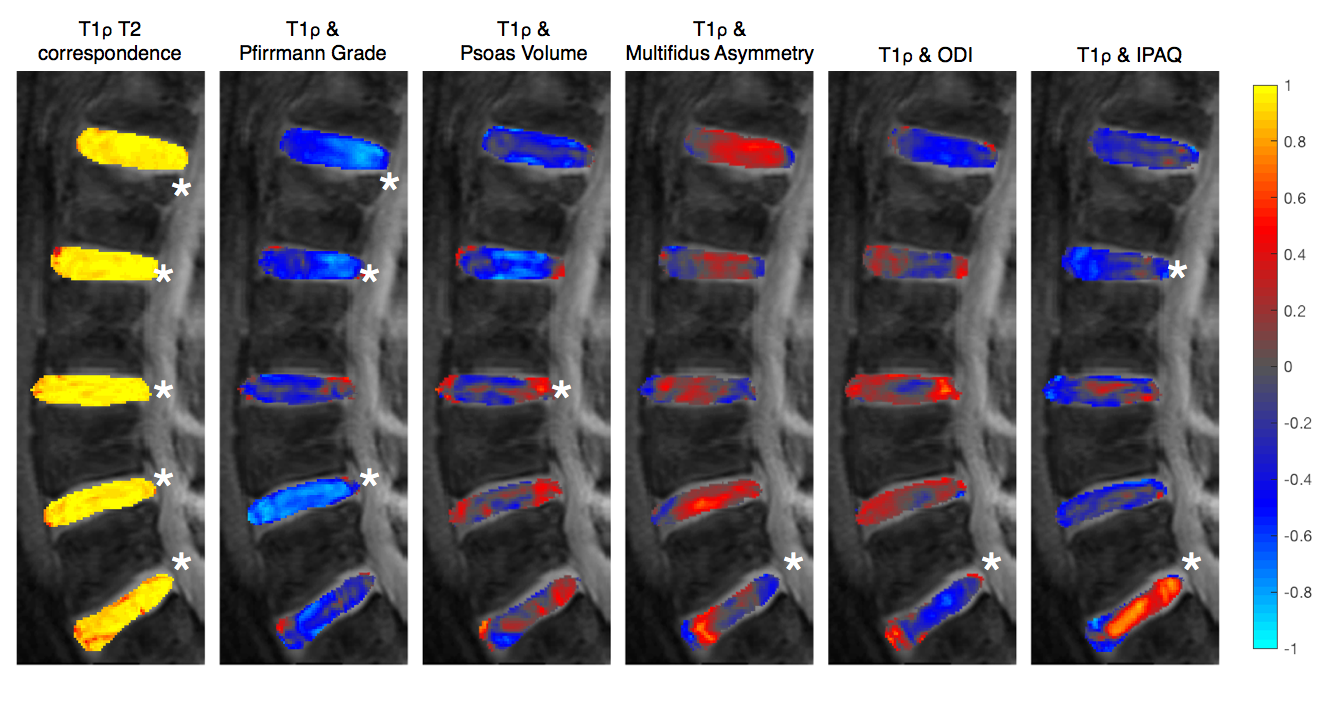
Modified Pfirrmann grade of each disc showed strong negative correlations with T1ρ at that disc level. As discs become degenerated, proteoglycan concentration decreases and slow rotational molecules become more restricted, thus lowering T1ρ. T1ρ and T2 were significantly correlated throughout the disc, with greatest variations in spatial distribution appearing at the disc periphery Figure3. These findings are in agreement with prior research and serve as a validation for our methodology.
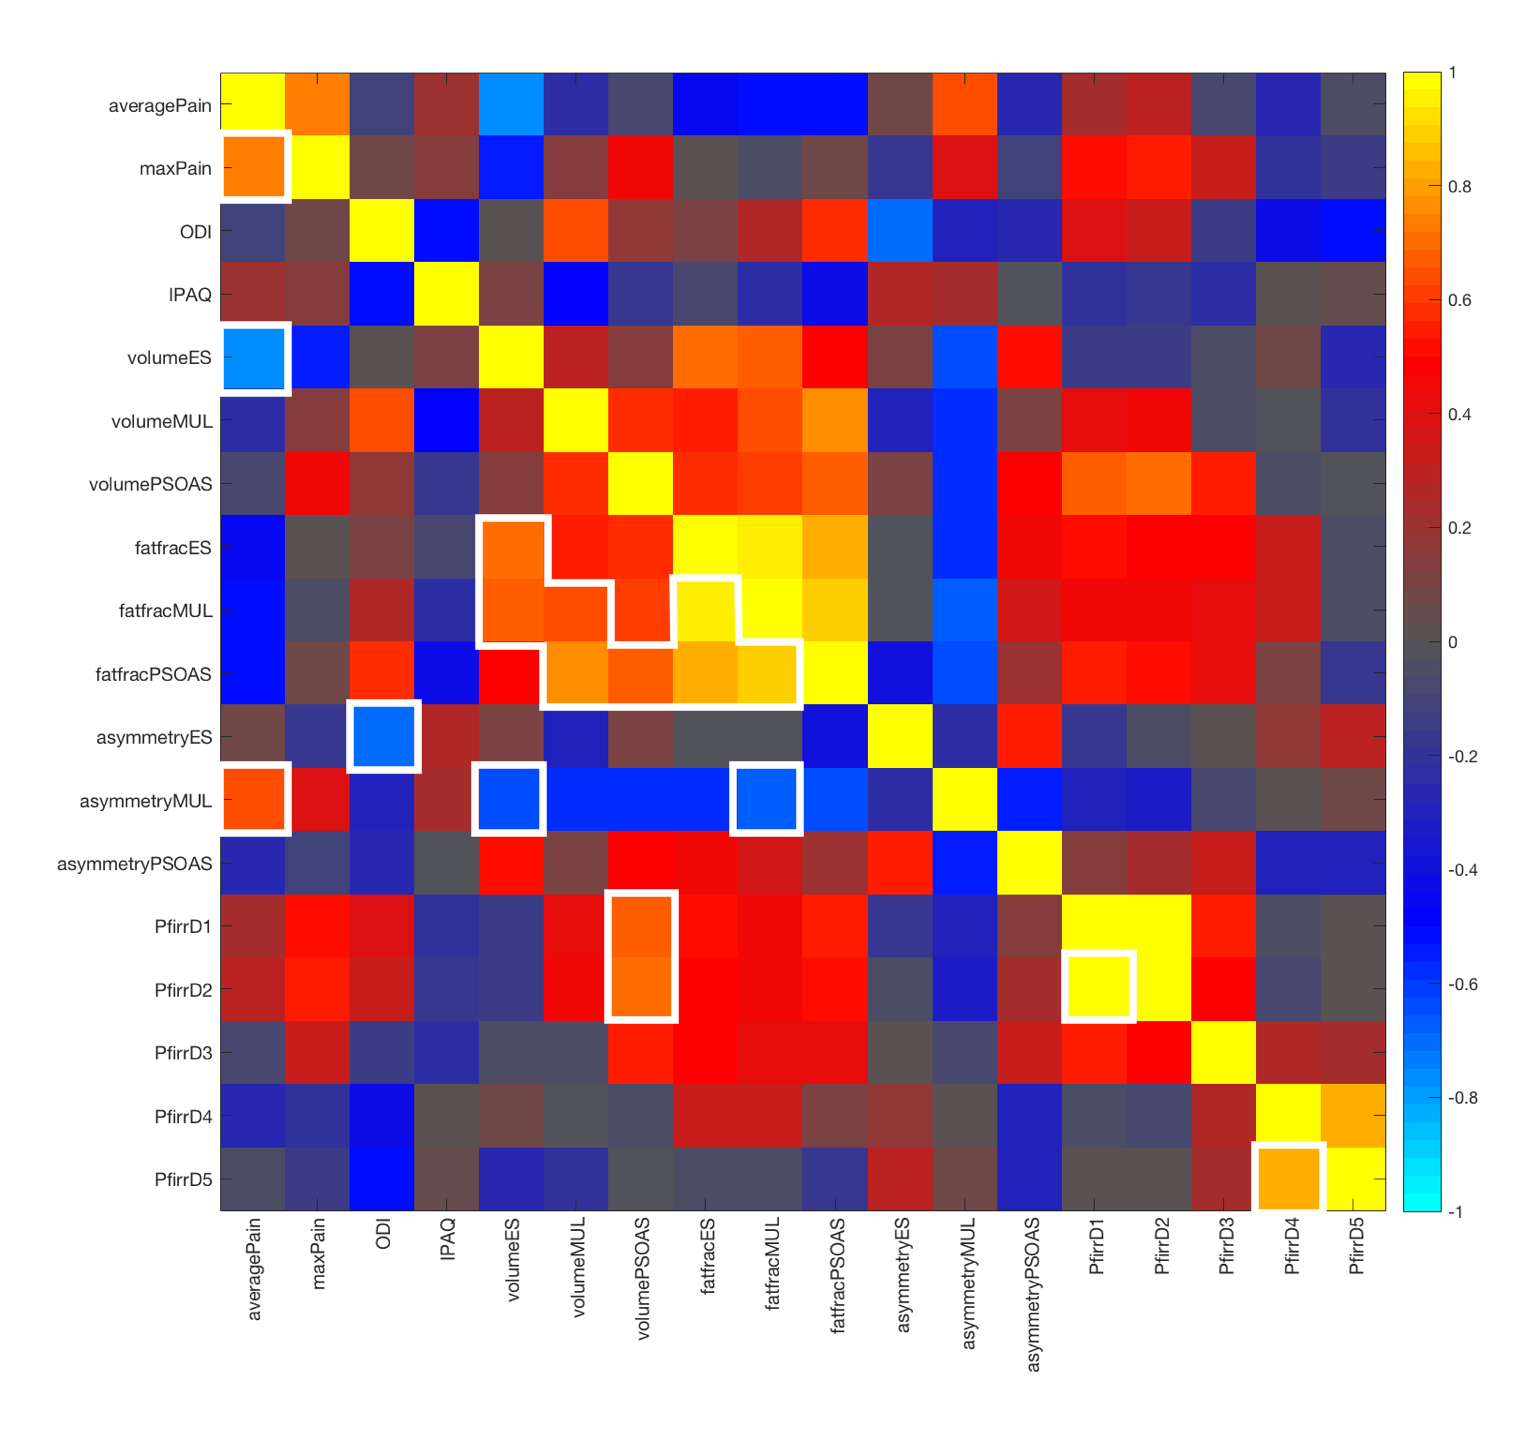
Muscle volume and muscle asymmetry correlations varied across levels and within discs for the psoas, erector spinae, and multifidus muscles. Erector spinae asymmetry was negatively correlated with T1ρ in L3/L4: greater percent difference in volume was related to lower T1ρ values. There was a weak negative association between muscle volume and T1ρ, which may be explained by differences in BMI. Muscle fat fraction showed negative and positive correlations to maxPain and ODI respectively Figure4.
IPAQ categorical score and ODI showed statistically significant positive and negative correlations in L5/S1. Greater disability was associated with lower T1ρ in L1/L2 and L5/S1. Higher physical activity was associated with higher T1ρ in L5/S1, with a strong correlation in the nucleus and the posterior annulus. Adjusting for pain, the relationship between IPAQ and T1ρ remained statistically significant.
Conclusions
VBR is an effective tool to explore differences in local disc biochemistry between LBP patient groups. Strong correlations were found between muscle health, physical activity, disability, and T1ρ/T2. Associations were level-specific, and varied within the disc along the AP direction. A larger patient population with age and gender matched controls would be necessary to confirm the significance of moderate associations. As a method, VBR is scalable to larger studies as it is less time-consuming and more reliable than classical ROI approaches. Future work will attempt to differentiate non-pathological degeneration from pathological degeneration and track subtle responses to treatment within LBP patient populations.Acknowledgements
NIH T32 GM 815532
NIH R01 AR069006
References
1Hoy, Damian, Lyn March, Peter Brooks, Fiona Blyth, Anthony Woolf, Christopher Bain, Gail Williams, et al. 2014. “The Global Burden of Low Back Pain: Estimates from the Global Burden of Disease 2010 Study.” Annals of the Rheumatic Diseases 73 (6):968–74. https://doi.org/10.1136/annrheumdis-2013-204428.
2Luoma, K., H. Riihimäki, R. Luukkonen, R. Raininko, E. Viikari-Juntura, and A. Lamminen. 2000. “Low Back Pain in Relation to Lumbar Disc Degeneration.” Spine 25 (4):487–92.
3Borthakur, Arijitt, Philip M. Maurer, Matthew Fenty, Chenyang Wang, Rachelle Berger, Jonathon Yoder, Richard A. Balderston, and Dawn M. Elliott. 2011. “T1ρ MRI and Discography Pressure as Novel Biomarkers for Disc Degeneration and Low Back Pain.” Spine 36 (25):2190–96. https://doi.org/10.1097/BRS.0b013e31820287bf.
4Blumenkrantz, Gabrielle, Jin Zuo, Xiaojuan Li, John Kornak, Thomas M. Link, and Sharmila Majumdar. 2010. “In Vivo 3.0-Tesla Magnetic Resonance T1rho and T2 Relaxation Mapping in Subjects with Intervertebral Disc Degeneration and Clinical Symptoms.” Magnetic Resonance in Medicine 63 (5):1193–1200. https://doi.org/10.1002/mrm.22362.
5Wáng, Yì-Xiáng J., Qinwei Zhang, Xiaojuan Li, Weitian Chen, Anil Ahuja, and Jing Yuan. 2015. “T1ρ Magnetic Resonance: Basic Physics Principles and Applications in Knee and Intervertebral Disc Imaging.” Quantitative Imaging in Medicine and Surgery 5 (6):858–85. https://doi.org/10.3978/j.issn.2223-4292.2015.12.06.
6Li, Xiaojuan, Cory Wyatt, Julien Rivoire, Eric Han, Weitian Chen, Joseph Schooler, Fei Liang, Keerthi Shet, Richard Souza, and Sharmila Majumdar. 2014. “Simultaneous Acquisition of T1ρ and T2 Quantification in Knee Cartilage: Repeatability and Diurnal Variation.” Journal of Magnetic Resonance Imaging: JMRI 39 (5):1287–93. https://doi.org/10.1002/jmri.24253.
7Carballido-Gamio, Julio, Jan Bauer, Keh-Yang Lee, Stefanie Krause, and Sharmila Majumdar. 2005. “Combined Image Processing Techniques for Characterization of MRI Cartilage of the Knee.” Conference Proceedings: ... Annual International Conference of the IEEE Engineering in Medicine and Biology Society. IEEE Engineering in Medicine and Biology Society. Annual Conference 3:3043–46. https://doi.org/10.1109/IEMBS.2005.1617116.
8Klein, Stefan, Marius Staring, Keelin Murphy, Max A. Viergever, and Josien P. W. Pluim. 2010. “Elastix: A Toolbox for Intensity-Based Medical Image Registration.” IEEE Transactions on Medical Imaging 29 (1):196–205. https://doi.org/10.1109/TMI.2009.2035616.
Figures