0204
UTE-T2* Shows Deep Cartilage Subsurface Matrix Changes 2 Years After ACL Reconstruction1Department of Orthopaedic Surgery, Stanford University, Stanford, CA, United States, 2Veterans Affairs Palo Alto Health Care System, Palo Alto, CA, United States, 3Department of Radiology, Stanford University, Stanford, CA, United States
Synopsis
The purpose of this study is to compare 2-D and 3-D assessments of UTE-T2* maps for evidence of alterations to the subsurface cartilage matrix suggestive of cartilage at risk for early OA 2 years after ACL reconstruction. UTE-T2* values from small 2-D, single slice ROIs correlated to 3-D ROI values that encompassed a larger degree of weight-bearing cartilage. Results indicate that single slice 2-D UTE-T2* mapping may be an efficient means to assess the medial femoral cartilage as an imaging marker of pre-osteoarthritis while 3-D assessments provide additional sensitivity to changes in the tibial plateau.
Introduction
Anterior cruciate ligament (ACL) injury increases risk for development of osteoarthritis (OA)1-3. In a previous study of ACL-reconstructed (ACLR) subjects using ultra-short echo time (UTE-T2*) mapping to examine the structural integrity of the deep cartilage collagen matrix4, initial disruption to deep cartilage, as evidenced by elevated UTE-T2* values, resolved to control levels 2 years after surgery5. This earlier study relied on UTE-T2* values derived from small regions of interest (ROIs) in a single mid-sagittal MRI slice, reflecting the central and flexion weight-bearing regions of the medial femoral condyle. The goal of the current work is to evaluate these provocative findings more thoroughly with 3-D evaluation of UTE-T2* maps encompassing more of the cartilage6, and in a larger cohort of ACLR subjects. The purpose of this study is to 1) examine the relative utility of a larger but more processing-intensive 3-D assessment of UTE-T2* maps compared to the smaller but less processing-intensive 2-D assessment, and 2) examine a 3-D assessment of UTE-T2* maps for evidence of alterations to the subsurface cartilage matrix suggestive of cartilage at risk for early OA 2 years after ACLR.Methods
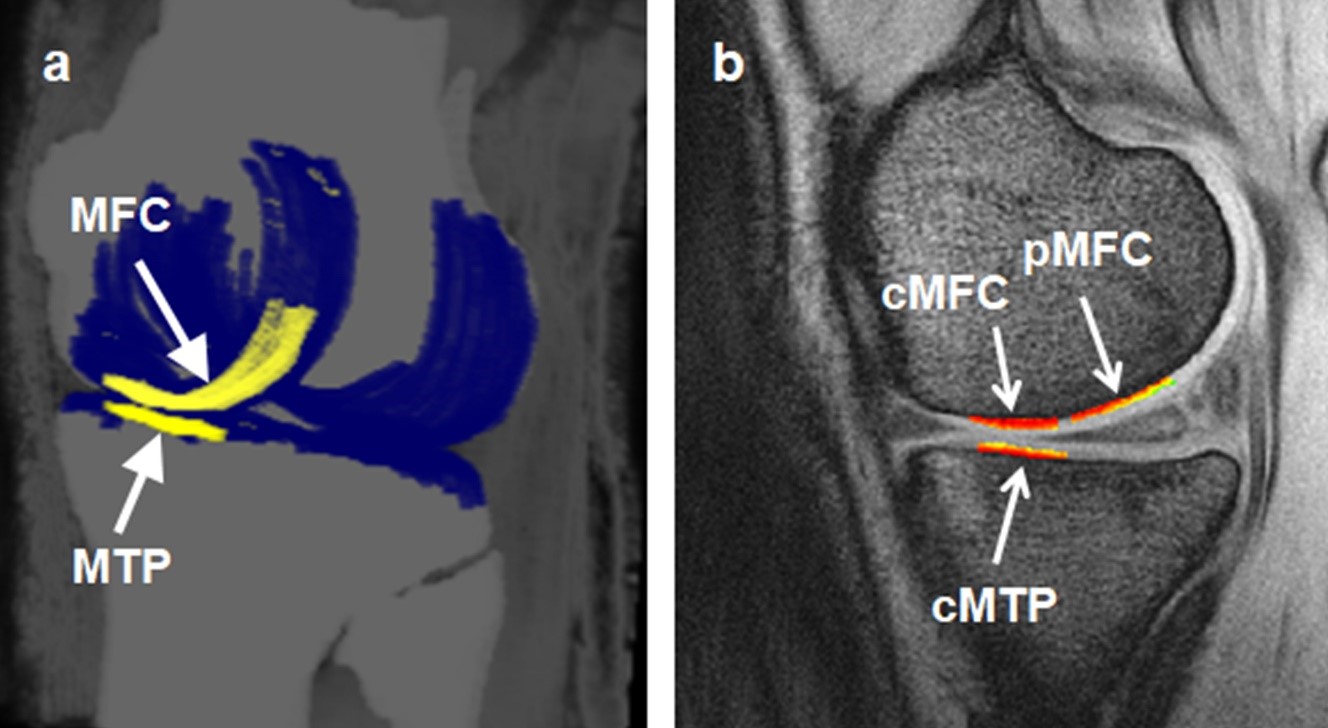
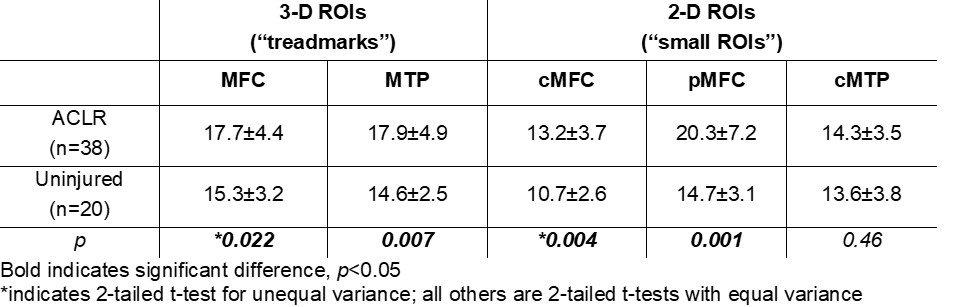
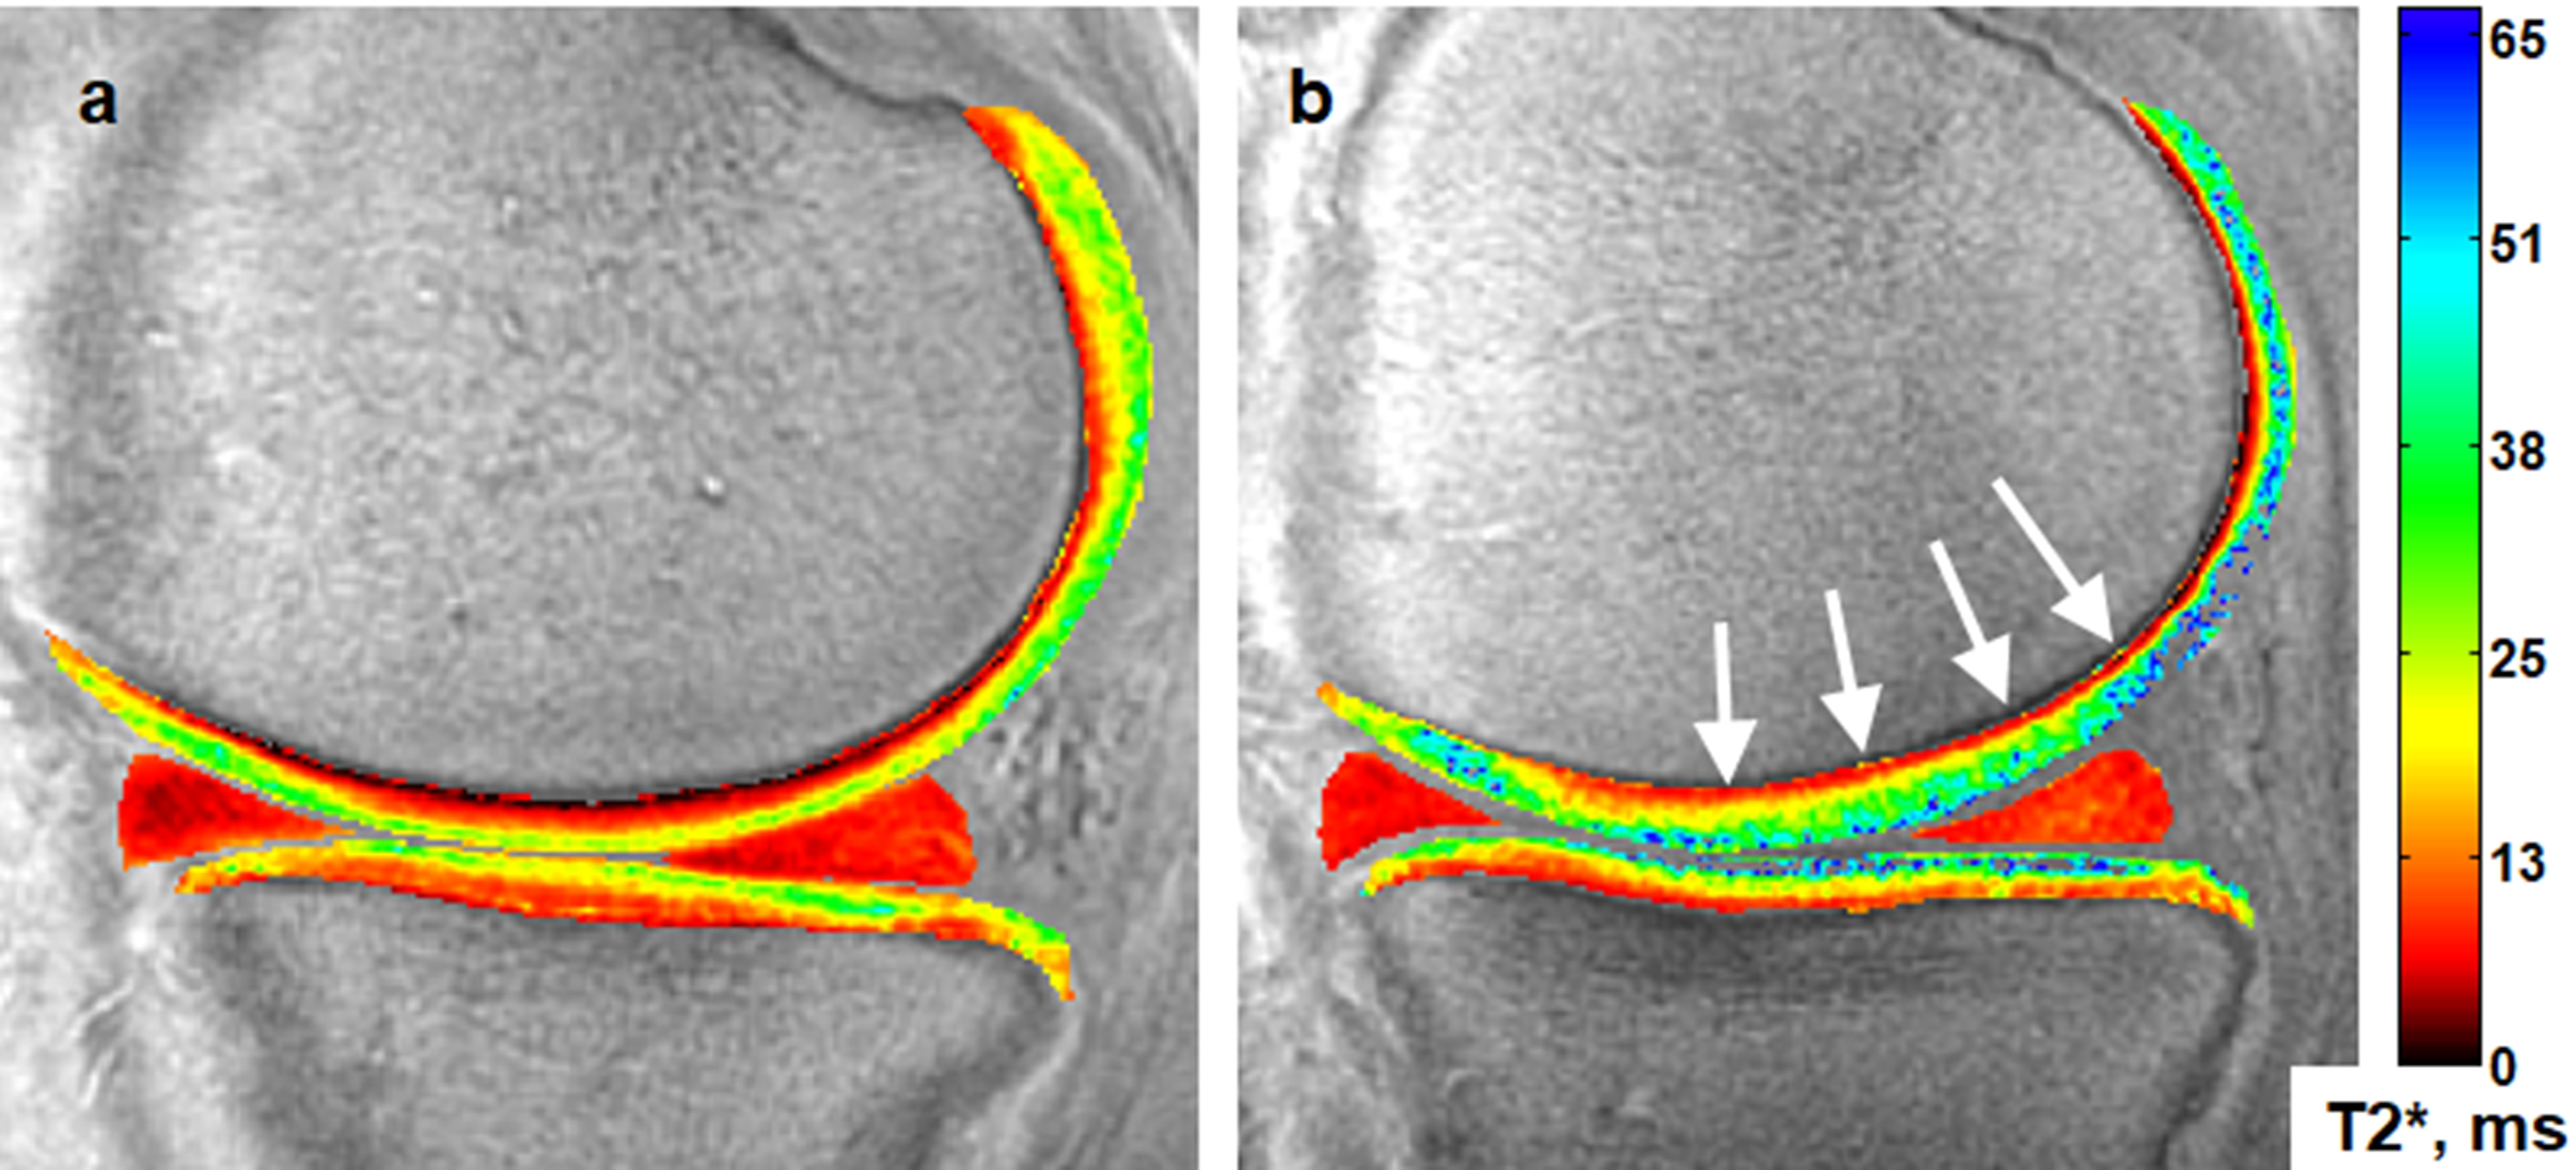
Fifty-eight subjects (38 ACL-reconstructed (2.2±0.2yrs post-ACL-reconstruction), 20 uninjured controls) participated in these IRB-approved studies, undergoing 3T MRI (GE Healthcare) with an 8-channel knee coil. UTE-T2* maps were calculated via mono-exponential fitting of a series of T2*-weighted MR images acquired at eight TEs (32μs -16ms, non-uniform echo spacing) using a radial out 3-D Cones acquisition7. Deep articular cartilage (extending from bone-cartilage interface through half the cartilage thickness)4, 8 , was manually segmented in 2-D and 3-D ROIs. 3-D UTE-T2* values were determined in 2 “treadmark” ROIs to the central weight-bearing medial femoral condyle and tibial plateau (MFC and MTP, Figure 1a) according to a cylindrical coordinate system9 with Olea Sphere software (Olea, FR). The treadmarks were 9mm wide (medial to lateral), centered on the medial femur at approximately 80% the distance between outer edges of the lateral to medial compartments. 2-D UTE-T2* values were calculated in 3 ROIs from a single slice in the center of the medial condyle: central and posterior femoral condyle (cMFC and pMFC), and central tibial plateau (cMTP) with MRIMapper software (MIT 2006, Figure 1b). Morphologic grading of cartilage from fat-saturated proton density sequences acquired in sagittal and coronal views was conducted using a modified Outerbridge classification system10: 0=intact cartilage; 1=chondral blistering with intact surface; 2= fissuring <50% thickness; 3=fissuring >50% thickness; 4=exposed bone. Normality was assessed by Shapiro-Wilk tests. UTE-T2* differences between ACLR and uninjured subjects were calculated with t-tests. Pooled variance p-values are presented unless the variances were unequal, as assessed via F-tests. Pearson correlations assessed associations between 3-D and 2-D segmented UTE-T2* means. Statistical analyses were performed with SigmaPlot (Systat) and Excel (Microsoft).Results
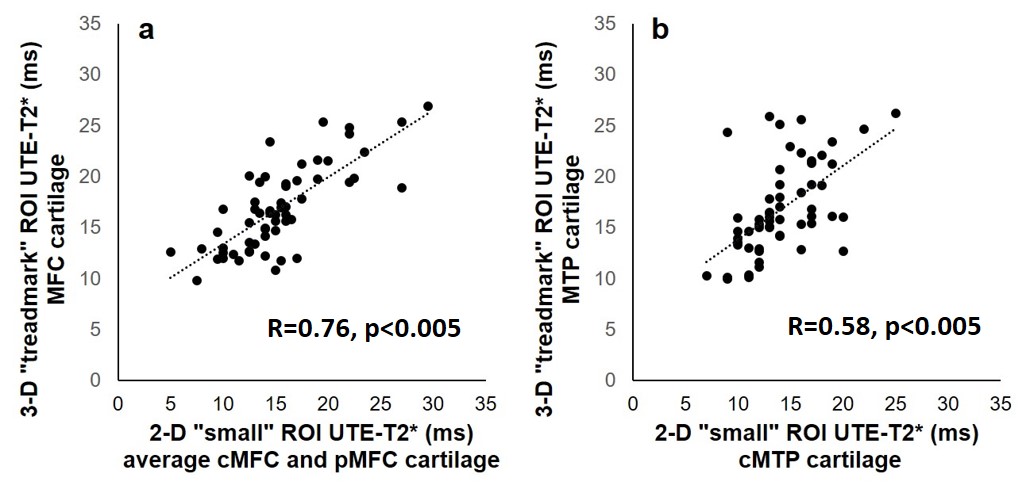
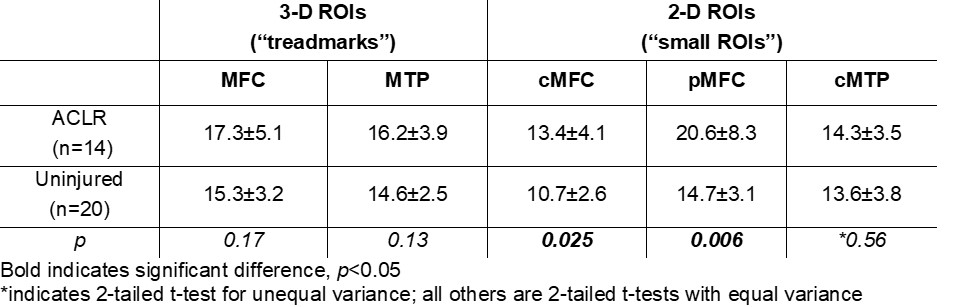
UTE-T2* values derived from 3-D “treadmark” ROIs correlated to those from 2-D “small” ROIs, Figure 2. ACLR subjects’ UTE-T2* values were significantly elevated compared to uninjured controls when assessed by either 3-D or 2-D segmentation, Table 1. Among the subset of ACLR subjects with no morphologic MRI evidence of medial tibiofemoral cartilage pathology (Outerbridge grade 0, n=14), elevated UTE-T2* values in small 2-D femoral ROIs, but not larger 3-D treadmark ROIs, were detected, Table 2, Figure 3. Quantitative comparisons also show that 20/38 (53%) ACLR subjects have 3-D UTE-T2* values within ±1 standard deviation of uninjured controls while 18/38 (47%) ACLR subjects have 3-D values >1 standard deviation higher than the uninjured control mean, and 14/38 (37%) ACLR subjects have values >2 standard deviations higher than uninjured controls.Discussion
UTE-T2* values from small 2-D ROIs strongly correlated to larger 3-D treadmark ROI values in the medial femoral cartilage and moderately correlated in tibial cartilage. 3-D treadmark analyses of UTE-T2* maps detected differences to MTP cartilage between ACLR and uninjured control subjects that were not detected by smaller, single-slice 2-D ROIs. However, among the subset of ACLR subjects with no morphological evidence of medial compartment cartilage pathology, UTE-T2* elevations were detected only by 2-D ROIs. This finding suggests that UTE-T2* assessment of the central and flexion weight-bearing regions of the MFC has utility for identifying focal pathology in subclinical disease. Nearly half of all ACLR subjects demonstrated higher 3-D UTE-T2* values than were seen in controls, and 37% demonstrated 3-D UTE-T2* values more than 2 standard deviations greater than controls.Conclusion
Results of this study indicate that single slice 2-D UTE-T2* mapping may be an efficient means to assess the MFC cartilage as an imaging marker of pre-osteoarthritis while 3-D assessments provide additional sensitivity to changes in the tibial plateau.Acknowledgements
NIH RO1 AR052784 (PI Chu) and GE Healthcare for MRI scan time and sequence support.References
1. Lohmander LS, Ostenberg A, Englund M, Roos H. High prevalence of knee osteoarthritis, pain, and functional limitations in female soccer players twelve years after anterior cruciate ligament injury. Arthritis Rheum. 2004 Oct;50(10):3145-52. Epub 2004/10/12.
2. Oiestad BE, Engebretsen L, Storheim K, Risberg MA. Knee osteoarthritis after anterior cruciate ligament injury: a systematic review. Am J Sports Med. 2009 Jul;37(7):1434-43.
3. von Porat A, Roos EM, Roos H. High prevalence of osteoarthritis 14 years after an anterior cruciate ligament tear in male soccer players: a study of radiographic and patient relevant outcomes. Ann Rheum Dis. 2004 Mar;63(3):269-73. Epub 2004/02/14.
4. Williams A, Qian Y, Bear D, Chu CR. Assessing degeneration of human articular cartilage with ultra-short echo time (UTE) T2* mapping. Osteoarthritis Cartilage. 2010 Apr;18(4):539-46. Epub 2010/02/23.
5. Chu CR, Williams AA, West RV, Qian Y, Fu FH, Do BH, et al. Quantitative Magnetic Resonance Imaging UTE-T2* Mapping of Cartilage and Meniscus Healing After Anatomic Anterior Cruciate Ligament Reconstruction. Am J Sports Med. 2014 Aug;42(8):1847-56.
6. Iranpour-Boroujeni T, Watanabe A, Bashtar R, Yoshioka H, Duryea J. Quantification of cartilage loss in local regions of knee joints using semi-automated segmentation software: analysis of longitudinal data from the Osteoarthritis Initiative (OAI). Osteoarthritis Cartilage. 2011 Mar;19(3):309-14.
7. Gurney PT, Hargreaves BA, Nishimura DG. Design and analysis of a practical 3D cones trajectory. Magn Reson Med. 2006 Mar;55(3):575-82.
8. Williams A, Qian Y, Chu CR. UTE-T2 * mapping of human articular cartilage in vivo: a repeatability assessment. Osteoarthritis Cartilage. 2011 Jan;19(1):84-8. Epub 2010/11/03.
9. Duryea J, Iranpour-Boroujeni T, Collins JE, Vanwynngaarden C, Guermazi A, Katz JN, et al. Local area cartilage segmentation: a semiautomated novel method of measuring cartilage loss in knee osteoarthritis. Arthritis Care Res (Hoboken). 2014 Oct;66(10):1560-5.
10. Potter HG, Linklater JM, Allen AA, Hannafin JA, Haas SB. Magnetic resonance imaging of articular cartilage in the knee. An evaluation with use of fast-spin-echo imaging. J Bone Joint Surg Am. 1998 Sep;80(9):1276-84. Epub 1998/10/06.
Figures