0202
Isotropic 3D T2 mapping of knee cartilage with a novel water excitation technique1Department of Radiology, Lausanne University Hospital (CHUV) and University of Lausanne (UNIL), Lausanne, Switzerland, 2Center for Biomedical Imaging (CIBM), Lausanne, Switzerland
Synopsis
The goal of this study was to develop an isotropic 3D lipid-insensitive T2 mapping technique of knee cartilage. Therefore we combined an existing isotropic 3D T2-prepared gradient-echo T2 mapping technique (Iso3DGRE) with the novel lipid-insensitive binomial off-resonant RF excitation (LIBRE) pulse. LIBRE pulse optimization was performed through numerical simulations and verified in phantom experiments, yielding complete fat signal nulling using a LIBRE pulse as short as 1 ms. T2 mapping of knee cartilage performed in five healthy volunteers with LIBRE excitation allowed for improved cartilage delineation and precise T2 values compared with normal excitation.
Purpose
To develop and characterize an isotropic 3D lipid-insensitive T2 mapping technique of the knee for improved cartilage delineation and precise measurement of T2 relaxation time values.Methods
A novel water excitation method1 that enables effective fat suppression at 3T was combined with a 0.6-mm isotropic GRAPPA-accelerated three-dimensional T2-prepared gradient-echo (Iso3DGRE)2 T2 mapping technique. The lipid insensitive binomial off-resonant radiofrequency (RF) excitation (LIBRE)1 pulse is composed of two rectangular pulses that have an RF frequency offset (fRF), duration (τ) and a LIBRE-defined phase offset (φ=2πfτ). This variable parameter space was exploited to achieve robust fat suppression with a total pulse duration of 1ms (i.e. 2τ). If ∆f is the difference between fRF and the resonance frequency of fat (ffat) at 3T, for small RF excitation angles (α), the relation between ∆f and τ can be described by:
$$∆f=\frac{1}{τ} \quad\quad\quad (Eq.1).$$
The optimal fRF (fRFopt) can then be simply calculated through Eq.1.
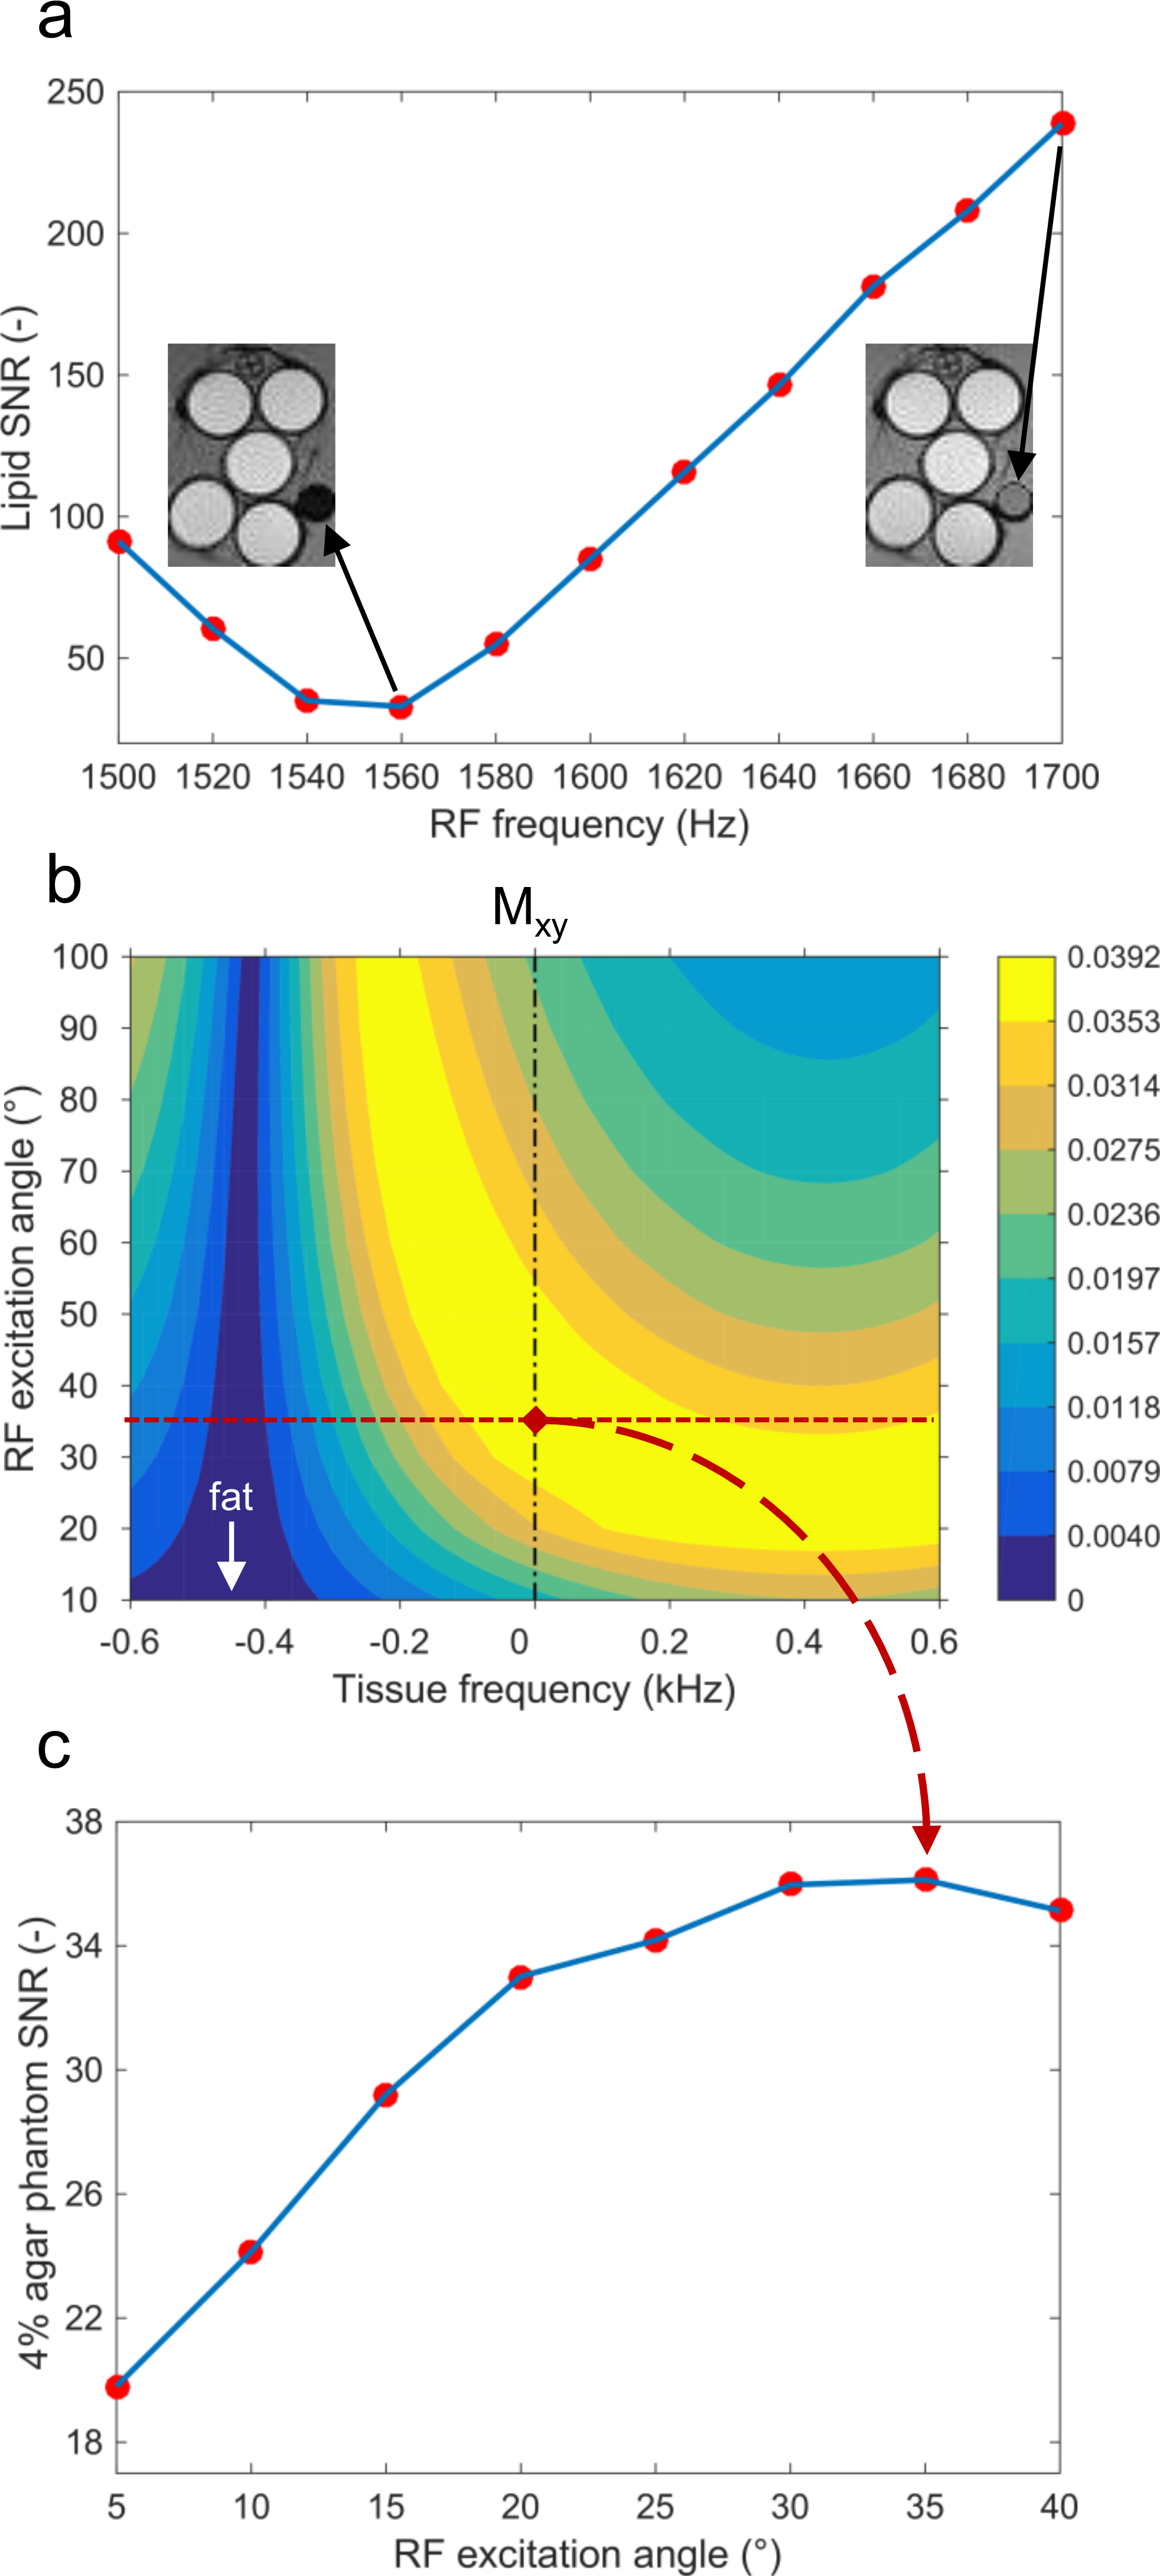
Bloch equation simulations were performed in Matlab (The MathWorks) to determine the optimal α (αopt) that resulted in simultaneous fat suppression and water excitation. Given τ=0.5 ms, the transverse magnetization Mxy was characterized as a function of tissue frequency and α, following a T2 preparation module of 53ms and a LIBRE excitation pulse.
The optimized LIBRE parameters fRFopt and αopt were then verified in phantoms. All experiments were performed on a 3T clinical system (Magnetom Prisma, Siemens) with a 15-channel Tx/Rx knee coil. The phantom consisted of mixed solutions of agar (3-5% w/v) and 0.73µM NiCl2 and a tube of baby oil (Johnson and Johnson). The signal-to-noise ratio (SNR) was approximated as the ratio between the signal in a region of interest (ROI) and the standard deviation of the noise in an ROI drawn outside the phantoms. The parameter fRFopt was confirmed in low-resolution LIBRE-Iso3DGRE scans by varying fRF from 1500 to 1700Hz. The images acquired with a T2 preparation duration of 53ms were used for analysis. To verify αopt, phantoms were scanned with LIBRE-Iso3DGRE with α varying from 5° to 40°. The images acquired with a T2 preparation duration of 53ms were used to determine the SNR as a function of α in the 4% agar phantom. The optimized LIBRE-Iso3DGRE protocol was then used to acquire 4 input images (T2 preparation duration=0-23-38-53ms) to generate a T2 map of the agar phantoms. The accuracy of the LIBRE-Iso3DGRE T2 mapping technique was compared to the gold standard spin echo (SE) (TR/TE=7000/6.8-15-30-60-120-250-400ms) with a linear regression and Bland-Altman analysis.
Next, T2 maps of the knee were acquired with LIBRE-Iso3DGRE and Iso3DGRE in five healthy volunteers (average age 31.0±11.2 years and average weight 72.6±19.1kg). Six continuous slices that covered the central region of the lateral and medial femorotibial compartments were used for cartilage T2 quantification. Eight cartilage sub-compartments were defined on the sagittal plane.
The precision was defined as inverse of the relative standard deviation (the ratio of the standard deviation and the average T2 value within the ROIs) and was compared between the two techniques with a two-tailed Student’s t-test.
Results and Discussion
The theoretically optimal RF frequency offset (Eq.1) fRFopt was 1560Hz and was confirmed in phantom experiments (Fig. 1a). The numerically optimal excitation angle αopt was 35° (Fig. 1b), which was similarly confirmed in phantom experiments (Fig. 1c). These values yielded complete and robust nulling of the fat signal using an excitation pulse of 1ms.
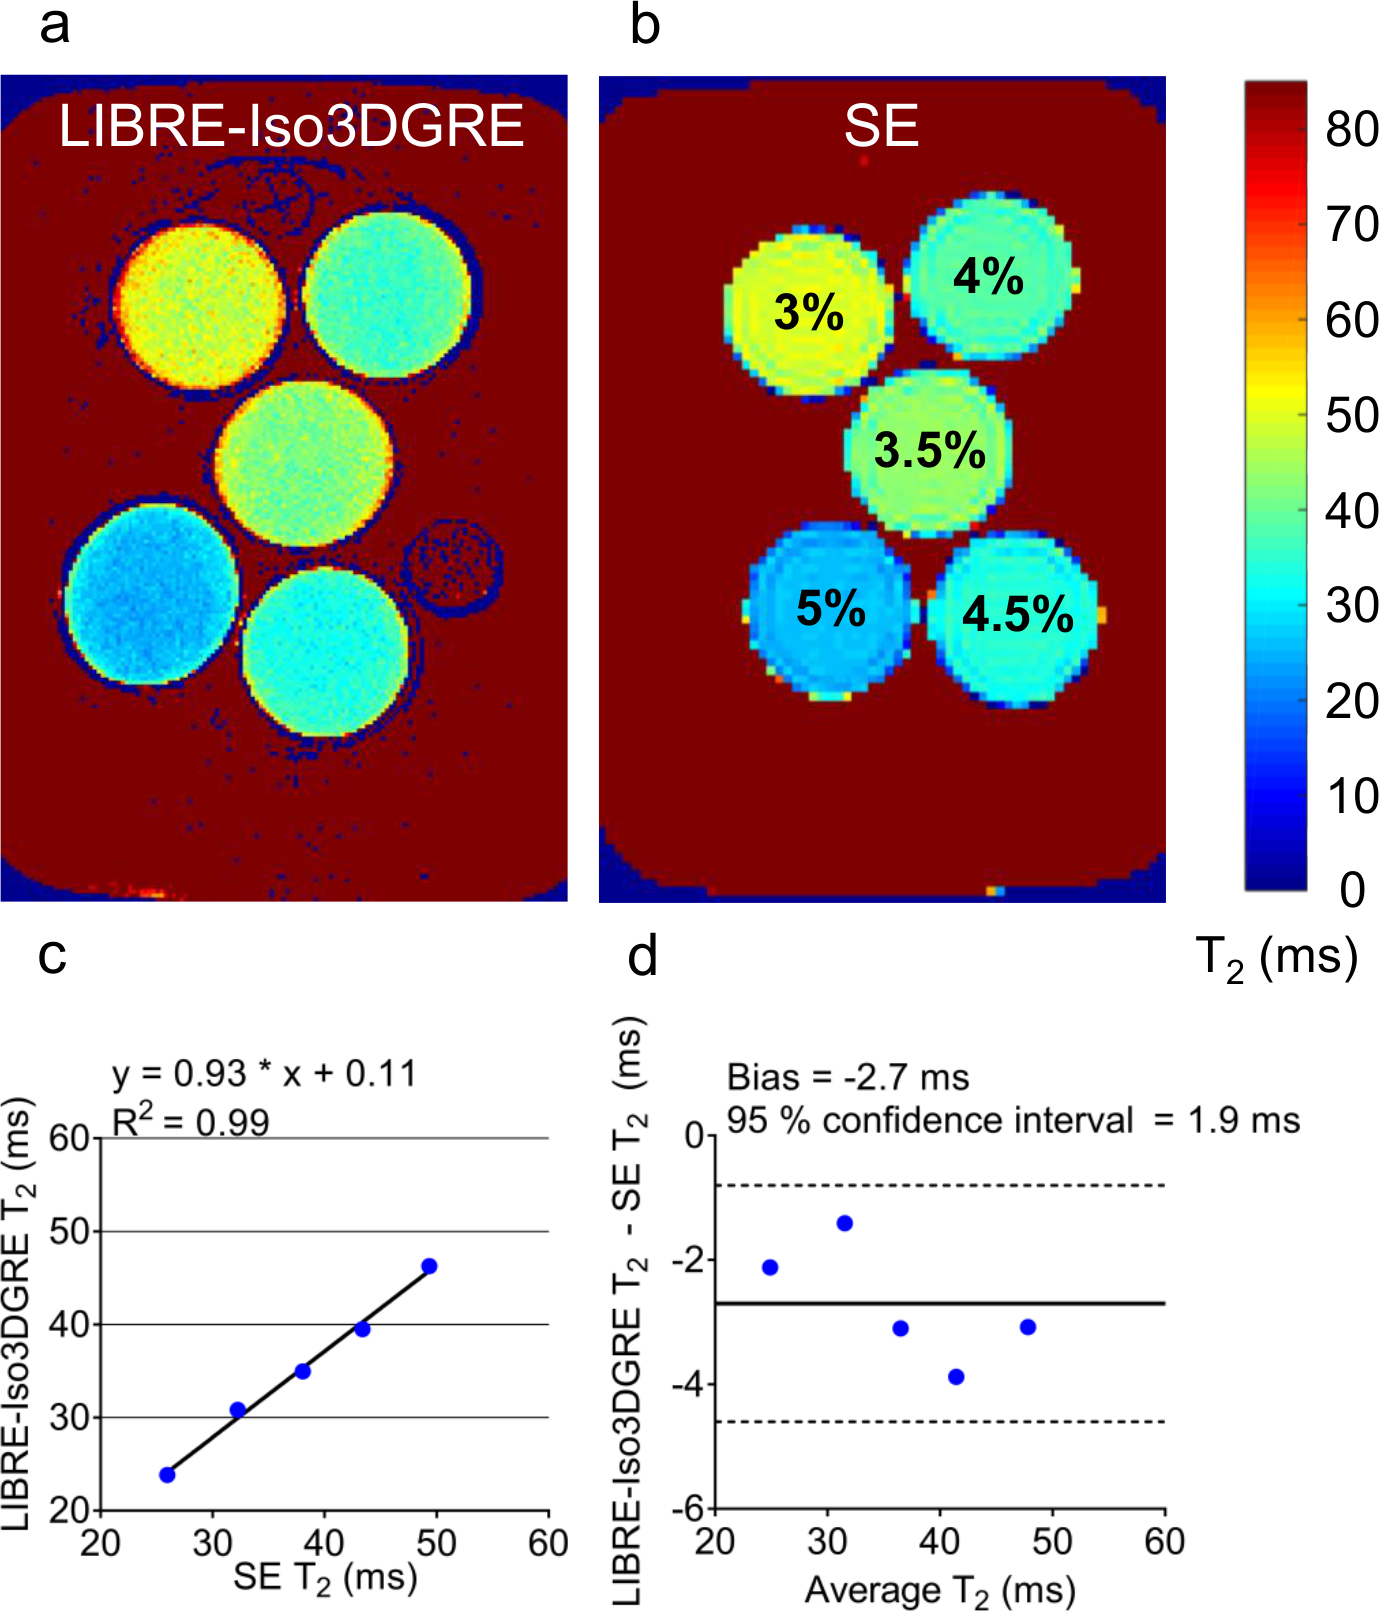
In the phantoms, LIBRE-Iso3DGRE T2 values agreed with the gold standard SE values (y=0.93*x+0.11, R2=0.99, P=0.0002). The almost direct proportionality indicates that the slight underestimation can potentially be corrected by using a scaling factor. The Bland-Altman analysis reported a bias of -2.7ms with a 95% confidence interval of ±1.9ms (Fig. 2).
Averaged over all volunteers and compartments, the LIBRE-Iso3DGRE T2 values (37.8±4.4ms) were significantly higher than those determined with Iso3DGRE (34.1±5.5ms, P<0.0001), most likely due to the slightly different relaxation mechanisms of the two techniques.
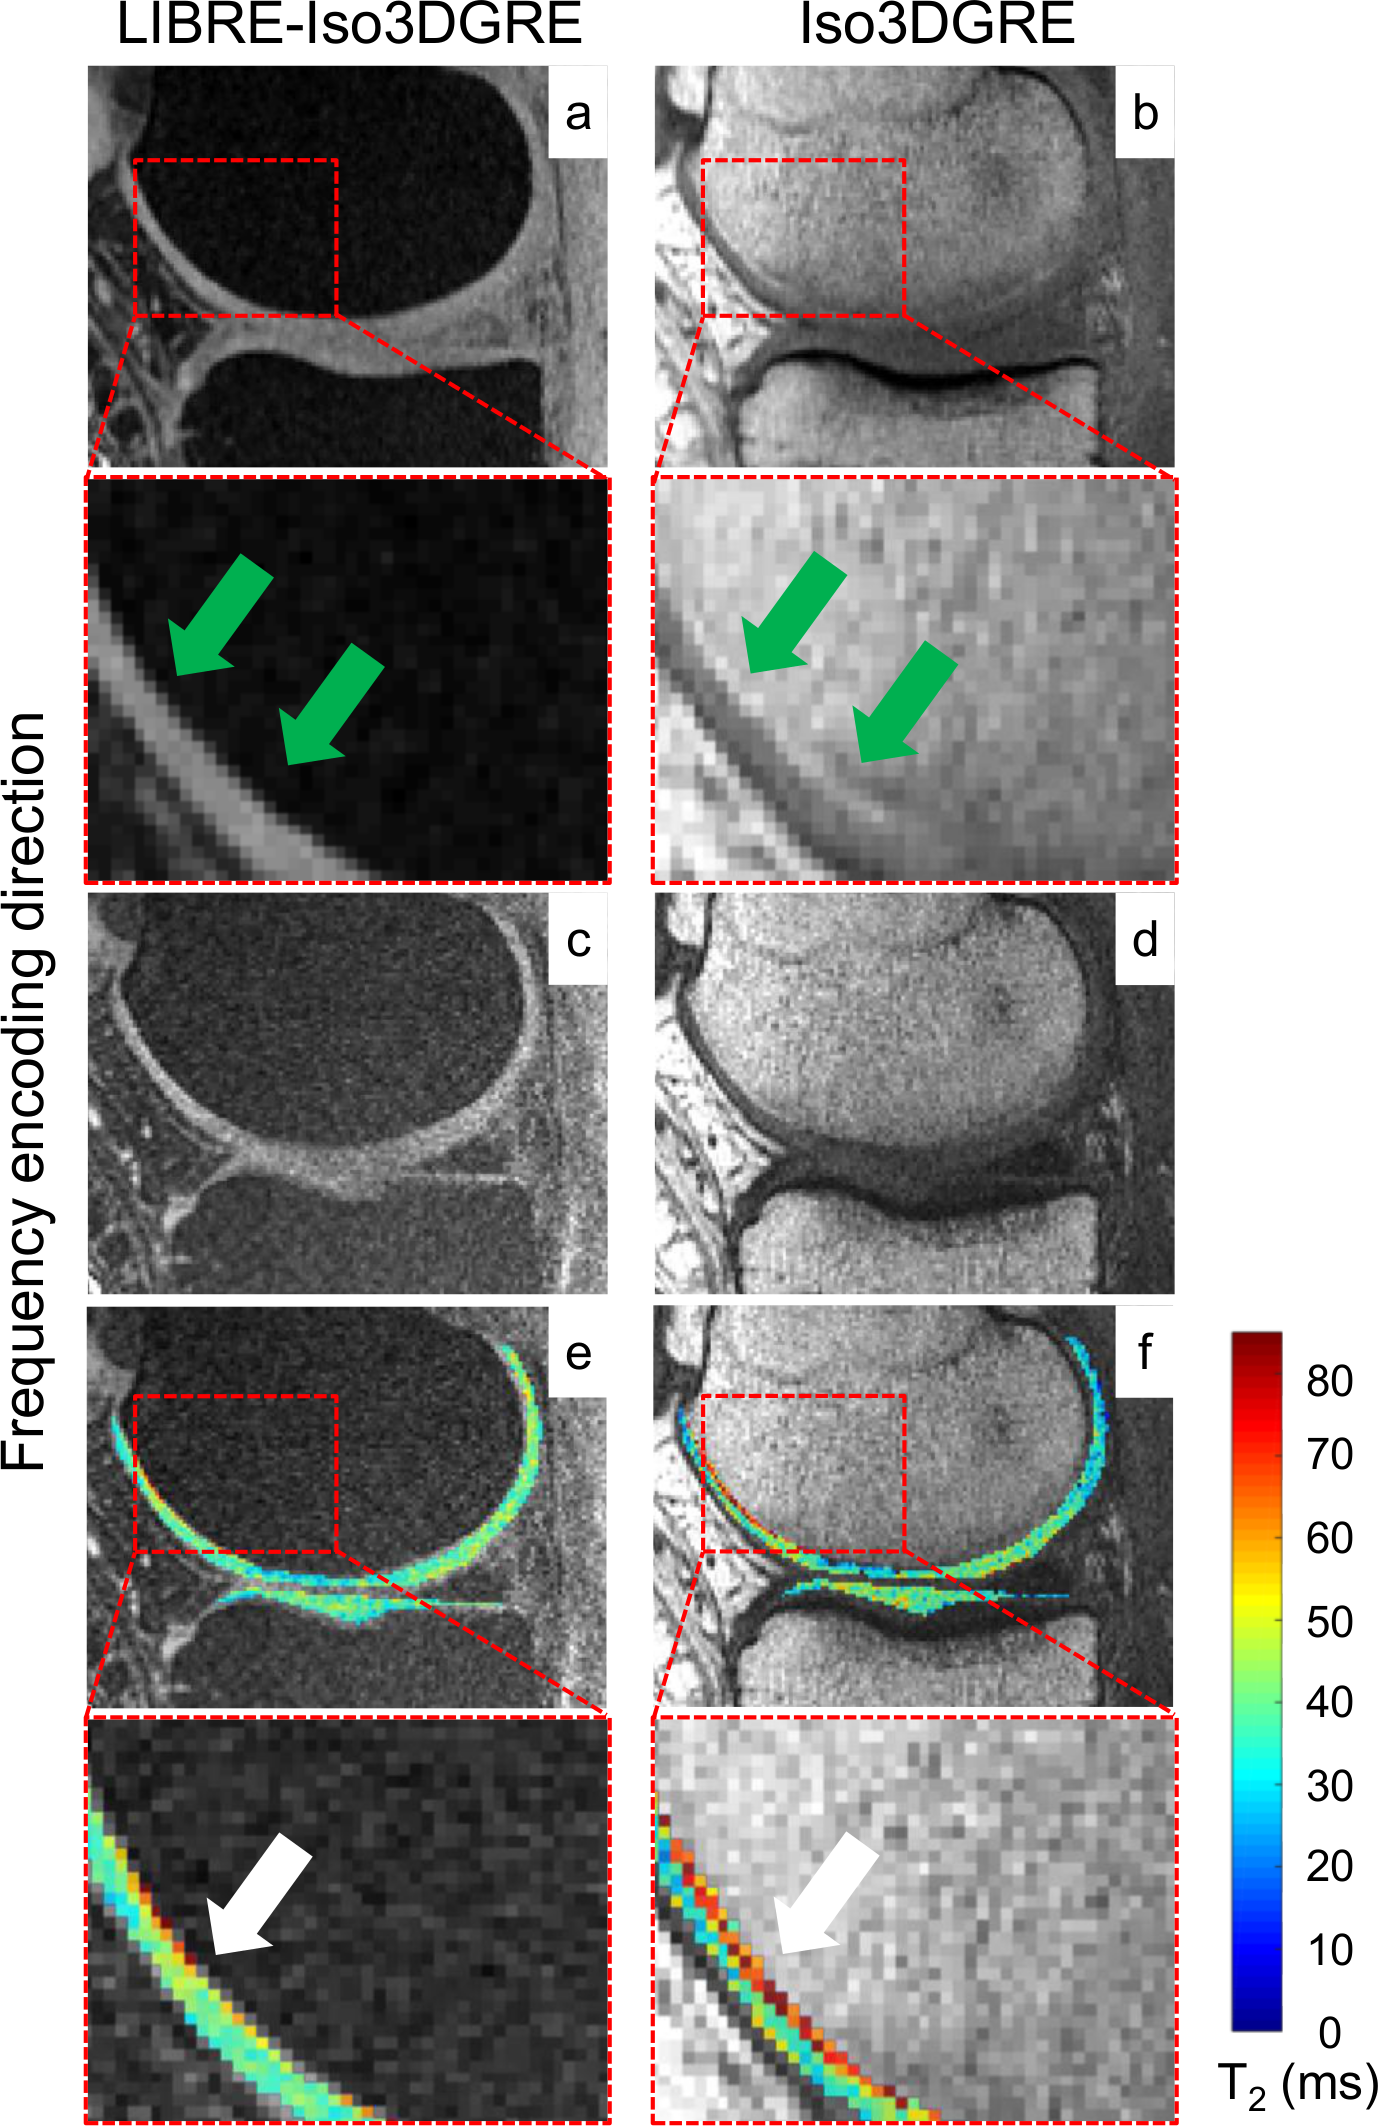
In the healthy volunteers, LIBRE excitation completely avoided chemical shift displacement (CSD) artifacts (Fig.3, 4), which resulted in more conspicuous cartilage visualization as well as in a more precise T2 estimation, as confirmed by a decrease in the relative T2 standard deviation from 27.1±8.2% for Iso3DGRE to 21.2±6.0% for LIBRE-Iso3DGRE (P<0.0001).
Conclusions
This study demonstrated that the LIBRE RF excitation pulse can be successfully combined with a 0.6-mm isotropic 3D GRE T2 mapping technique for quantitative knee cartilage evaluation. Homogeneous and robust LIBRE fat signal suppression allowed for the removal of CSD artifacts and resulted in improved cartilage delineation and more precise T2 values.Acknowledgements
The authors would like to thank Prof. Matthias Stuber for helpful discussions. This work was supported by grants from the the Swiss National Science Foundation (PZ00P3_154719 to RBvH, PZ00P3_167871 to JAMB), as well as by the Centre d’Imagerie BioMédicale (CIBM) of the UNIL, UNIGE, HUG, CHUV, EPFL, and the Leenaards and Jeantet Foundations.References
[1] JAM Bastiaansen et al. Flexible water excitation for fat-free MRI at 3 Tesla using lipid insensitive binomial off-resonant RF excitation (LIBRE) pulses. Magnetic Resonance in Medicine 2017, In Press
[2] R Colotti et al. Isotropic Three-Dimensional T2 Mapping of Knee Cartilage: Development and Validation. Journal of Magnetic Resonance Imaging 2017, In Press.
Figures