0200
Can A Machine Diagnose Knee MR Images? Fully-automated Cartilage Lesion Detection by using Deep Learning1Department of Radiology, University of Wisconsin-Madison, Madison, WI, United States, 2Department of Biomedical Engineering, University of Minnesota, Minneapolis, MN, United States
Synopsis
This study evaluated a fully-automated cartilage lesion detection system utilizing a deep convolutional neural network (CNN) to segment bone and cartilage followed by a second CNN classification network to detect structural abnormalities within the segmented tissues. The CNN network was trained to detect cartilage lesions within the knee joint using sagittal fat-suppressed T2-weighted fast spin-echo images in 125 subjects. The proposed CNN model achieved high diagnostic accuracy for detecting cartilage lesions with a 0.914 area under curve on receiver operation characteristics analysis. The optimal threshold for sensitivity and specificity of the CNN model was 84.3% and 84.6% respectively.
Introduction
Methods
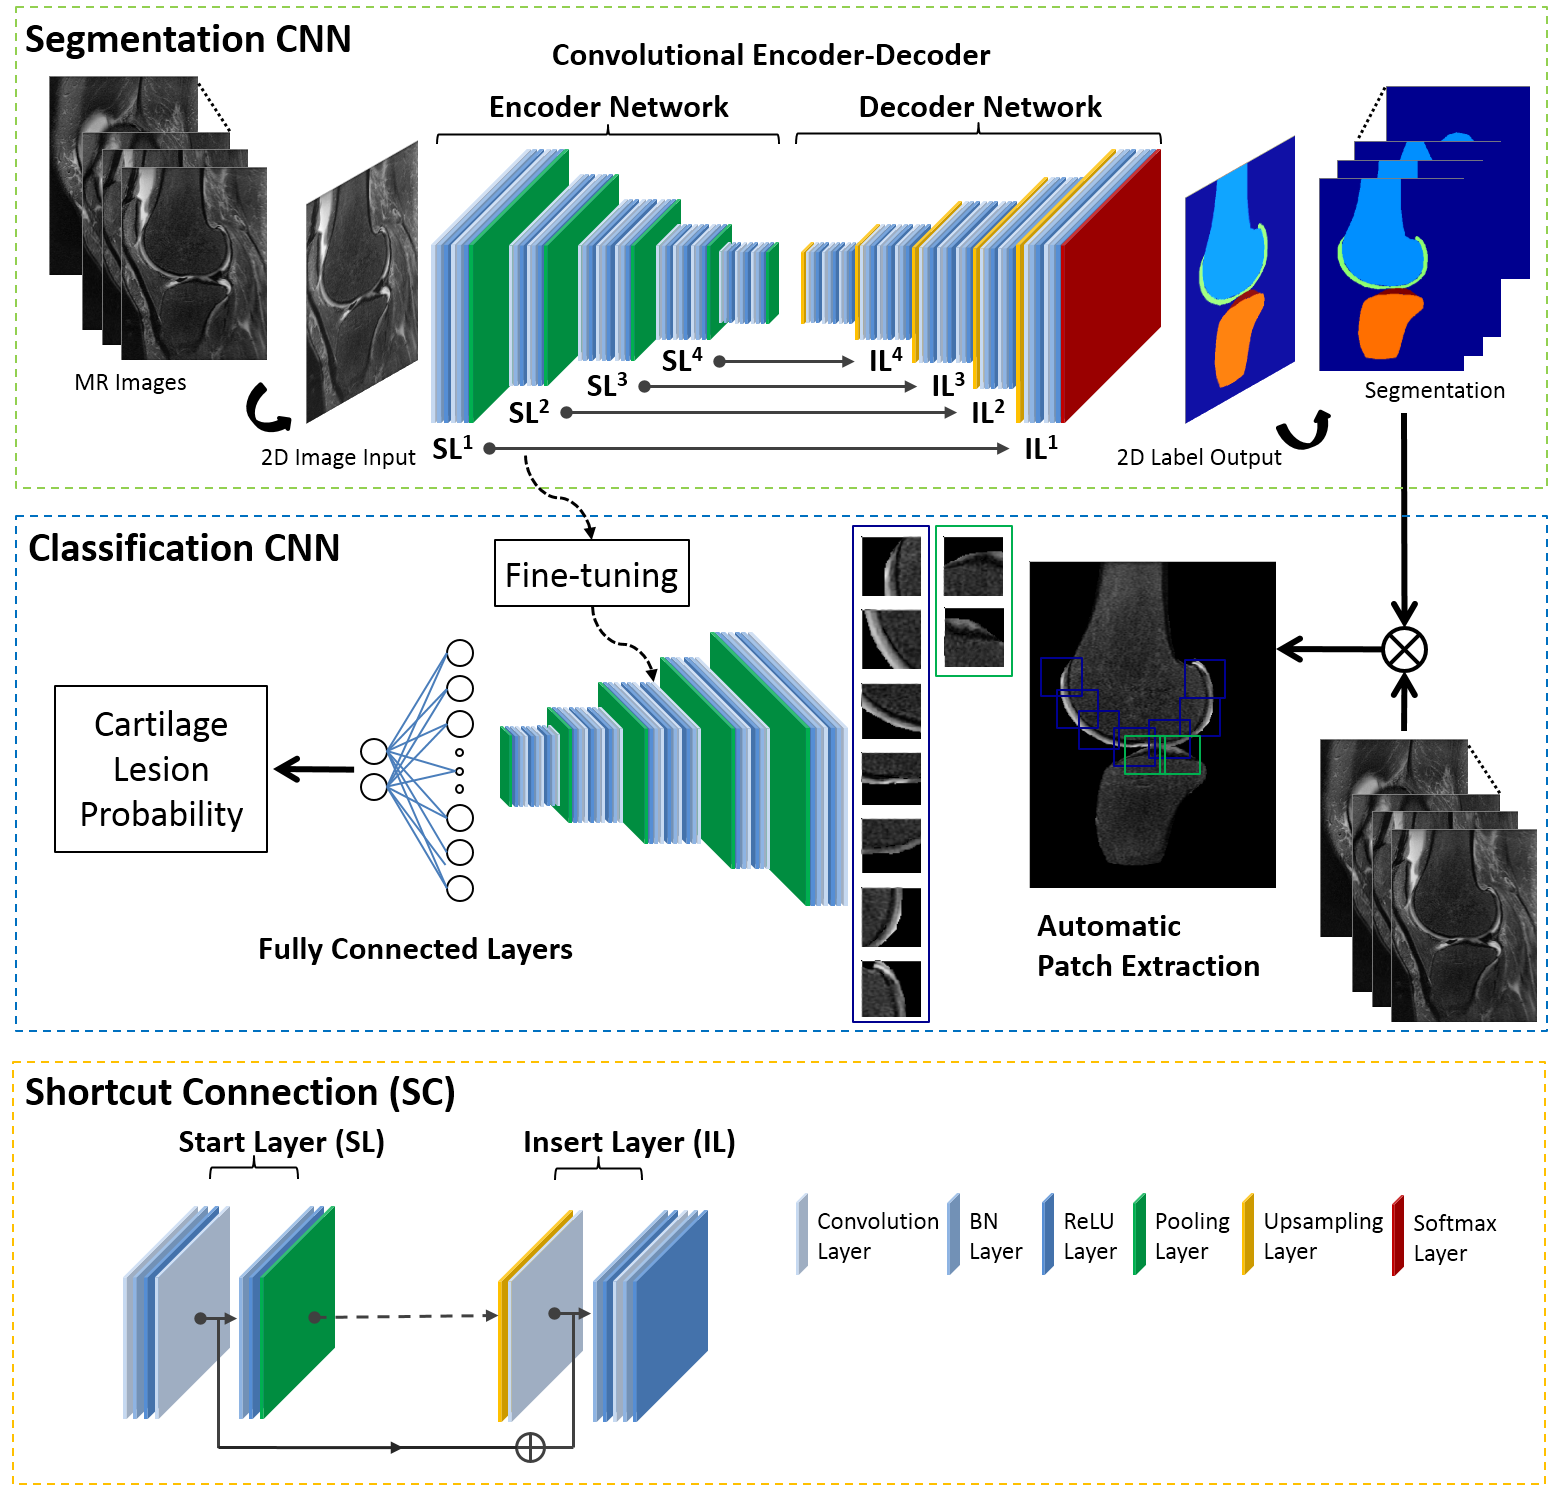
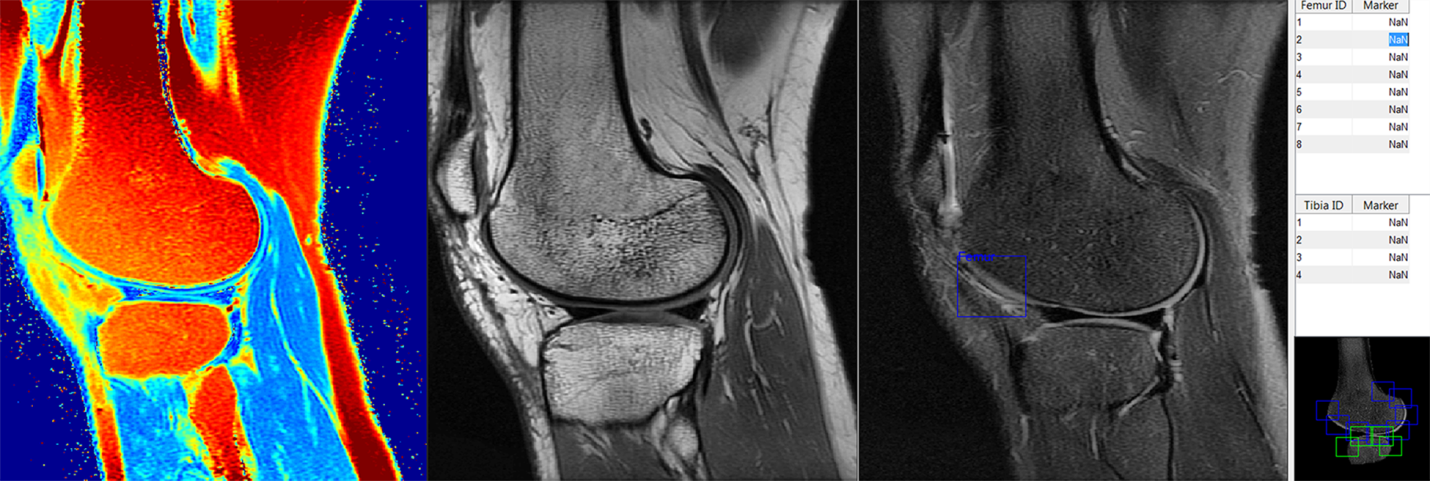
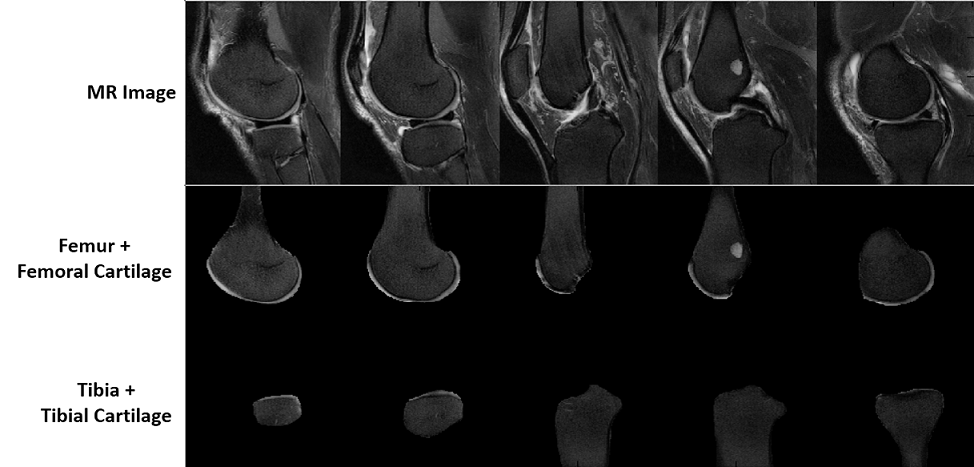
The proposed approach consisted of two deep CNNs. The first CNN performed rapid fully-automated segmentation of bone and cartilage. A second classification network followed the first network and evaluated structural abnormalities within the segmented tissues. These two networks were connected in a cascaded fashion to create a fully-automated processing pipeline (Figure 1). Step 1: The segmentation network was constructed using a convolutional encoder-decoder network similar to (4,5) but with additional shortcut connections (SC) to enhance segmentation performance. Step 2: A set of identical size 2D image patches were automatically extracted along the segmented tibiofemoral cartilage surface. Step 3: The VGG16 classification network (6) was used to predict the probability of the presence of a cartilage lesion on each image patch. To test the CNN model, MR image datasets consisting of sagittal fat-saturated T2-weighted fast spin-echo (T2-FSE), intermediate-weighted fast spin-echo (IW-FSE), and T2 mapping sequences were acquired on 125 subjects from our institution with Internal Review Board approval. An experienced fellowship-trained musculoskeletal radiologist and two musculoskeletal radiology fellows independently reviewed all sequences side-by-side to determine the presence or absence of a cartilage lesion in each image patch on each image slice (Figure 2). The interpretation of the experienced musculoskeletal radiologist was used as the reference standard. The segmentation CNN was trained to segment bone and cartilage on 20 subjects using the sagittal T2-FSE images and then used on the remaining subjects (Figure 3). A total of 13,148 cartilage patches were extracted from the T2-FSE images which included 12,124 normal patches and 1024 patches with cartilage lesions. The classification CNN was further trained on all cartilage patches using stratified three-fold cross-validation. The diagnostic performance of the CNN model was assessed using receiver operation characteristics (ROC) and area under curve (AUC) analysis with the optimal threshold sensitivity and specificity calculated using the Youden index. The sensitivity and specificity of the musculoskeletal radiology fellows for detecting cartilage lesions within the image patches were also calculated with inter-reader agreement tested using kappa statistics.Results
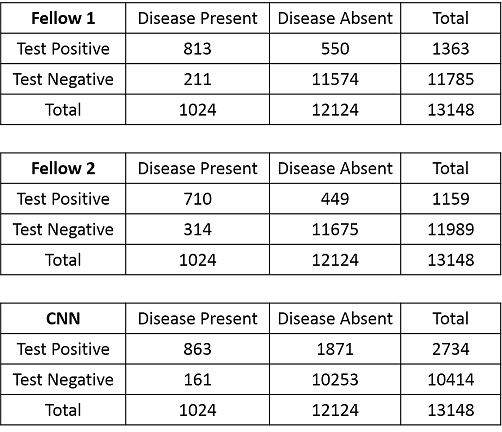
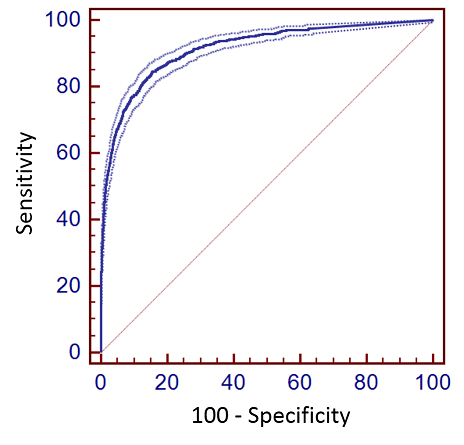
Contingency tables for the musculoskeletal radiology fellows and CNN model for detecting cartilage lesions within the knee joint are shown in Figure 4. For fellows 1 and 2, the sensitivity (95%CI) was 79.4% (76.8% to 81.8%) and 69.3% (66.4% to 72.2%) respectively, while the specificity (95%CI) was 95.5% (95.1% to 95.6%) and 96.3% (96.0% to 96.6%) respectively. There was moderate inter-reader agreement between fellows with a kappa value (95%CI) of 0.605 (0.581 to 0.628). In comparison, the optimal threshold for sensitivity (95%CI) and specificity (95%CI) for the CNN model was 84.3% (81.9% to 86.5%) and 84.6% (84.0% to 85.2%) respectively. The AUC (95%CI) of the CNN model was 0.914 (0.909 to 0.919, p<0.001) indicating high overall diagnostic accuracy (Figure 5).Discussion and Conclusion
This study described a fully-automated cartilage lesion detection model utilizing a CNN network to segment bone and cartilage followed by a second CNN classification network to detect structural abnormalities within the segmented tissues. The proposed CNN model achieved high overall diagnostic accuracy for detecting cartilage lesions within the knee joint with an AUC of 0.914. Compared with musculoskeletal radiology fellows, the CNN model provided higher sensitivity but lower specificity for detecting cartilage lesions. The lower specificity is likely the result of the CNN model using only the sagittal T2-FSE images for cartilage lesion detection, while the musculoskeletal radiology fellows used three image datasets with different tissue contrasts. Future use of multiple MR sequences with identically matched spatial resolution, slice thickness, and field of view could improve diagnostic performance by allowing the CNN model to simultaneously analyze multiple image datasets with different tissue contrasts. The use of larger training datasets and consensus reads from multiple experienced musculoskeletal radiologists as the cartilage reference standard could further improve diagnostic performance of the CNN model. Nevertheless, this study demonstrated the feasibility of using of a deep CNN approach to create a fully-automated prediction model for detecting cartilage lesions within the knee joint with comparable diagnostic performance as human readers.Acknowledgements
We acknowledge support from NIH R01-AR068373-01, GE Healthcare, and University of Wisconsin Department of Radiology Research and Development Committee.References
1. Menashe L, Hirko K, Losina E, et al. The diagnostic performance of MRI in osteoarthritis: a systematic review and meta-analysis. Osteoarthr Cartil. 2012;20(1):13–21http://www.ncbi.nlm.nih.gov/pubmed/22044841. Accessed November 3, 2017.
2. Zhang M, Min Z, Rana N, Liu H. Accuracy of Magnetic Resonance Imaging in Grading Knee Chondral Defects. Arthrosc J Arthrosc Relat Surg. 2013;29(2):349–356http://www.ncbi.nlm.nih.gov/pubmed/22906758. Accessed November 3, 2017.
3. LeCun Y, Bengio Y, Hinton G. Deep learning. Nature. 2015;521(7553):436–444https://www.ncbi.nlm.nih.gov/pubmed/26017442. Accessed August 18, 2017.
4. Liu F, Jang H, Kijowski R, Bradshaw T, McMillan AB. Deep Learning MR Imaging–based Attenuation Correction for PET/MR Imaging. Radiology. 2017;(September):170700http://pubs.rsna.org/doi/10.1148/radiol.2017170700. Accessed September 26, 2017.
5. Liu F, Zhou Z, Jang H, Samsonov A, Zhao G, Kijowski R. Deep Convolutional Neural Network and 3D Deformable Approach for Tissue Segmentation in Musculoskeletal Magnetic Resonance Imaging. Magn Reson Med. 2017;DOI: 10.1002/mrm.26841http://www.ncbi.nlm.nih.gov/pubmed/28733975. Accessed July 29, 2017.
6. Simonyan K, Zisserman A. Very Deep Convolutional Networks for Large-Scale Image Recognition. ArXiv e-prints. 2014;http://adsabs.harvard.edu/abs/2014arXiv1409.1556S.
Figures