0199
T2 Texture Analysis Reveals Potential Cartilage-preserving Effect in Presence of Heterozygous WNT1 Mutation in Human1Research Unit of Medical Imaging, Physics and Technology, University of Oulu, Oulu, Finland, 2Medical Research Center, University of Oulu and Oulu University Hospital, Oulu, Finland, 3Folkhälsan Institute of Genetics and University of Helsinki, Helsinki, Finland, 4Department of Orthopedics, Oulu University Hospital, Oulu, Finland, 5Children’s Hospital, University of Helsinki and Helsinki University Hospital, Helsinki, Finland, 6Center for Molecular Medicine, Karolinska Institutet, and Clinical Genetics, Karolinska University Hospital, Stockholm, Sweden
Synopsis
Quantitative MRI (qMRI) assessment of tibiofemoral articular cartilage was performed in 13 WNT1 mutation-positive (MP) subjects and 13 mutation-negative (MN) controls. Cartilage thickness, T2 and T1r relaxation times, and texture features contrast, homogeneity and dissimilarity of T2 maps were determined in six regions of interests. Texture features demonstrated an opposing trend with age between the two groups in medial tibiofemoral cartilage, suggesting a possible age-related cartilage preservation in MP subjects. Similar differences were not observed in the other qMRI parameters, suggesting that texture analysis is a more sensitive and accurate tool for quantitative cartilage assessment than mere mean relaxation time measurements.
Introduction
WNT signaling is of key importance in chondrogenesis and atypically high WNT signaling may contribute to the pathogenesis of osteoarthritis (OA). Previous studies have demonstrated defective WNT signaling to be strongly associated with osteoporosis1, however, biochemical composition of articular cartilage in patients with reduced WNT signaling has not been studied. The aim of this study was to quantitatively assess articular cartilage of tibiofemoral joint in WNT1 mutation-positive subjects using T2 and T1r relaxation times and gray level co-occurrence matrix –based texture analysis of T2 maps.Methods
The cohort comprised 13 mutation-positive
(MP, age range 17-76 years) and 13 mutation-negative (MN, age range 16-77 years)
subjects from two Finnish families with autosomal dominant WNT1 osteoporosis
due to a heterozygous missense mutation c.652T>G (p.C218G) in WNT1. All the subjects were imaged using
a 3.0T MRI unit (Siemens Skyra, Siemens, Erlangen, Germany); the protocol
included morphological sequences, and T2 and T1r
mapping. The imaging parameters are presented in Table 1. The articular
cartilage was manually segmented into six regions of interest (ROIs): lateral
and medial anterior central femur (acFL and acFM), lateral and medial posterior
central femur (pcFL and pcFM) and lateral and medial central tibia (cTL and
cTM) (Figure 1). Cartilage thickness, T2 and T1r
relaxation times, and T2 texture features contrast,
dissimilarity and homogeneity were assessed in each ROI. Morphological
assessment of the tibiofemoral joint was conducted using Park scoring system2
for MR images. Differences in
relaxation times and texture features between MP and MN groups were assessed using
Mann-Whitney non-parametric test. The effect of the mutation status on
age-relaxation time correlation and age-texture feature correlation was
analyzed using linear regression analysis. The correlation was presented as
scatter plots and the regression lines of MP and MN groups were compared using
Z-score.
Results
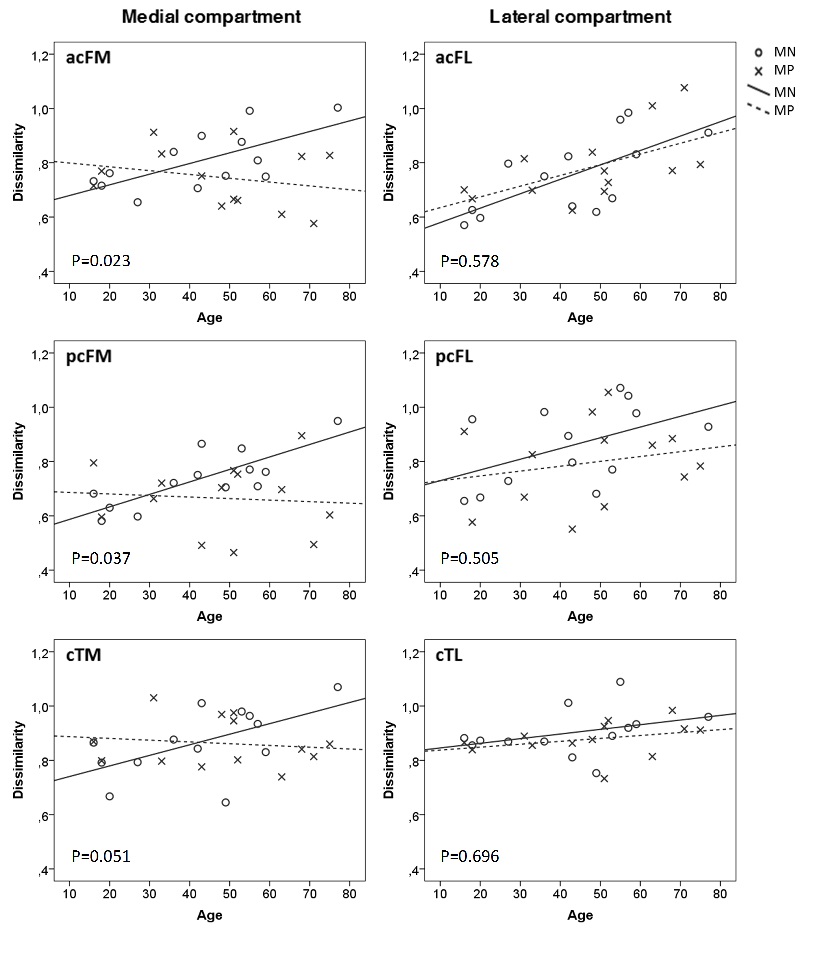
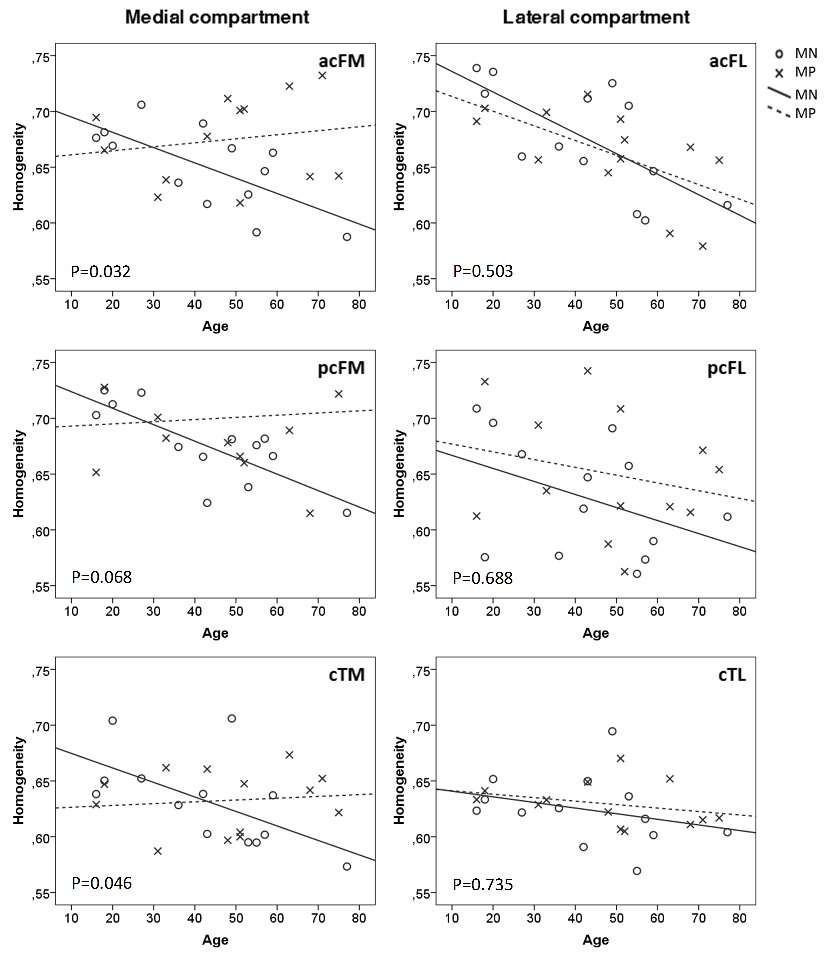
No differences in Park scores were observed between the groups. All three texture features showed opposing trends with age between the groups in the medial tibiofemoral (MTF) cartilage (p-values for the difference of the regression coefficients were 0.016-0.068) (Figures 2, 3 & 4), the MP individuals showing signs of cartilage preservation. No significant differences were observed in the lateral tibiofemoral cartilage (Figures 2, 3 and 4). T1r relaxation time was significantly different in one ROI but the regression analysis displayed no differences. Cartilage thickness and T2 relaxation time did not differ between groups and no differences were observed in the association of age with the qMRI parameters.Discussion
Texture feature results suggest that MP subjects may be less prone to age-related cartilage deterioration in MTF compartment. The trends of texture features over age for MN subjects is compatible with the observation reported for osteoarthritic patients3-5, and most likely attributable to cartilage degradation associated with aging, in line with previous findings in a longitudinal study6. MP subjects show significantly opposing behavior in the MTF cartilage, the site where the degradation is usually more prevalent7,8. We speculate that the partial suppression of the WNT signaling in the MP subjects could lead to increased differentiation of chondrocytes and enable the cartilage to better maintain its integrity against mechanical stress. Another explanation could be the quality of the underlying bone: MP individuals are known to have a reduced bone turnover leading to reduced bone mineral density (BMD)1. This could lead to a reduced cartilage stress in MP subjects, therefore enabling the cartilage to maintain its integrity even at older age. However, in the latter case the differences would be anticipated also in the lateral compartment of the knee joint. Previous studies have demonstrated an inverse relation between osteoporosis and OA9,10. This observation resonates with our findings where improved cartilage quality, as compared with controls, was found in individuals with defective WNT signaling due to the WNT1 mutation, which is linked with high prevalence of osteopenia and osteoporosis1. None of the other qMRI parameters displayed similar differences as the texture analysis. Therefore, we believe that these results also suggest texture analysis to be more sensitive and accurate tool for quantitative evaluation of articular cartilage than mere mean relaxation time values.Conclusions
Texture analysis reveals less age-related cartilage deterioration in the WNT1 mutation-positive than the mutation-negative subjects. This suggests, that WNT1 mutations and subsequent reduced WNT signaling may alter cartilage turnover and even have a potential cartilage-preserving effect.Acknowledgements
This study was supported by the Sigrid Jusélius Foundation, the Folkhälsan Research Foundation, the Academy of Finland (project number #297033), the Foundation for Pediatric Research, the Helsinki University Research Funds, the Swedish Research Council, and the Novo Nordisk Foundation.References
1. Laine CM, Joeng KS, Campeau PM, Kiviranta R, Tarkkonen K, Grover M, et al. WNT1 mutations in early-onset osteoporosis and osteogenesis imperfecta. N Engl J Med. 2013 May 9;368(19):1809-16.
2. Park HJ, Kim SS, Lee SY, Park NH, Park JY, Choi YJ, et al. A practical MRI grading system for osteoarthritis of the knee: association with Kellgren-Lawrence radiographic scores. Eur J Radiol. 2013 Jan;82(1):112-7.
3. Carballido-Gamio J, Stahl R, Blumenkrantz G, Romero A, Majumdar S, Link TM. Spatial analysis of magnetic resonance T1rho and T2 relaxation times improves classification between subjects with and without osteoarthritis. Med Phys. 2009 Sep;36(9):4059-67.
4. Joseph GB, Baum T, Carballido-Gamio J, Nardo L, Virayavanich W, Alizai H, et al. Texture analysis of cartilage T2 maps: individuals with risk factors for OA have higher and more heterogeneous knee cartilage MR T2 compared to normal controls--data from the osteoarthritis initiative. Arthritis Res Ther. 2011;13(5):R153.
5. Peuna A, Hekkala J, Haapea M, Podlipska J, Guermazi A, Saarakkala S, et al. Variable angle gray level co-occurrence matrix analysis of T2 relaxation time maps reveals degenerative changes of cartilage in knee osteoarthritis: Oulu knee osteoarthritis study. J Magn Reson Imaging. 2017 Nov 1.
6. Baum T, Joseph GB, Nardo L, Virayavanich W, Arulanandan A, Alizai H, et al. Correlation of magnetic resonance imaging-based knee cartilage T2 measurements and focal knee lesions with body mass index: thirty-six-month followup data from a longitudinal, observational multicenter study. Arthritis Care Res (Hoboken). 2013 Jan;65(1):23-33.
7. McAlindon TE, Snow S, Cooper C, Dieppe PA. Radiographic patterns of osteoarthritis of the knee joint in the community: the importance of the patellofemoral joint. Ann Rheum Dis. 1992 Jul;51(7):844-9.
8. Widuchowski W, Widuchowski J, Trzaska T. Articular cartilage defects: study of 25,124 knee arthroscopies. Knee. 2007 Jun;14(3):177-82.
9. Lammentausta E, Kiviranta P, Toyras J, Hyttinen MM, Kiviranta I, Nieminen MT, et al. Quantitative MRI of parallel changes of articular cartilage and underlying trabecular bone in degeneration. Osteoarthritis Cartilage. 2007 Oct;15(10):1149-57.
10. Franklin J, Englund M, Ingvarsson T, Lohmander S. The association between hip fracture and hip osteoarthritis: a case-control study. BMC Musculoskelet Disord. 2010 Nov 26;11:274,2474-11-274.
Figures
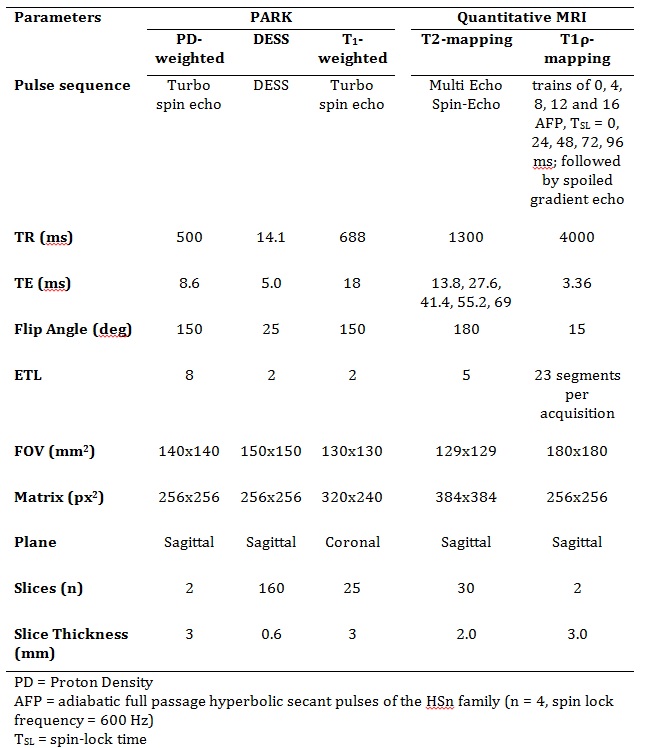
Table 1. MRI parameters used for Park-grading and quantitative MRI study protocol.
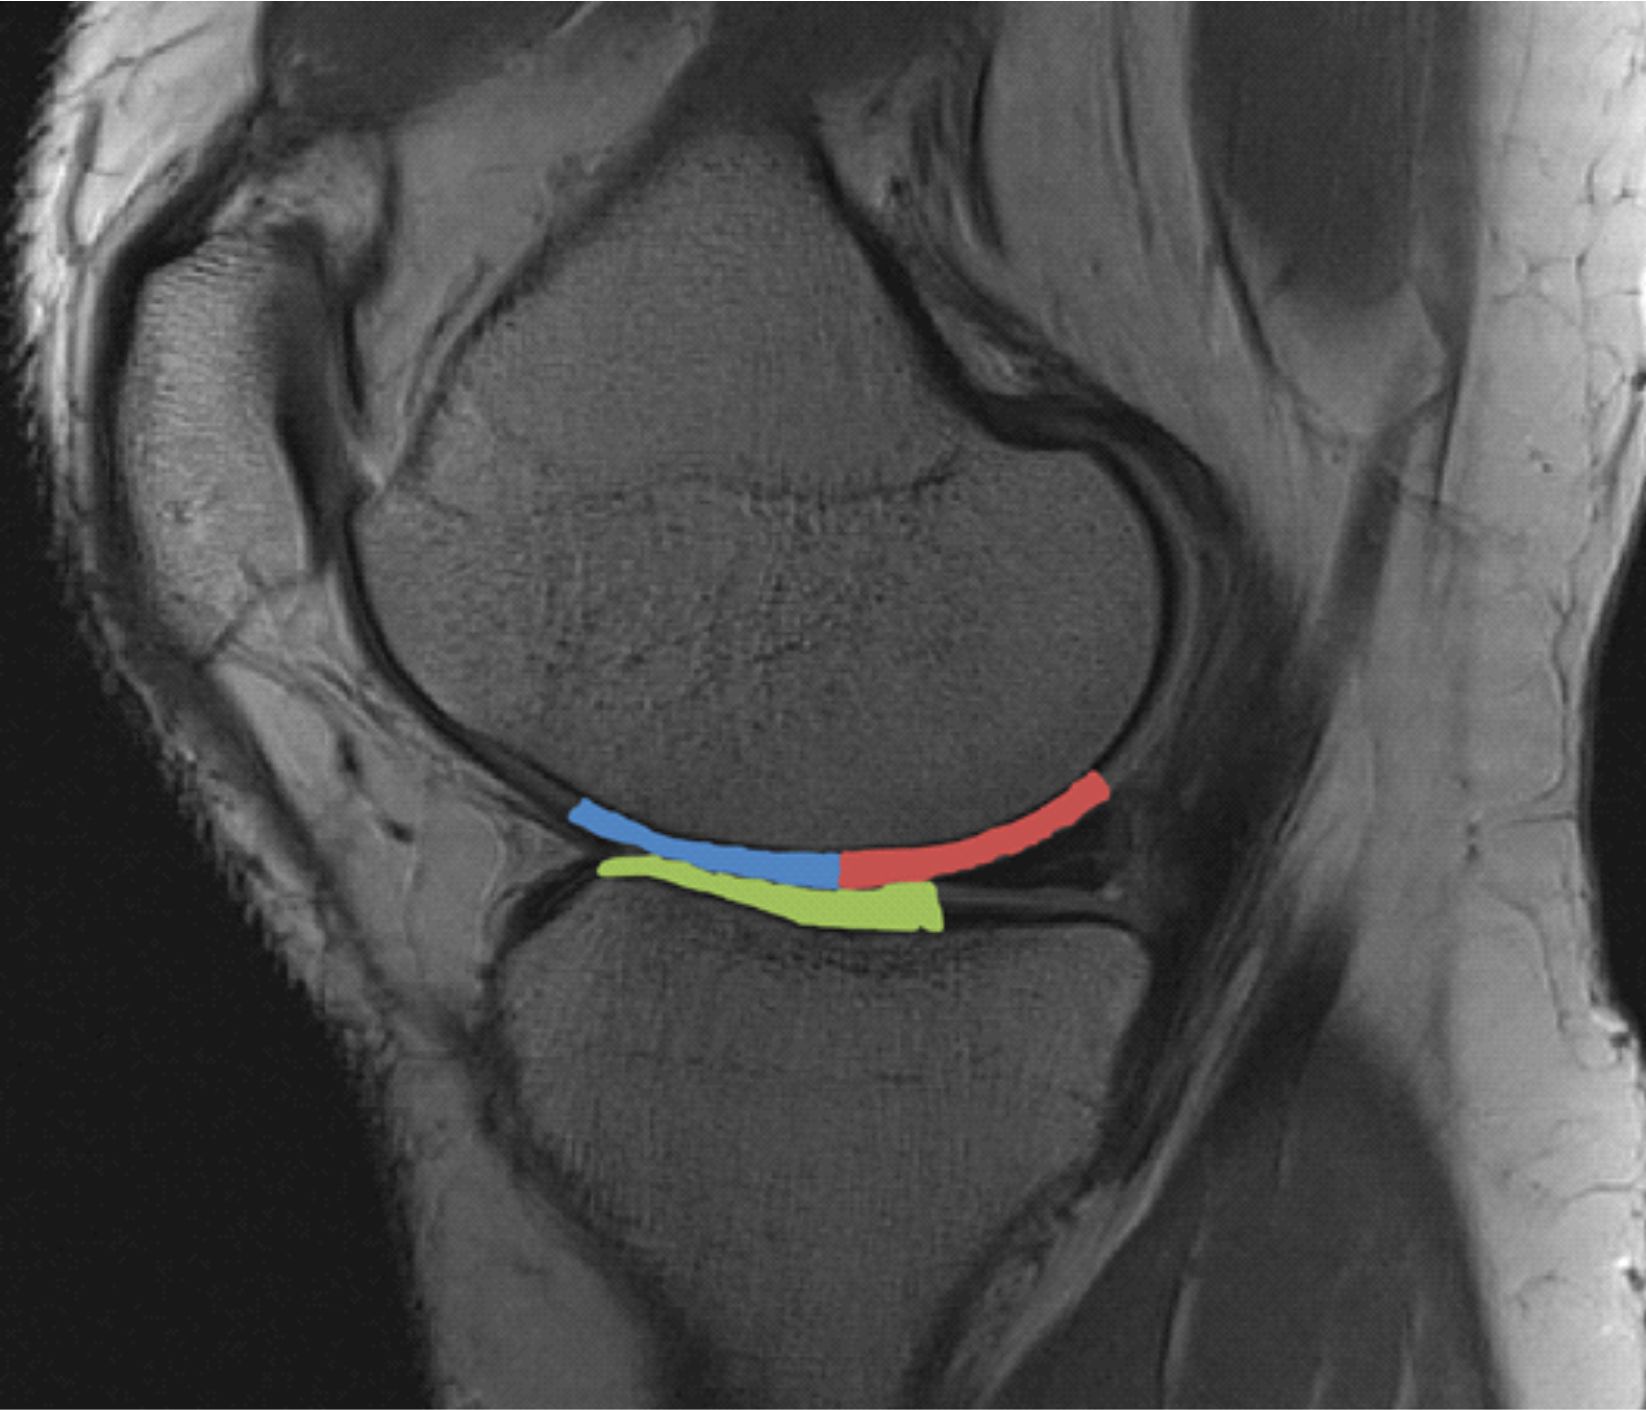
Figure 1. Sagittal T2-weighted image of tibiofemoral joint in a 37-year-old mutation-negative female. Studied regions of interest are marked with blue (anterior central femur), red (posterior central femur) and green (central tibia) color.
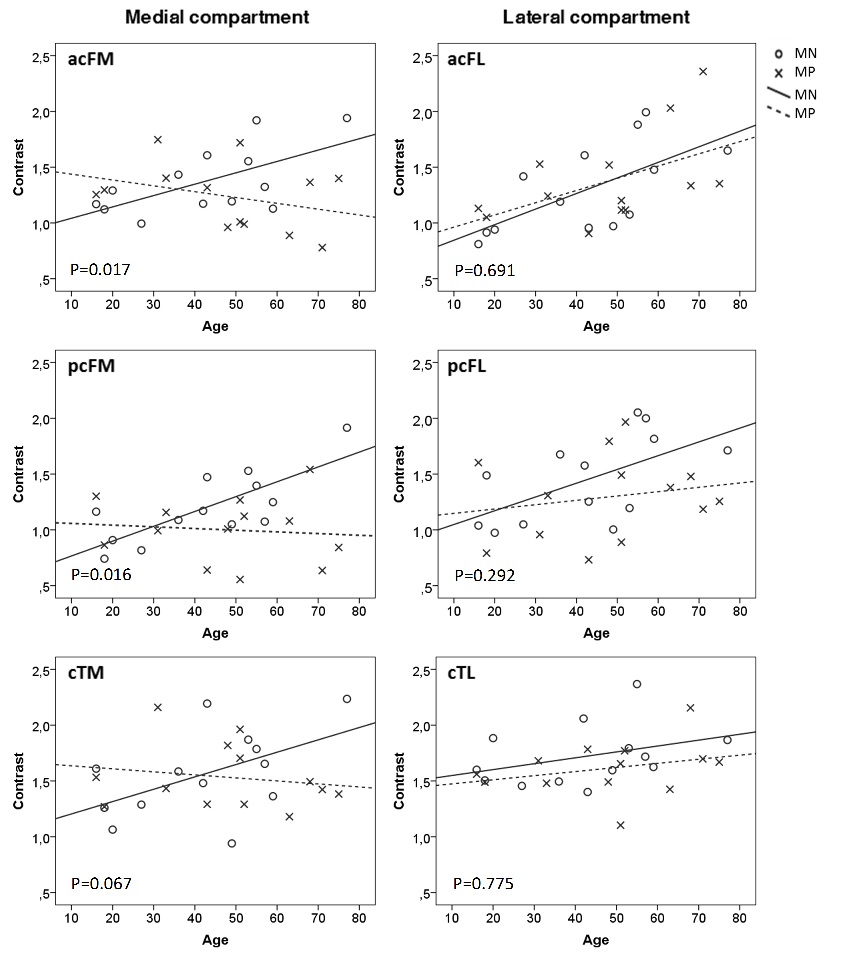
Figure 2. Contrast dependency on subject age for 13 mutation-positive (MP) and 13 mutation-negative (MN) subjects with a heterozygous WNT1 mutation p.C218G. Regression lines for both groups are displayed. P-value indicates the difference of the regression coefficients. The medial compartment demonstrates inverse setting of MP and MN groups, suggesting possible age-related cartilage preservation in the MP group. Results are presented separately for different regions of interest: acF = anterior central femur, pcF = posterior central femur, cT =central tibia, in medial (M) and lateral (L) condyles.