0198
Using Multidimensional Data Analysis to Identify Traits of Hip OA1UCSF, San Francisco, CA, United States
Synopsis
This study aims to use big data analytics and imaging to simultaneously analyze all the combined variables in order to identify biomarkers able to classify the different disease progression of hip OA. 102 subjects and their 184 variables were examined. Big data analytics tool, Topological Data Analysis (TDA), was used to generate hypotheses. Three main groups were identified: healthy control subjects, subjects with radiographic and morphological evidence of OA, and subjects who progressed inconsistently were separated by knee biomechanics. The analysis obtained with TDA proposes new phenotypes of these subjects also shows the potential for further examination.
Introduction
Osteoarthritis (OA) is a complex degenerative disease and a leading cause of disability in the United States affecting more than 26 million Americans1. Recently, more OA research has been utilizing noninvasive imaging to observe the progression of the disease. The typical approach to this research has focused on one aspect at a time, thus limiting the scope of connectivity and correlation between vastly different factors of the disease. In order to combat this single variable limitation, recent innovations in big data analytics and machine learning opens up a new possibility of comparing individual patients in a multidimensional space2. Topological data analysis (TDA) is a big-data analytics tool that can project all of a patients variables simultaneously into ‘syndromic space3. We used TDA in this study to integrate morphological, biochemical, biomechanical, and bone shape features in order to assess hip OA traits with the goal of tracking the trajectory of the disease as well as studying the interacting between the various features.Method
102 subjects with and without radiographic or symptomatic evidence of hip OA were recruited for this study (N=68 KL 0-1 age 40.98±12.30, BMI 23.95±3.09; N=34 KL 2-3 age 51.31±13.40, BMI 23.87±2.92). Demographics, patient reported outcomes including: HOOS4, pain radiograph Kellgren-Lawrence grading5, MR SHOMRI morphological grading6, MR cartilage T1ρ and T2 relaxation times in cartilage global compartments, sub-compartments and layers7, gait kinematics and kinetics during walking were collected and quantified8, and 20 bone shapes analyzed9, building for each subject a 184D heterogeneous feature vector that integrates morphological, biomechanical, and biochemical data. TDA was used in order to simultaneously cross correlate all possible predictors by building a network that describes subjects similarities in the multidimensional space; similar subjects are put together in the same node, similar nodes are connected with a line, or edge3. This network was built using morphological MRI grading, compositional MRI, gait biomechanics, and bone shape analysis. This network shape was used to generate hypothesis. These hypotheses were evaluated using formal Kolmogorov-Smirnov (K-S) testing in order to validate subnetworks and comparisons. Once the network is built it can be color coded for any variable in order to extract patterns. Three progression variables (3Year – Baseline) were created for this extraction: HOOS pain, Femoral cartilage T1p and T2, and Acetabular cartilage T1p and T2.Results
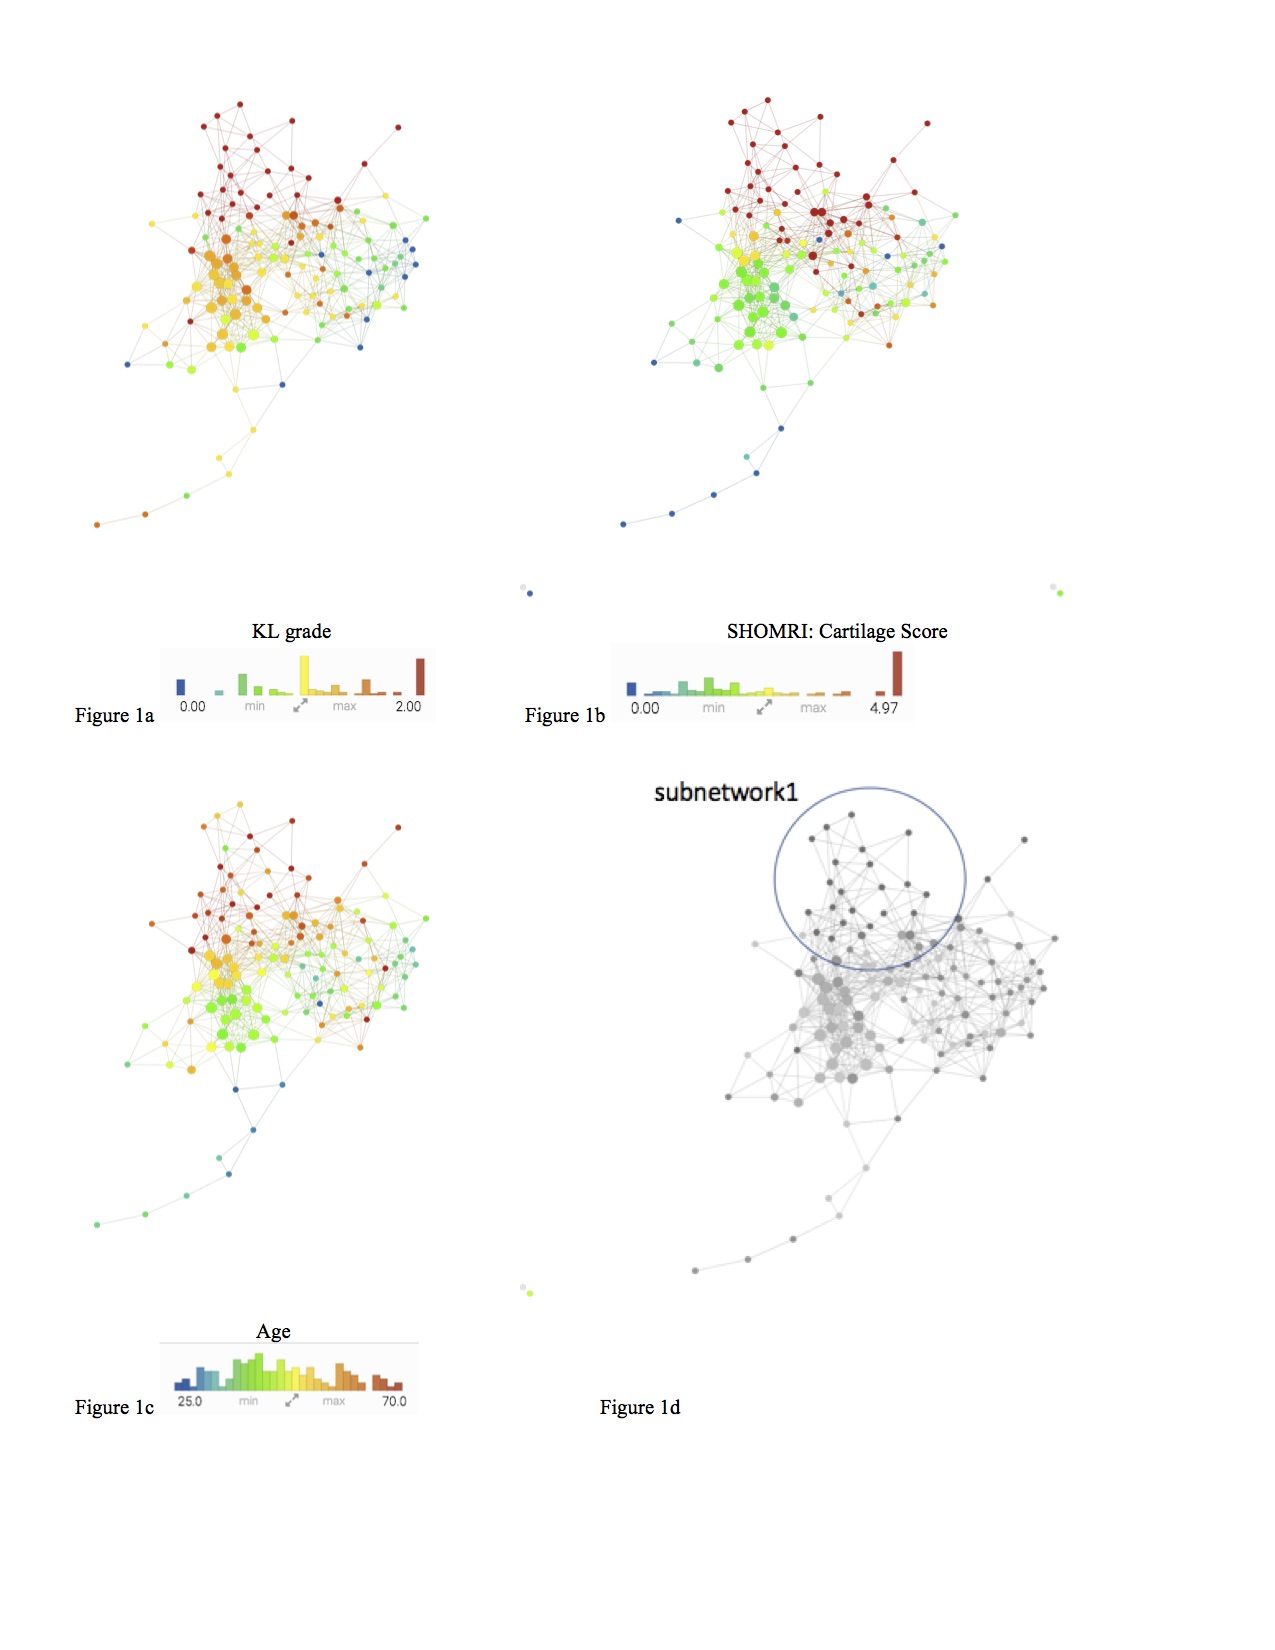
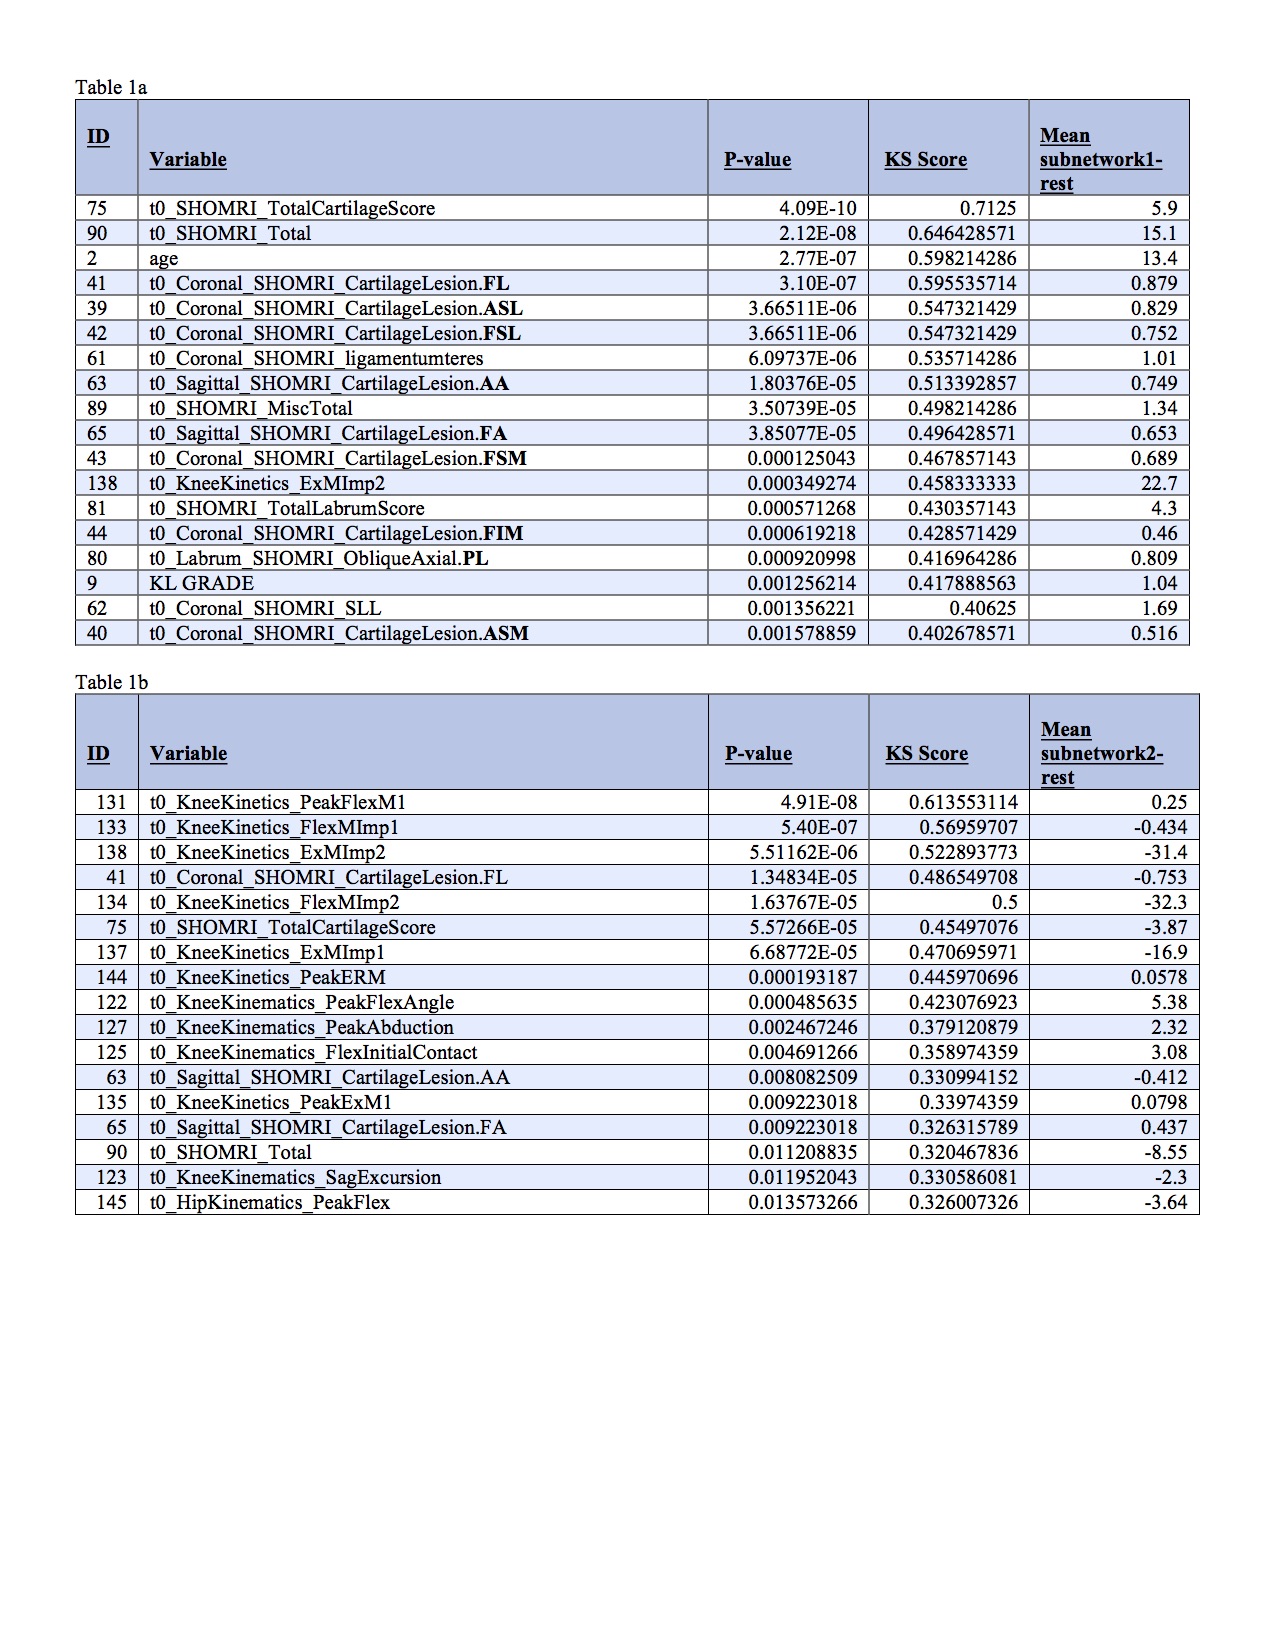
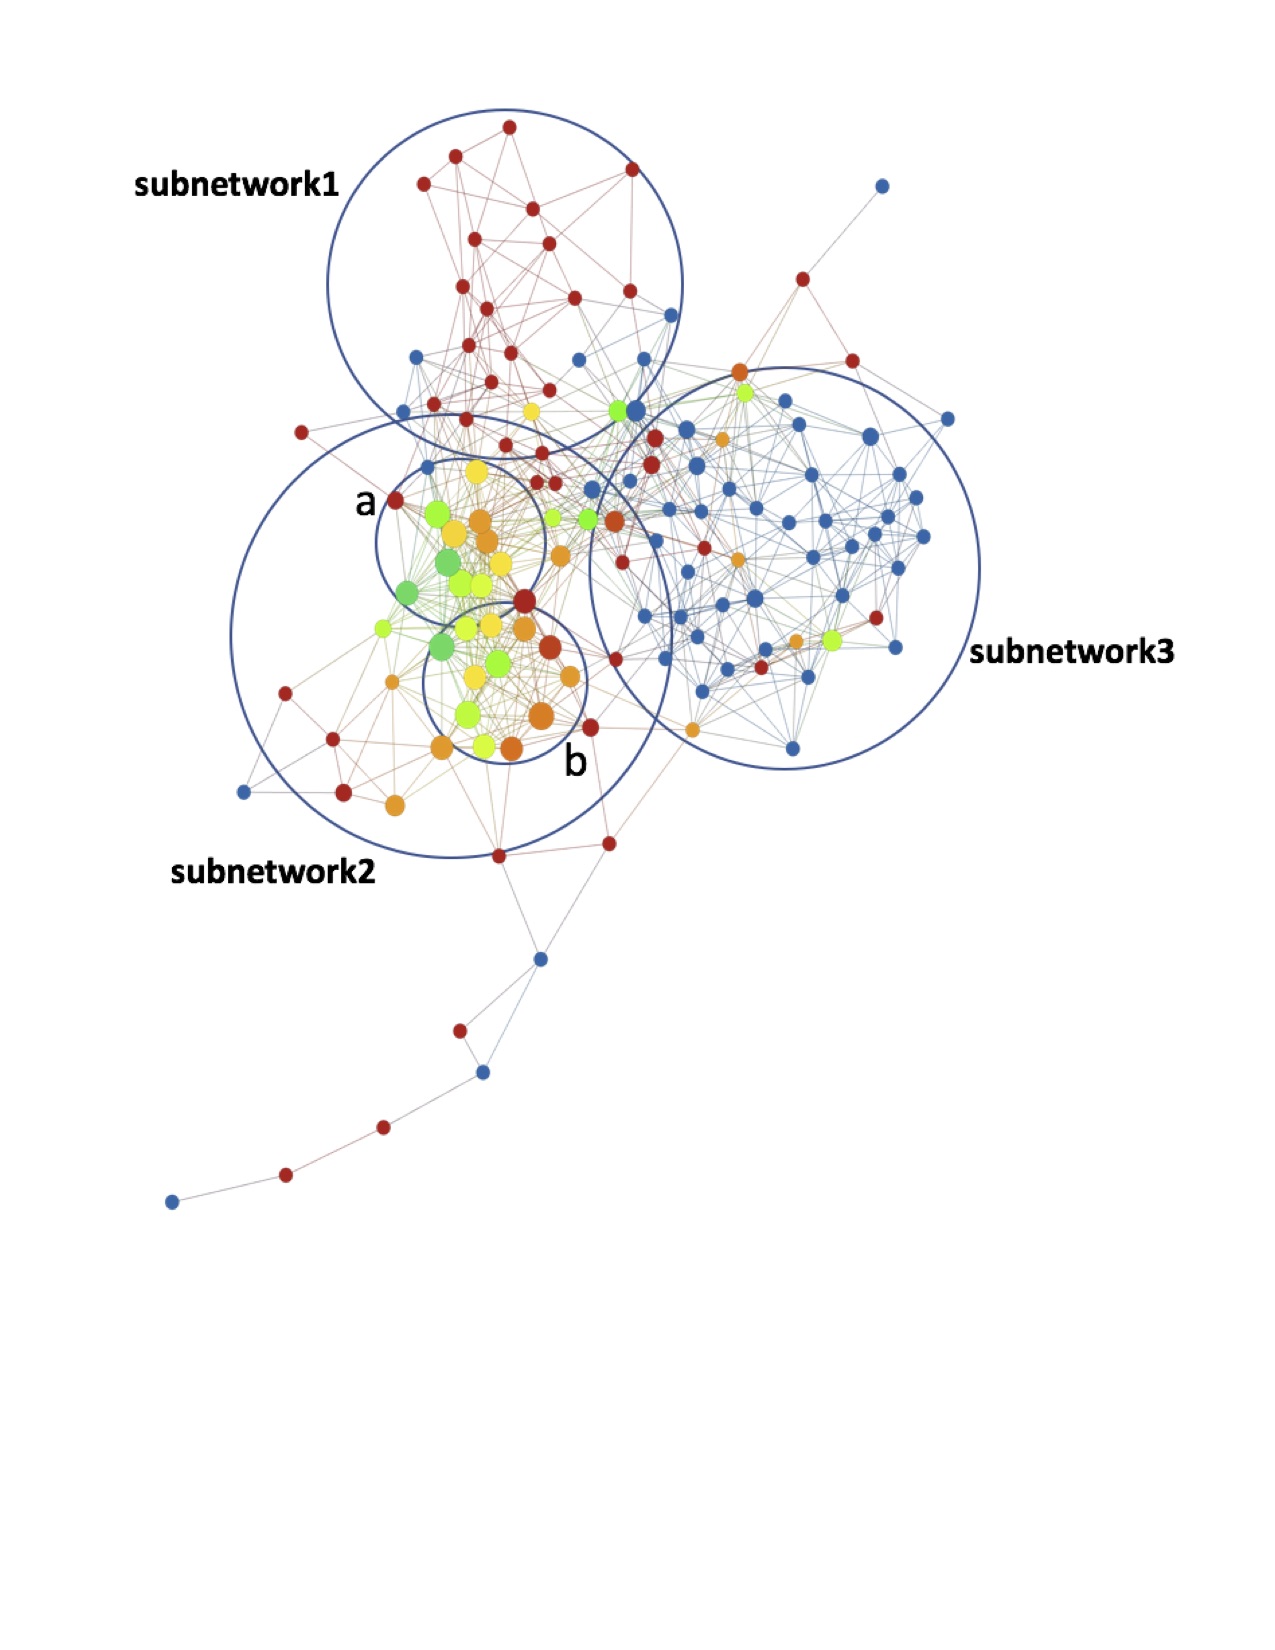
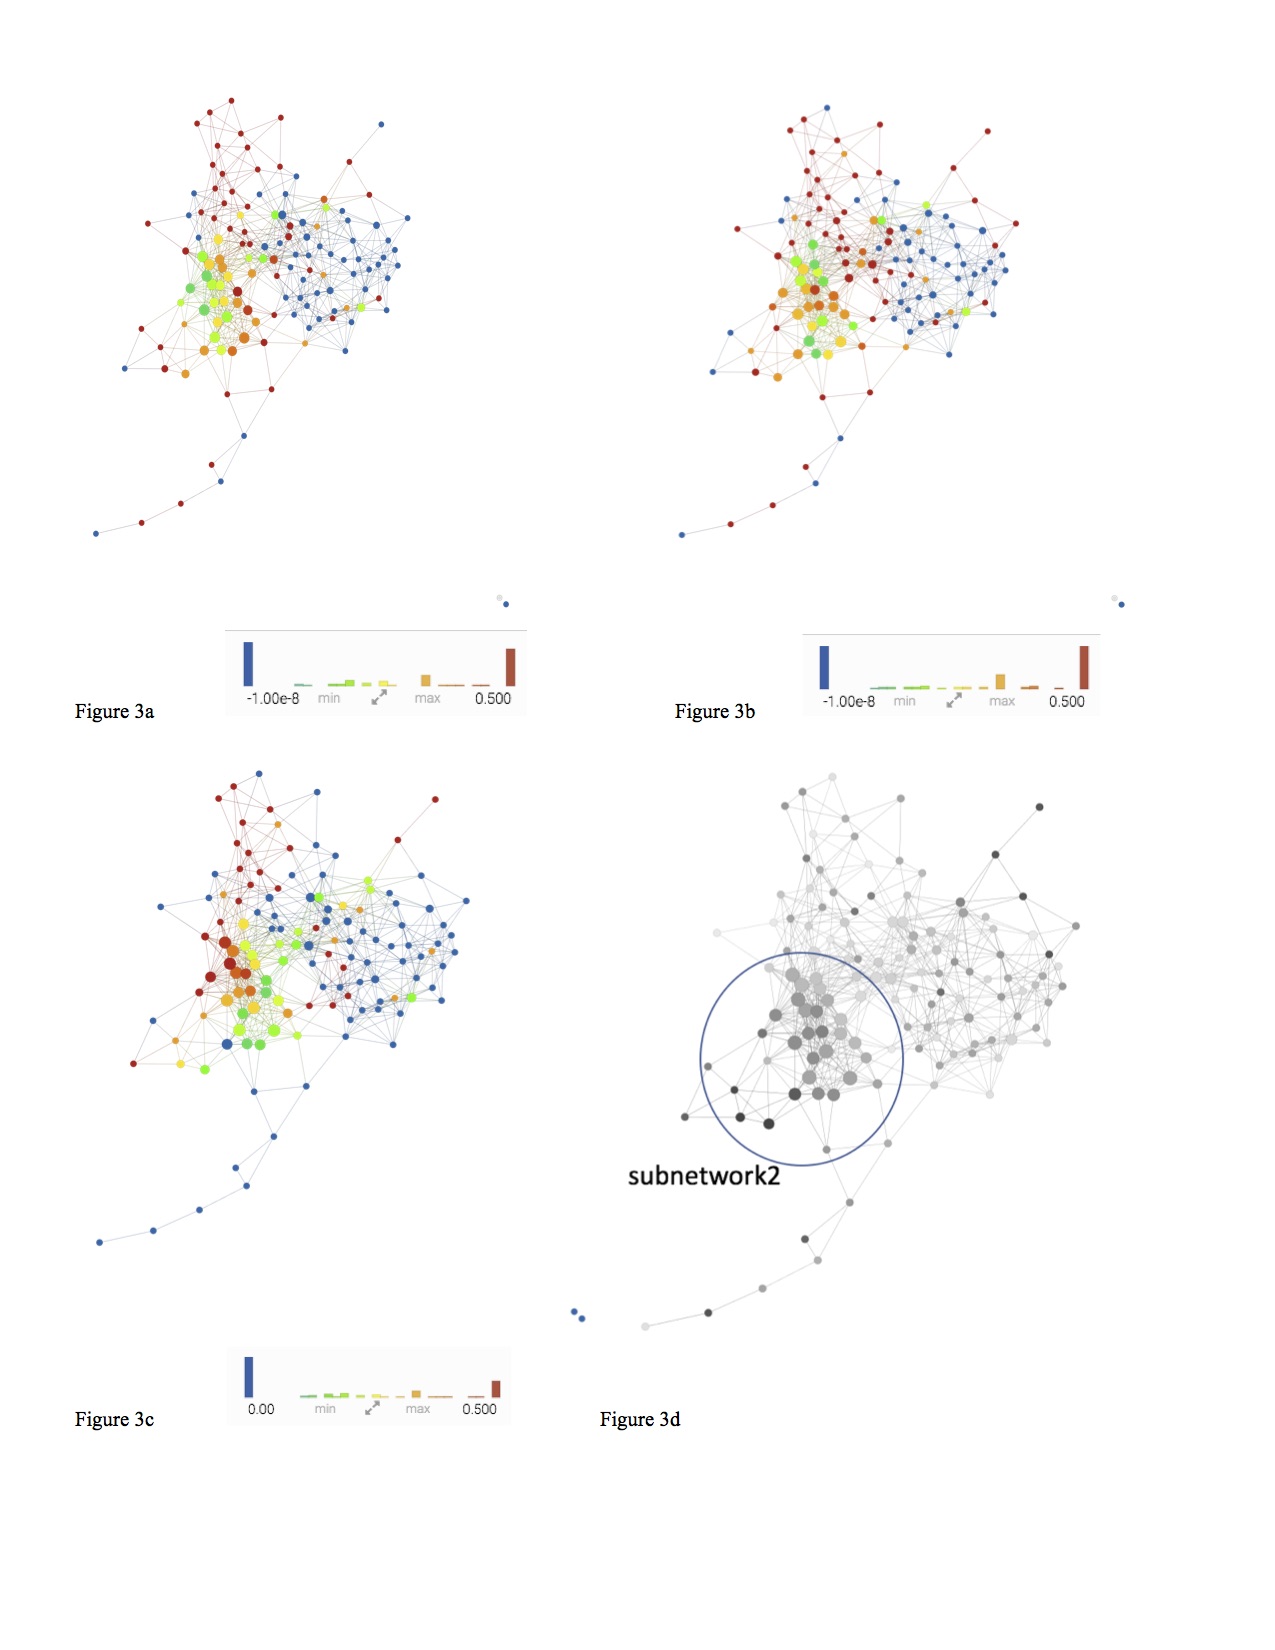
The morphological MRI and age networks showed a clear subpopulation of subjects with definite signs of radiographic OA (Figure 1). TDA was able to extract the subpopulation of severe patients, subnetwork1. The Kolmogorov-Smirnov (K-S) test revealed significant differences between the severe patients and the rest of the patients: Specifically, age and Total Cartilage Score was observed as the strongest predictor of membership to the severe group (p < 0.0001) (Table 2a). Upon visual inspection of the progression colored networks TDA was able to extract a second subpopulation of healthy control patients, subnetwork3 (Figure 2). These subjects showed healthy averages in pain scores, morphology, and pain progression. The progression colored networks also pointed out a third subnetwork: subnetwork2 (Figure 3). These subjects did not fit in the healthy group or the radiographic OA group, but showed symptoms in between. The K-S test revealed a significant difference between subnetwork2 and the rest of the network (Figure 3), specifically separated by Knee Kinetics Peak Flex Moments and Impulses (p < 0.0001) (Table 2b). Further inspection of the progression networks in subnetwork2 pointed out an inversion of pain progression and T1p/T2 progression; some patients progressed in one, but not the other.Discuss and Conclusion
In this study we presented the first application of TDA in hip OA. The results obtained revealed the presence of subjects’ subgroups characterized by a distinctive morphological, biochemical, and biomechanical signature. Alongside the significant differences of KL grading observed between the 3 main subnetworks, the data-driven clustering obtained with TDA proposes a new phenotyping of these subjects that more specifically identifies characteristics of early onset classification before KL and morphological evidence can be determined. The majority of subjects could not be classified with just KL or SHOMRI grading; these techniques only pointed to those subjects with clearly high cartilage degradation or already narrowed joint spacing. However, before morphological and radiographic evidence is apparent, TDA was able to point to alternative progression subgroups. Subnetwork2 is neither healthy nor strict OA, but are separated by a biomechanical (loading) change. These patients also show the potential to progress in both pain and composition, but progression is not consistent in all subjects which could explain why early OA diagnosis is so complex, as adaptation of biomechanical factors occur before radiographic evidence is seen.Acknowledgements
Acknowledgements: this project was supported by Grant Number P50 AR060752 (SM) and R01AR046905 (SM) and K99AR070902 (VP)References
1. Zhang Y, Jordan JM. Epidemiology of osteoarthritis. Clin Geriatr Med 2010;26:355-69.
2. Pedoia V, Haefeli J, Morioka K, et al. MRI and biomechanics multidimensional data analysis reveals R2 -R1rho as an early predictor of cartilage lesion progression in knee osteoarthritis. J Magn Reson Imaging 2017.
3. Lum PY, Singh G, Lehman A, et al. Extracting insights from the shape of complex data using topology. Sci Rep 2013;3:1236.
4. Nilsdotter AK, Lohmander LS, Klassbo M, Roos EM. Hip disability and osteoarthritis outcome score (HOOS)--validity and responsiveness in total hip replacement. BMC Musculoskelet Disord 2003;4:10.
5. Kellgren JH, Lawrence JS. Radiological assessment of osteo-arthrosis. Ann Rheum Dis 1957;16:494-502.
6. Lee S, Nardo L, Kumar D, et al. Scoring hip osteoarthritis with MRI (SHOMRI): A whole joint osteoarthritis evaluation system. J Magn Reson Imaging 2015;41:1549-57.
7. Carballido-Gamio J, Bauer JS, Stahl R, et al. Inter-subject comparison of MRI knee cartilage thickness. Med Image Anal 2008;12:120-35.
8. Samaan MA, Teng HL, Kumar D, et al. Acetabular cartilage defects cause altered hip and knee joint coordination variability during gait. Clin Biomech (Bristol, Avon) 2015;30:1202-9.
9. Pedoia V, Samaan MA, Inamdar G, Gallo MC, Souza RB, Majumdar S. Study of the interactions between proximal femur 3d bone shape, cartilage health, and biomechanics in patients with hip Osteoarthritis. J Orthop Res 2017.
Figures