0197
Correlations of T1ρ with properties of articular cartilage depend on the spin-lock amplitude and orientation of the sample1Department of applied physics, University of Eastern Finland, Kuopio, Finland, 2Department of Biomedical Engineering, Eindhoven University of Technology, Eindhoven, Netherlands, 3Research Unit of Medical Imaging, Physics and Technology, University of Oulu, Oulu, Finland
Synopsis
Several studies have reported different findings on the correlations of the CW-T1ρ relaxation time in articular cartilage with its different properties. Most studies agree on the sensitivity of CW-T1ρ to cartilage proteoglycans, although reports specifically against this also exist. Furthermore, CW-T1ρ has been connected to the collagen network properties and also correlated with T2 relaxation time. Orientation dependence of CW-T1ρ has been reported, as well as its dependence on the spin-locking amplitude. This study aims to combine all of these aspects in a single study.
Introduction
Continuous wave (CW)-T1ρ relaxation time is one the candidates proposed for the quantitative assessment of articular cartilage. Reports have demonstrated the sensitivity of CW-T1ρ to proteoglycans, 1,2 to collagen network properties 3 and to the orientation of cartilage in the magnetic field. 3-6 Some reports have found that CW-T1ρ does not correlate with the proteoglycan concentration, 7 and while similar with T2 relaxation time, it is not necessarily the same. 8-10 Furthermore, orientation dependence has been reported for CW-T1ρ, and ascribed to residual dipolar coupling 3,5 (the “magic angle effect”), reduced by increasing the spin-lock amplitude. On the other hand, spin-lock amplitude has marked effects on the sensitivity of CW-T1ρ to cartilage properties. This study aimed to clarify the correlations of CW-T1ρ with the properties of articular cartilage by measuring the relaxation time over a broad range of spin-lock amplitudes and over four different orientations of the tissue with respect to the main magnetic field (B0).Methods
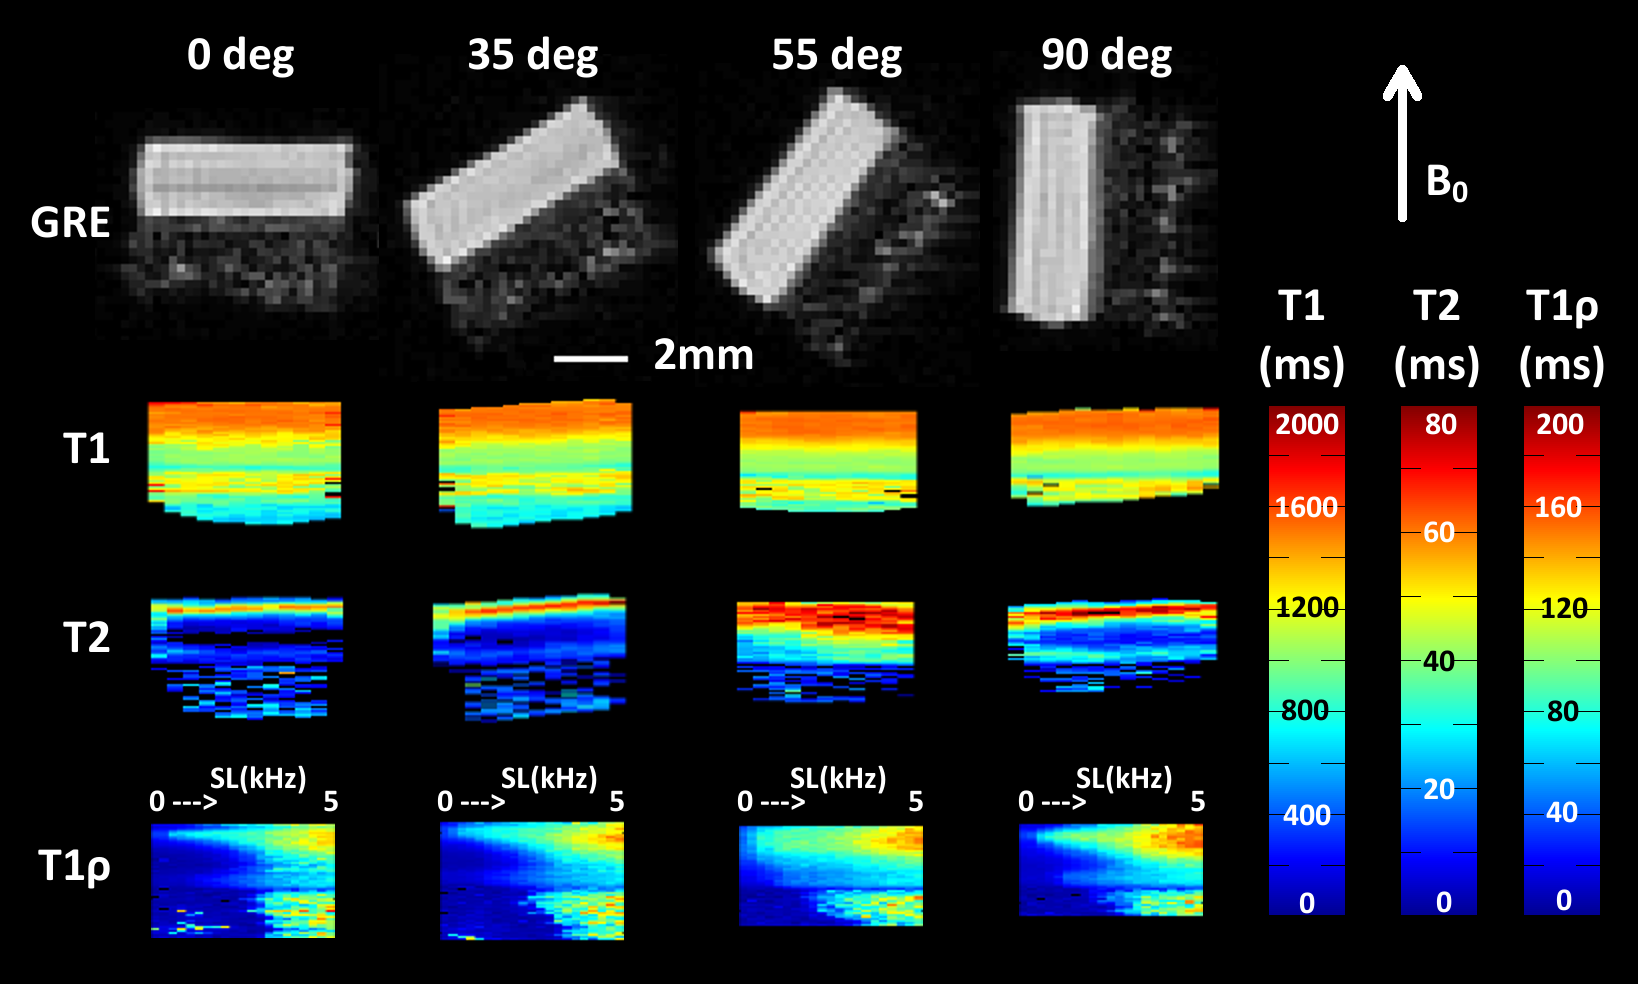
Patellas were extracted from four bovine knees and cylindrical cartilage-bone plugs (n=10) were harvested, immersed in phosphate buffered saline and frozen at -22°C. Biomechanical properties were measured using a flat-ended indenter (dia.=1.0mm) and stress-relaxation and dynamic testing. 11,12 Young’s modulus at equilibrium, dynamic modulus (@1.0Hz) and phase angle were calculated. 13,14 For MRI, the samples were immersed in perflouropolyether (Galden HS 240, Solvay Solexis, Italy) in a holder allowing re-orientation of the sample with respect to B0. MRI was done at 9.4T using a 19-mm quadrature RF volume transceiver (RAPID Biomedical GmbH, Rimpar, Germany) and a VnmrJ 3.1 Varian/Agilent DirectDrive console (Varian Associates Inc., Pala Alto, CA, USA). Samples were scanned using an FSE readout sequence with 1-mm slice, FOV=18x18mm, matrix (ROxPE)=256x32, ETL=8 and effective TE=5ms, for a total time of 45 min per orientation. For each orientation, inversion recovery T1 measurement (TR=7000ms, 6 TIs=0.2-3s); spin echo T2 measurement (TR=5000ms, 7 TEs=10-128ms) and a CW-T1ρ scan with 21 spin-lock amplitudes spanning the range 0-5000Hz with 6 spin-lock times (TSL=0-128ms) was done. Furthermore, a 3-D dataset with GRE was acquired for every orientation. The samples were measured at approximately 0°, 35°, 55° and 90° orientations. Pixel-wise relaxation time maps were calculated and ROIs were defined for superficial, transitional and radial zones. Relaxation anisotropy was calculated for deep cartilage. 3 Spearman correlation was used to compare the biomechanical parameters with the relaxation times.Results
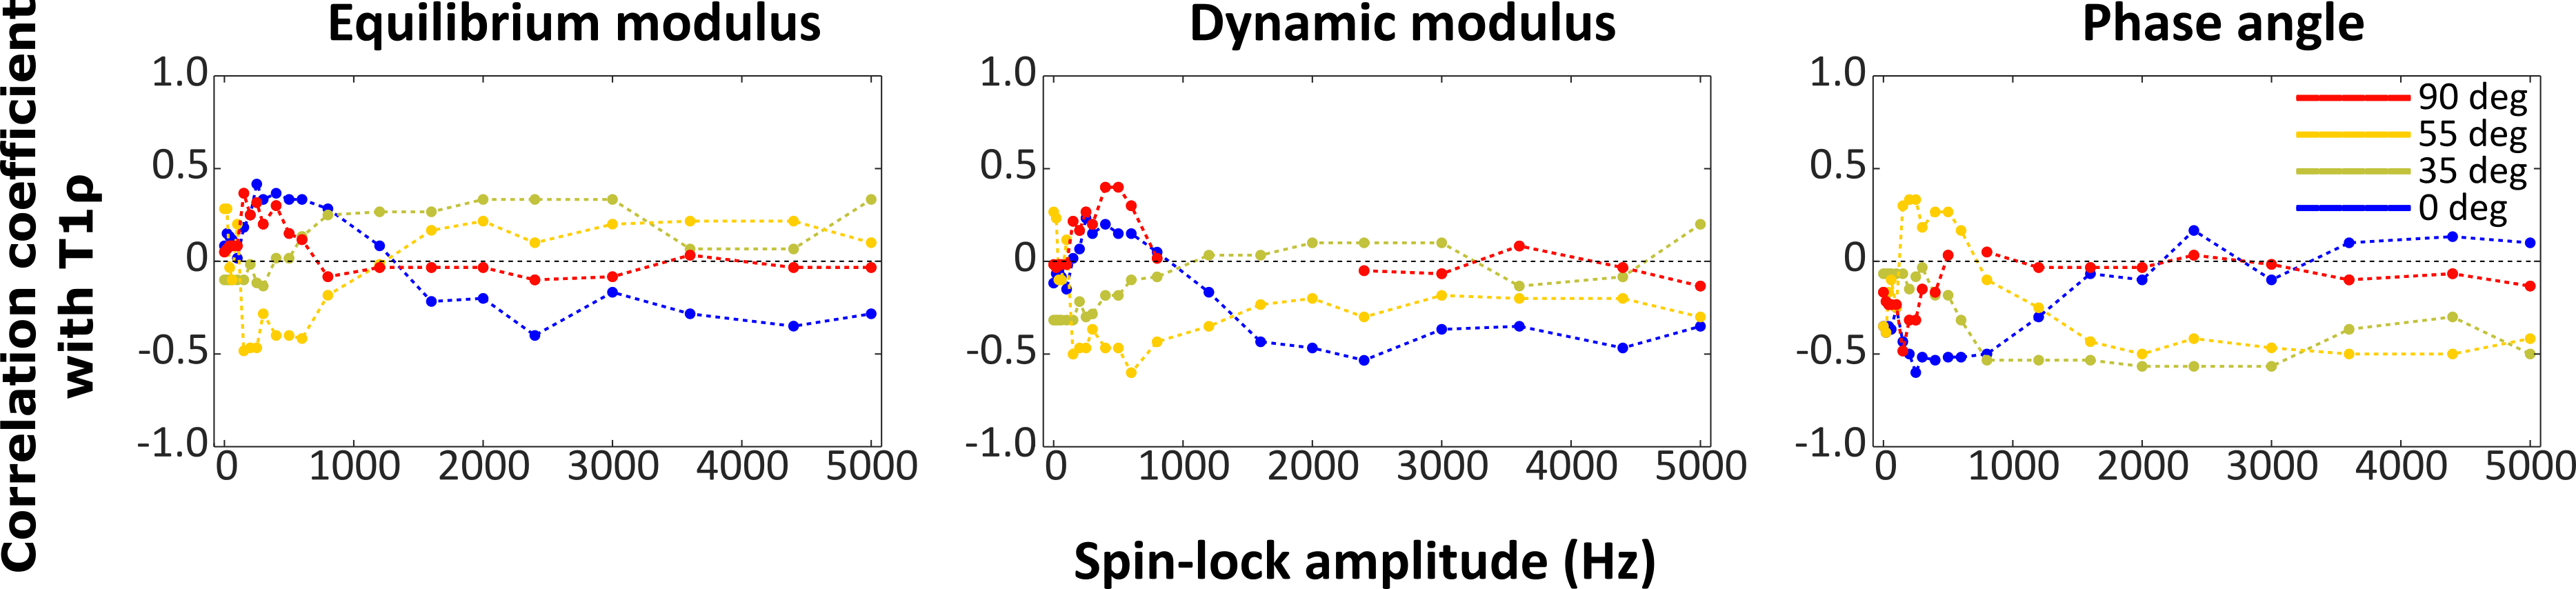
T2 and CW-T1ρ relaxation times were found sensitive to orientation, while T1 relaxation time was not (Fig.1). Furthermore, an increase in the T1ρ relaxation time with increasing spin-lock amplitude was noted at all orientations (Fig.1). The CW- T1ρ relaxation anisotropy decreased and stabilized after a spin-lock amplitude of approximately 1500Hz to a value of ~10%, approaching the ~4% noted for T1 (Fig.2). Towards lower spin-lock amplitudes, the anisotropy increased reaching ~60% at 150Hz spin-lock. Below this, an unexpected decrease (although coincident with increasing artifacts) was noted. The T2 anisotropy was the highest at approximately 65% (Fig.2). The average Young’s modulus at equilibrium was 0.75±0.43MPa, dynamic modulus 4.26±1.61MPa and the phase angle 10.41°±2.70°. The correlations between the CW-T1ρ and the biomechanical parameters had a significant dependence on the specimen orientation, but especially on the spin-lock amplitude (Fig.3). In the superficial and transitional zones, equilibrium modulus and dynamic modulus demonstrated a significant negative and the phase angle a significant positive correlation with the CW-T1ρ relaxation time – for spin-lock amplitudes above 600-700Hz. Below 600Hz, the correlation coefficients behaved more randomly (Fig.3). In the radial zone, the correlation coefficients stabilized above spin-lock amplitude of ~1500Hz, and strongly depended on the sample orientation (Fig.4).Discussion
The CW-T1ρ relaxation time appears to depend on the orientation of cartilage with respect to B0, but also especially on the spin-lock amplitude. From a relatively high anisotropy of ~60%, the CW-T1ρ relaxation anisotropy reached a stable level of ~10% above a spin-lock amplitude of 1500Hz, indicating that at around this amplitude the majority of residual dipolar coupling responsible for the orientation sensitivity is overpowered by the spin-locking pulse, in line with the findings of Akella 5 and Hänninen. 3 An interesting finding was also that the biomechanical parameters correlated with the CW-T1ρ relaxation time in the superficial and transitional zones – but consistently only above approximately 600-700Hz spin-locking amplitude. The correlation especially with Young’s modulus at equilibrium appeared strong. All of these findings point both to the potential of using CW-T1ρ as a biomarker for cartilage properties, but also warrant caution with interpretation of CW-T1ρ data. Especially attention to the used spin-locking amplitude should be paid when interpreting CW-T1ρ results.Acknowledgements
Support from the Academy of Finland (grants #285909, #293970 and #297033) is gratefully acknowledged.References
1. Wheaton AJ, Dodge GR, Borthakur A, Kneeland JB, Schumacher HR, Reddy R. Detection of changes in articular cartilage proteoglycan by T(1rho) magnetic resonance imaging. J Orthop Res 2005;23(1):102-108.
2. Akella SV, Regatte RR, Gougoutas AJ, Borthakur A, Shapiro EM, Kneeland JB, Leigh JS, Reddy R. Proteoglycan-induced changes in T1r-relaxation of articular cartilage at 4T. Magn Reson Med 2001;46(3):419-423.
3. Hanninen N, Rautiainen J, Rieppo L, Saarakkala S, Nissi MJ. Orientation anisotropy of quantitative MRI relaxation parameters in ordered tissue. Sci Rep 2017;7(1):9606. doi: 10.1038/s41598-017-10053-2.
4. Shao H, Pauli C, Li S, Ma Y, Tadros AS, Kavanaugh A, Chang EY, Tang G, Du J. Magic angle effect plays a major role in both T1rho and T2 relaxation in articular cartilage. Osteoarthritis Cartilage 2017. doi: 10.1016/j.joca.2017.01.013.
5. Akella SV, Regatte RR, Wheaton AJ, Borthakur A, Reddy R. Reduction of residual dipolar interaction in cartilage by spin-lock technique. Magn Reson Med 2004;52(5):1103-1109.
6. Wang N, Xia Y. Depth and orientational dependencies of MRI T(2) and T(1rho) sensitivities towards trypsin degradation and Gd-DTPA(2-) presence in articular cartilage at microscopic resolution. Magn Reson Imaging 2012;30(3):361-370. doi: 10.1016/j.mri.2011.10.004.
7. van Tiel J, Kotek G, Reijman M, Bos PK, Bron EE, Klein S, Nasserinejad K, van Osch GJ, Verhaar JA, Krestin GP, Weinans H, Oei EH. Is T1rho Mapping an Alternative to Delayed Gadolinium-enhanced MR Imaging of Cartilage in the Assessment of Sulphated Glycosaminoglycan Content in Human Osteoarthritic Knees? An in Vivo Validation Study. Radiology 2016;279(2):523-531. doi: 10.1148/radiol.2015150693.
8. Majumdar S, Li X, Blumenkrantz G, Saldanha K, Ma CB, Kim H, Lozano J, Link T. MR imaging and early cartilage degeneration and strategies for monitoring regeneration. J Musculoskelet Neuronal Interact 2006;6(4):382-384.
9. Mlynárik V, Trattnig S, Huber M, Zembsch A, Imhof H. The role of relaxation times in monitoring proteoglycan depletion in articular cartilage. J Magn Reson Imaging 1999;10(4):497-502.
10. Menezes NM, Gray ML, Hartke JR, Burstein D. T2 and T1rho MRI in articular cartilage systems. Magn Reson Med 2004;51(3):503-509.
11. Li LP, Herzog W, Korhonen RK, Jurvelin JS. The role of viscoelasticity of collagen fibers in articular cartilage: axial tension versus compression. Med Eng Phys 2005;27(1):51-57. doi: 10.1016/j.medengphy.2004.08.009.
12. Makela JT, Huttu MR, Korhonen RK. Structure-function relationships in osteoarthritic human hip joint articular cartilage. Osteoarthritis Cartilage 2012;20(11):1268-1277. doi: 10.1016/j.joca.2012.07.016.
13. Hayes WC, Keer LM, Herrmann G, Mockros LF. A mathematical analysis for indentation tests of articular cartilage. J Biomech 1972;5(5):541-551.
14. Korhonen RK, Laasanen MS, Töyräs J, Helminen HJ, Jurvelin JS. Comparison of the equilibrium response of articular cartilage in unconfined compression, confined compression and indentation. J Biomech 2002;35(7):903-909.
Figures