0196
Sensitivity of Relaxometry and Quantitative Susceptibility Mapping to Microscopic Iron Distribution1Radiology, University of Wisconsin - Madison, Madison, WI, United States, 2Medical Physics, University of Wisconsin - Madison, Madison, WI, United States, 3Medicine, University of Wisconsin - Madison, Madison, WI, United States, 4Biomedical Engineering, University of Wisconsin - Madison, Madison, WI, United States, 5Emergency Medicine, University of Wisconsin - Madison, Madison, WI, United States
Synopsis
MRI-based iron quantification enables the non-invasive assessment of tissue iron concentration. MRI relaxation parameters such as R2 and R2* are sensitive to iron concentration, but may depend on the microscopic spatial distribution of iron. Quantitative Susceptibility Mapping (QSM) is a promising iron quantification technique, but its sensitivity to the spatial distribution of iron remains unknown. In this work, we performed simulations and in vitro experiments using whole versus lysed erythrocytes to investigate this sensitivity. Our results suggest that QSM, unlike R2 and R2* relaxometry, is independent of the microscopic distribution of iron.
Introduction
Accurate MRI-based iron quantification is increasingly important for the assessment of tissue iron concentration and for quantitative imaging of iron-based contrast agents. MRI relaxation parameters such as R2 and R2* are sensitive to the presence of iron and correlate empirically with iron concentration. However, these relaxation parameters have a complicated empirical relationship with iron deposition, and depend on the microscopic spatial distribution of iron1,2.
Quantitative Susceptibility Mapping (QSM) may overcome the limitations of relaxometry. QSM is a promising technique to measure tissue iron content3 based on an intrinsic property (magnetic susceptibility) that is linearly related to iron concentration4. However, the sensitivity of R2, R2*, and QSM to the spatial distribution of iron is not well understood. Therefore, the purpose of this work was to investigate the dependence of R2, R2*, and QSM to the spatial distribution of iron using Monte Carlo simulations and in vitro experiments.
Methods
We designed Monte Carlo simulations and in vitro experiments based on a mixture of human erythrocytes with varying concentrations of an ultra-small superparamagnetic iron oxide (USPIO) contrast agent (ferumoxytol, AMAG Pharmaceuticals). Human erythrocytes are large (~6-8μm) compared to USPIOs (~25nm) and USPIOs do not enter the erythrocyte cell wall. This creates a heterogeneous spatial distribution of iron when mixed with blood. Further, repeating measurements after lysing the erythrocytes results in a homogeneous spatial distribution of iron, isolating the effect of the spatial distribution of iron.
Simulations
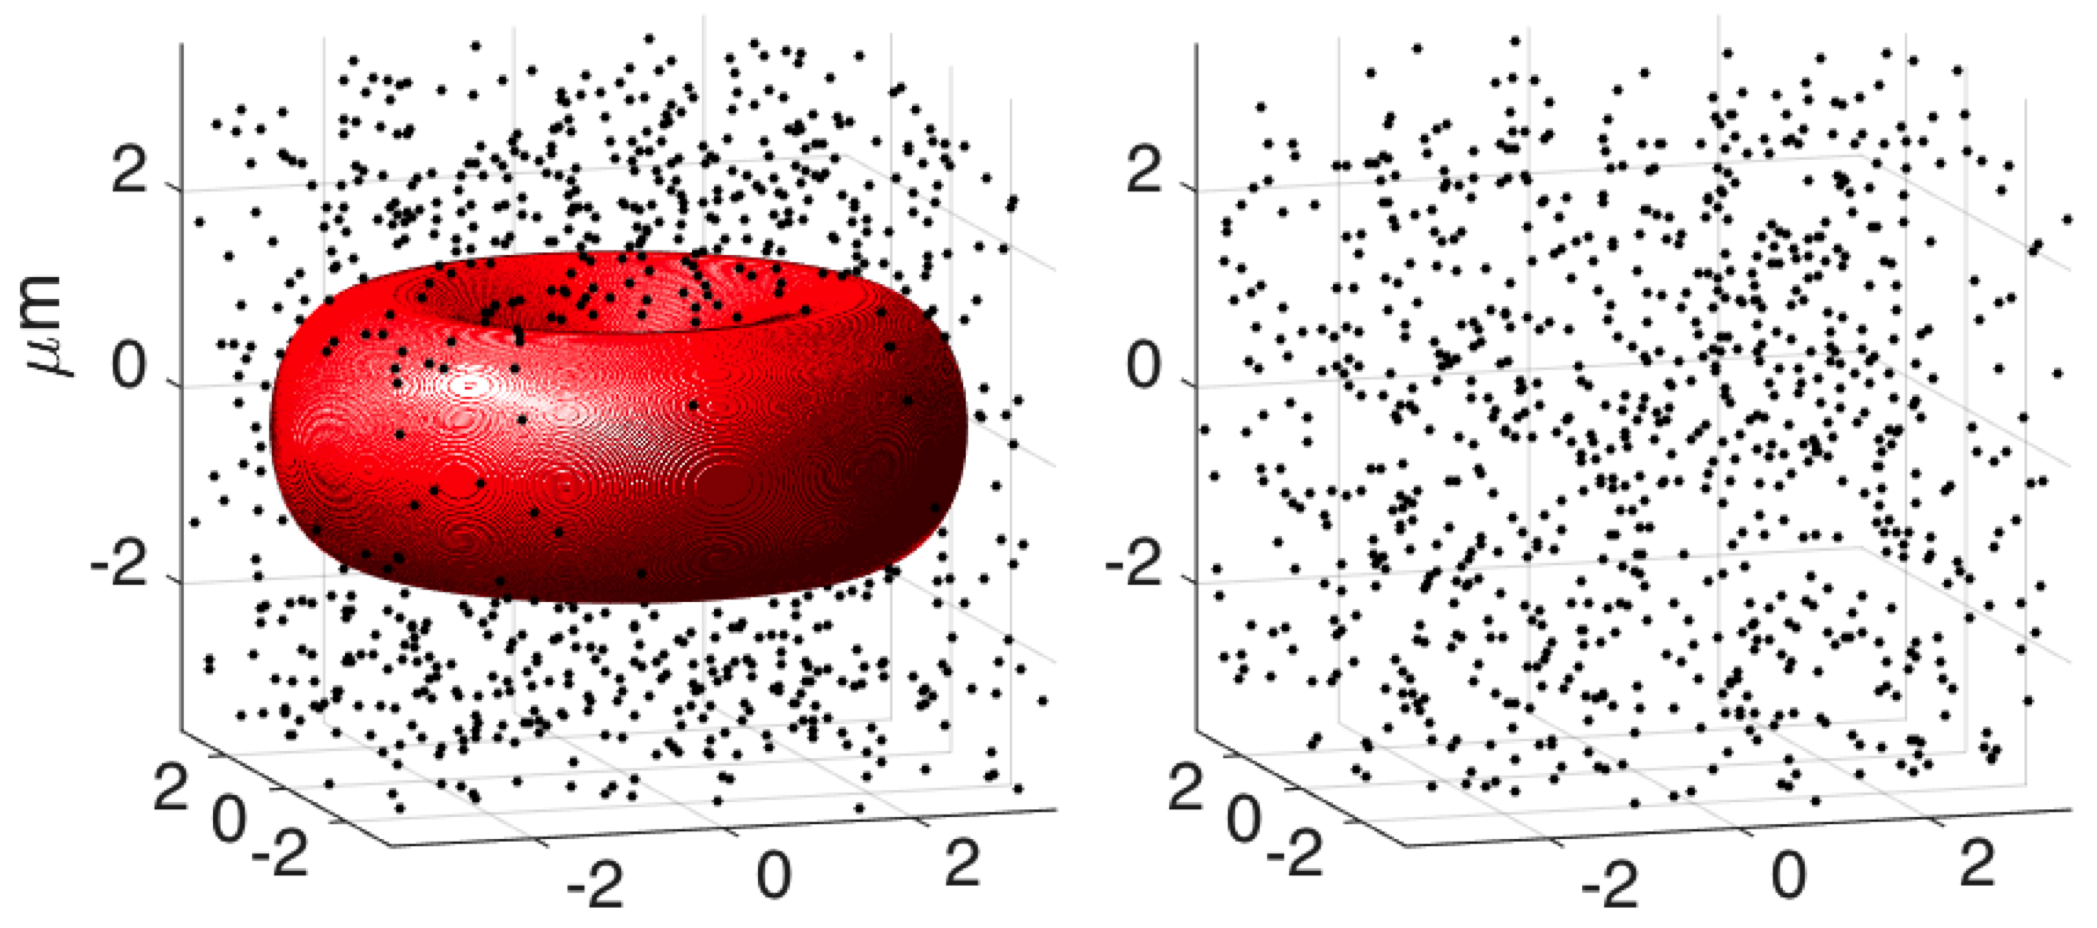
Monte Carlo simulations were performed over a range of iron concentrations, each with and without an erythrocyte5 (Figure 1). A single erythrocyte was simulated for computational speed. The susceptibility of individual iron particles was fixed at 1500ppm (estimated from Bullivant et al6) and the number of iron particles varied to simulate different volume susceptibilities. We assumed the blood cell and background had R2=R2*= susceptibility=07. Water protons (a total of 5000 protons1) were simulated to diffuse at a rate of 2μm2/ms, while iron and blood cells were assumed to be stationary. Diffusing water protons accumulated phase according to their path through the magnetic field and the corresponding gradient-echo (R2* measurement) and spin-echo (R2 measurement) signals were calculated across time. R2 and R2* were then estimated using non-linear least-squares fitting.
In Vitro Experiments
One unit of fresh packed human erythrocytes and one unit of plasma were combined to reconstitute whole blood. Blood cell membranes of half the sample were lysed by three 10-second sonication cycles (550 Sonic Dismembrator, Fisher Scientific, Hampton, NH) with 60-second cooling breaks between cycles to prevent protein heat damage. Complete cell membrane lysing was confirmed by microscopic inspection. Next, the whole and lysed blood samples were separated into eight 20mL vials containing varying concentrations (0-2.7mM) of ferumoxytol.
MR measurements were performed on a 1.5T MRI scanner (HDxt, GE Healthcare, Waukesha, WI) using an 8-channel torso coil (USA Instruments, Cleveland, OH).
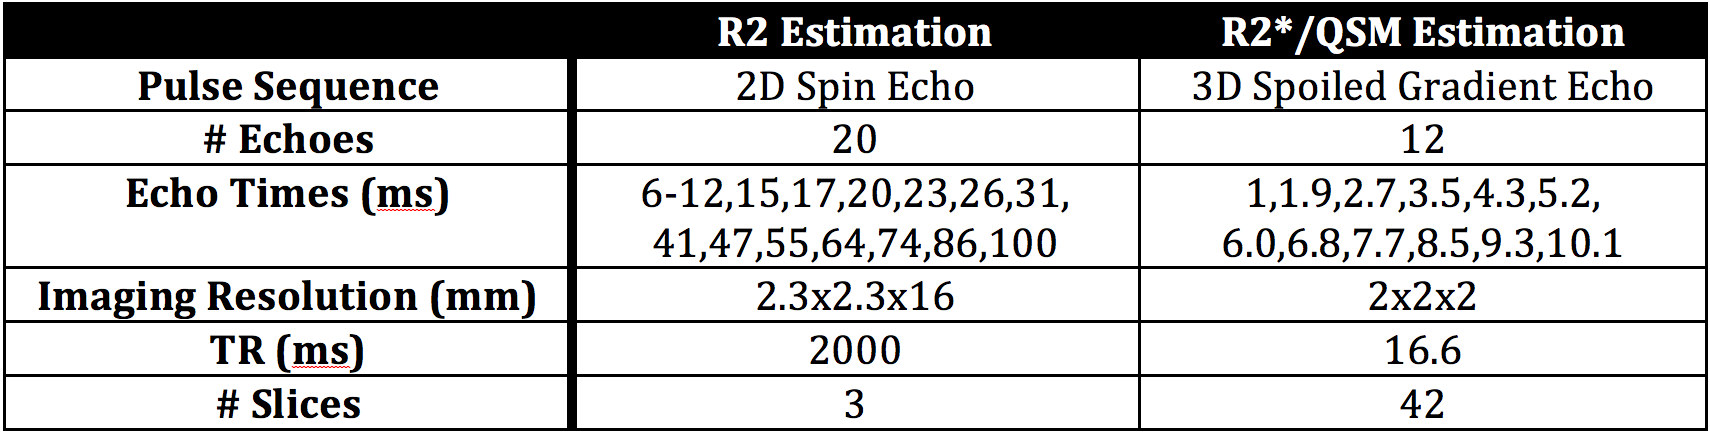
The samples were placed in a room temperature water bath. Scan parameters are shown in Table 1. The MEDI8 QSM algorithm with PDF9 background field removal was used to estimate susceptibility maps.
Results
Simulations
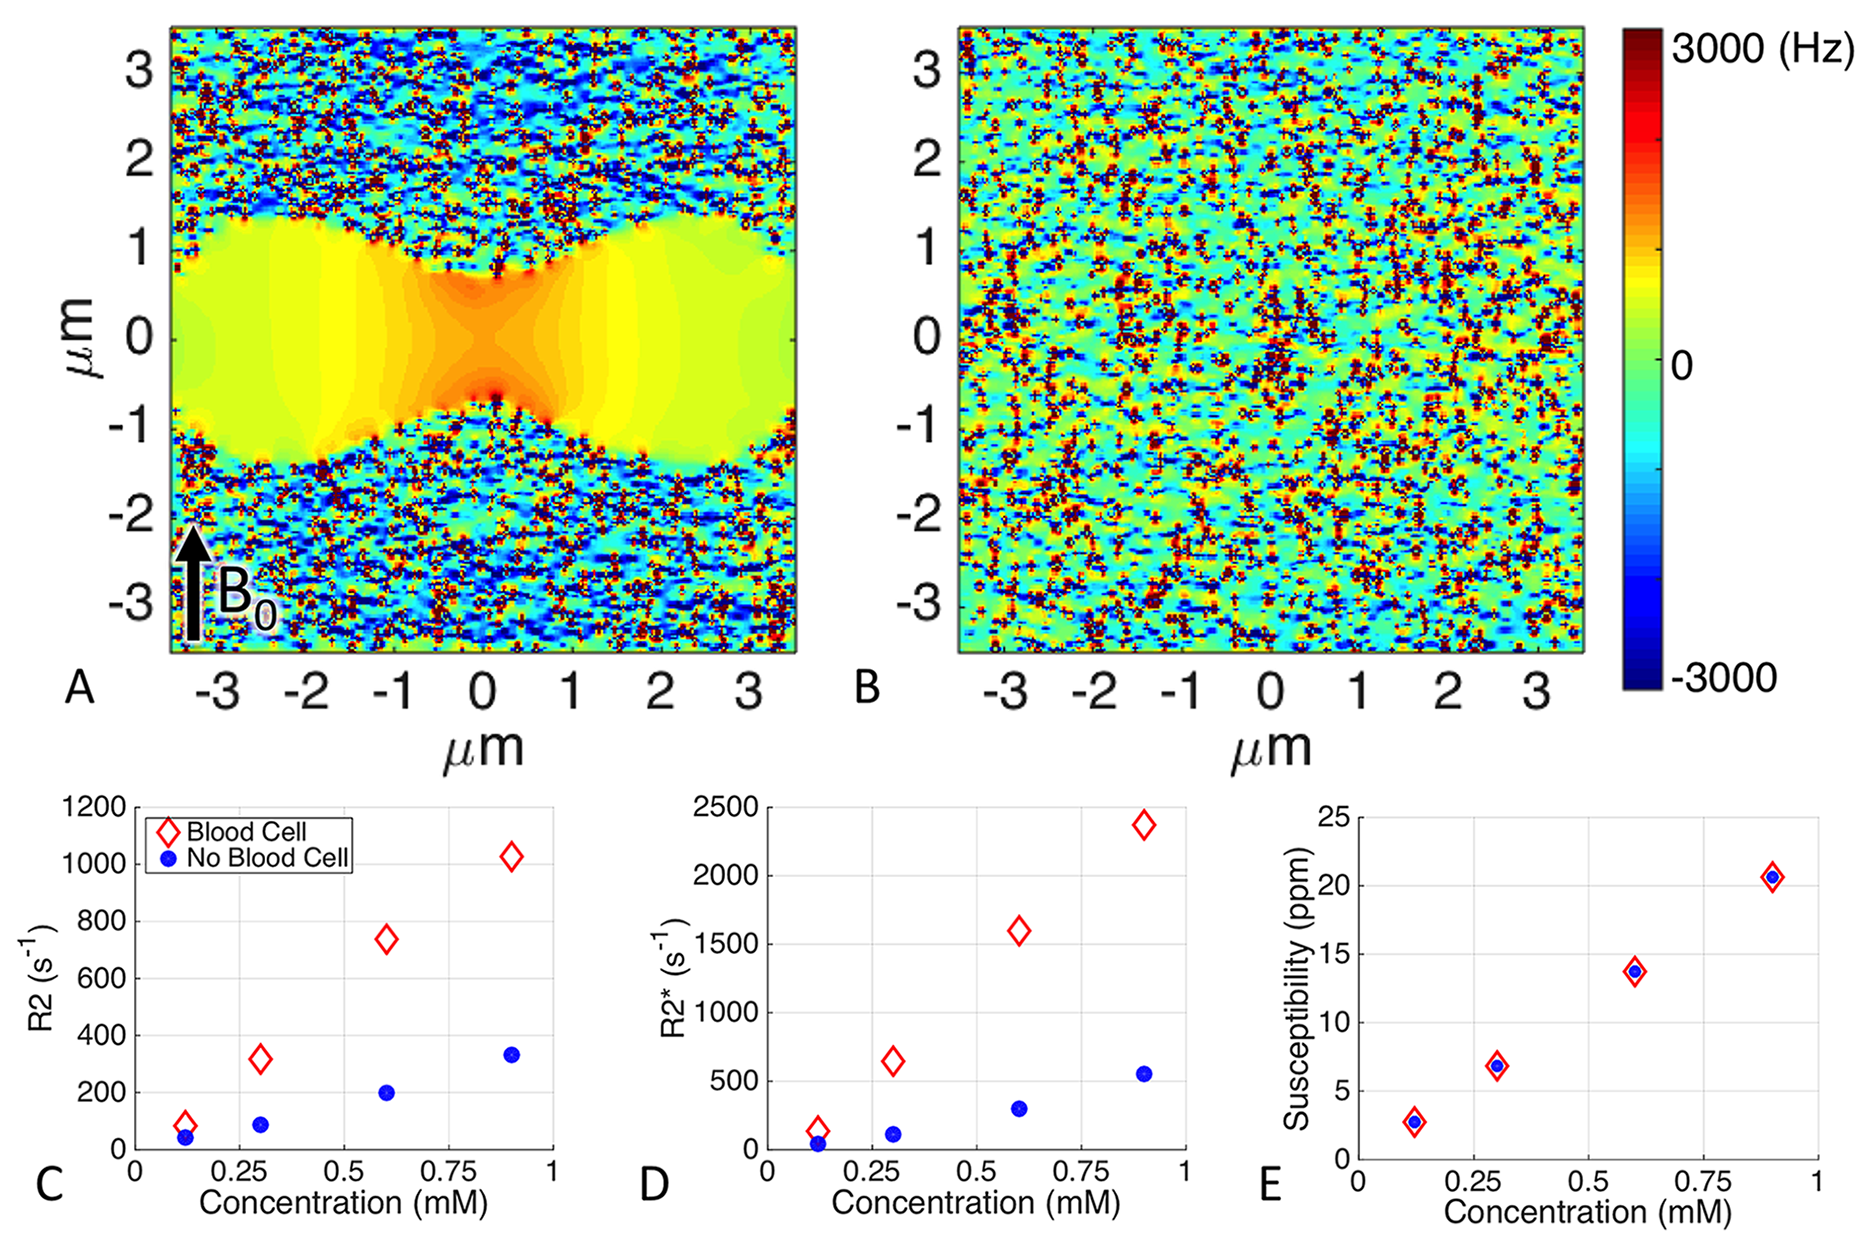
An animation of the simulated field maps with and without blood is shown in Figure 2. Magnetic field inhomogeneities occur inside the blood cell due to the susceptibility effects of the surrounding ferumoxytol particles.
A central slice from each of the simulated field maps is shown in Figure 3A-B. The estimated R2 and R2* (Figure 3C-D) are highly dependent on the presence of a blood cell even though the ferumoxytol concentration and susceptibility (Figure 3E) are the same.
In Vitro Experiments
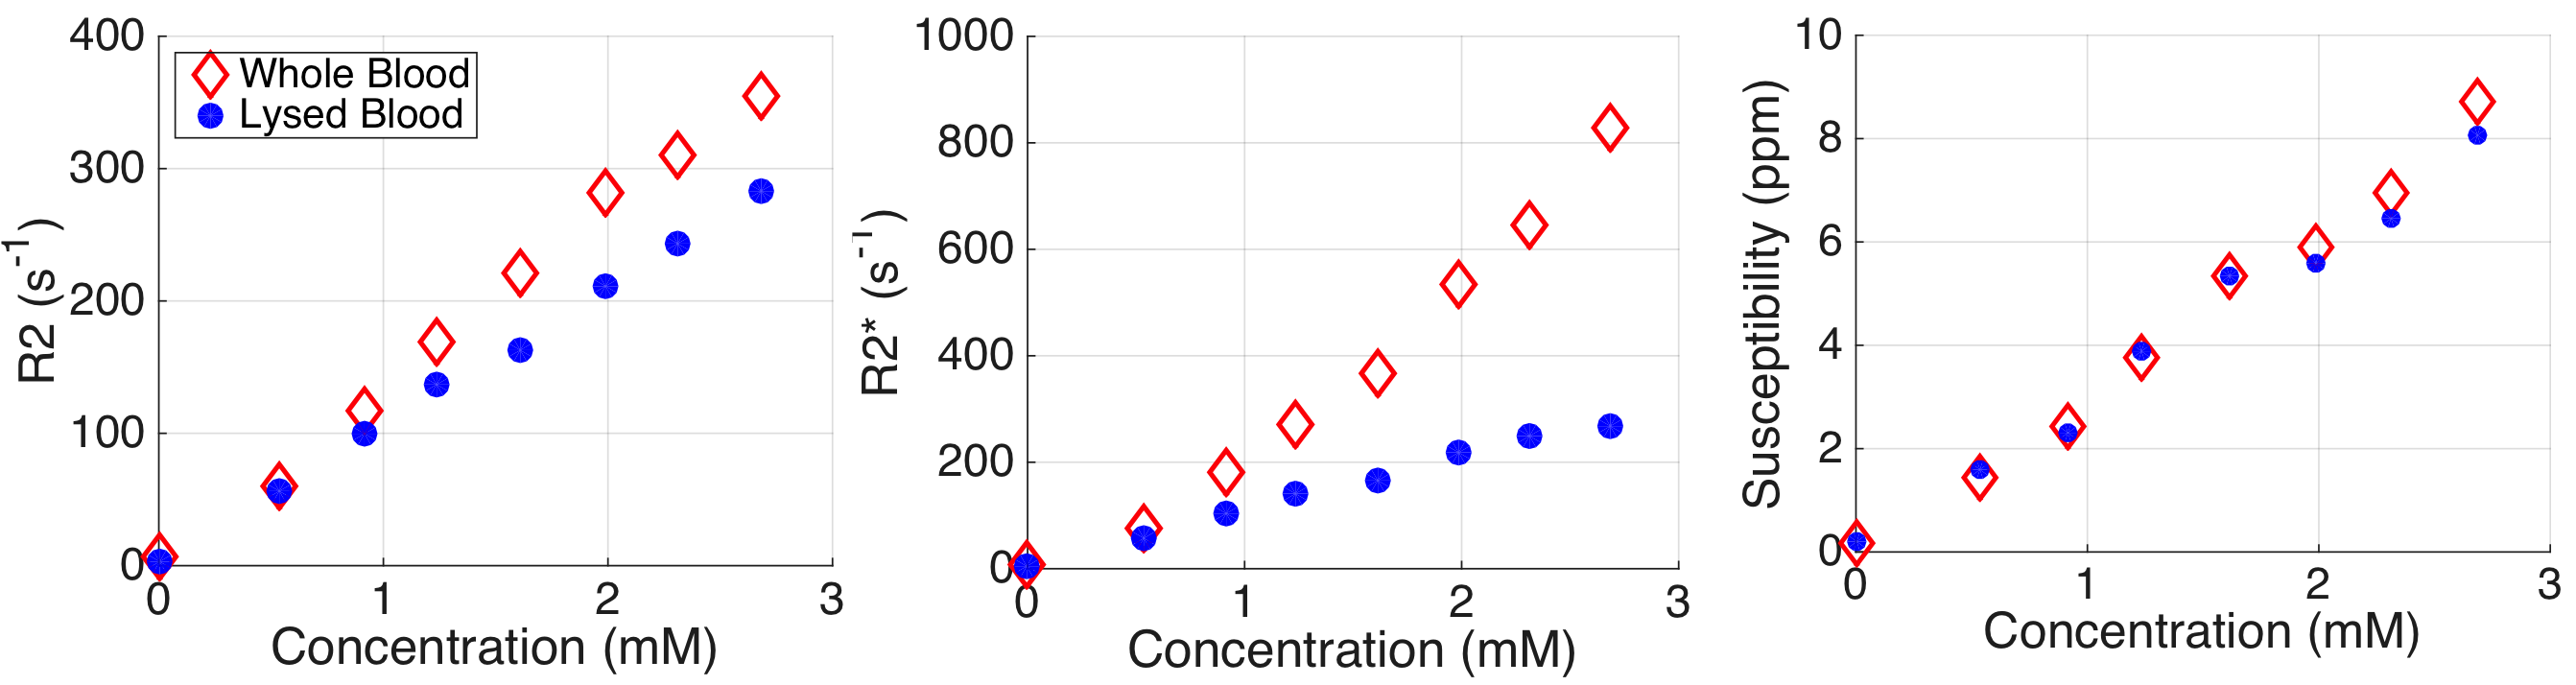
Large differences between whole and lysed blood are seen in the estimated R2 and R2* at different concentrations of ferumoxytol (Figure 4). In contrast, QSM-based susceptibility measurements are insensitive to the presence of whole versus lysed blood.
Discussion & Conclusions
Our simulated and in vitro experiments demonstrate that R2 and R2* are strongly dependent on the spatial distribution of iron1,2. In contrast, QSM is largely insensitive to the microscopic distribution of iron, with a linear relationship to iron concentration.
The trends are similar between our simulations and experiments, but the exact values are different, possibly due to our simulations having only one blood cell, errors in the estimated properties of a ferumoxytol particle, or discrepancies in diffusion properties. Interestingly, small differences in our in vitro QSM estimates appear to be present at high iron concentration. These effects may be due to remaining resolution- and contrast-dependent bias, which is a known challenge with QSM10,11.
In summary our results demonstrate that QSM may enable tissue iron quantification that is unconfounded by the microscopic spatial distribution of iron.
Acknowledgements
The Departments of Radiology and Medical Physics, at the University of Wisconsin, supported this project. The authors also wish to acknowledge support from GE Healthcare, the National Cancer Institute of the National Institutes of Health under Award Number T32CA009206, and the NIH (R01 DK100651). The authors would also like to thank Shelly Davis from the McArdle Laboratory for Cancer Research at the University of Wisconsin-Madison for their help.References
1. Ghugre NR, Wood JC. Relaxivity-iron calibration in hepatic iron overload: probing underlying biophysical mechanisms using a Monte Carlo model. Magn Reson Med. 2011;65(3):837-47.
2. Corot C, Robert P, Idee JM, Port M. Recent advances in iron oxide nanocrystal technology for medical imaging. Adv Drug Deliv Rev. 2006;58(14):1471-504.
3. Sharma SD, Hernando D, Horng DE, Reeder SB. Quantitative susceptibility mapping in the abdomen as an imaging biomarker of hepatic iron overload. Magn Reson Med. 2014;73(3):673-683.
4. Schenck JF. The role of magnetic susceptibility in magnetic resonance imaging: MRI magnetic compatibility of the first and second kinds. Med Phys. 1996;23(6):815-50.
5. M. A. Yurkin, “Discrete dipole simulations of light scattering by blood cells,” PhD Thesis, University of Amsterdam (2007).
6. Bullivant JP, Zhao S, Willenberg BJ, Kozissnik B, Batich CD, Dobson J. Materials characterization of Feraheme/ferumoxytol and preliminary evaluation of its potential for magnetic fluid hyperthermia. Int J Mol Sci. 2013;14(9):17501-10.
7. Prince MR, Zhang HL, Chabra SG, et al. A pilot investigation of new superparamagnetic iron oxide (ferumoxytol) as a contrast agent for cardiovascular MRI. J Xray Sci Technol. 2003;11(4):231-40.
8. Liu J, Liu T, de Rochefort L, Ledoux J, Khalidov I, Chen W, Tsiouris A, Wisnieff C, Spincemaille P, Prince M, Wang Y, Morphology enabled dipole inversion for quantitative susceptibility mapping using structural consistency between the magnitude image and the susceptibility map, Neuroimag 2012;59:2560-2568.
9. Liu T, Khalidov I, de Rochefort L, Spincemaille P, Liu J, Tsiouris A, Wang Y, A novel background field removal method for MRI using projection onto dipole fields (PDF), NMR Biomed 2011;24:1129-36.
10. Zhou D, Cho Junghun, Zhang J, Spincemaille P, Wang Y, Susceptibility Underestimation in a High-Susceptibility Phantom: Dependence on Imaging Resolution, Magnitude Contrast, and Other Parameters, Magn Reson Med. 2017; 78(3):1080-6.
11. Sharma SD, Fischer R, Schoennagel BP, Nielsen P, Kooijman H, Yamamura J, Adam G, Bannas P, Hernando D, Reeder SB. MRI-based quantitative susceptibility mapping (QSM) and R2* mapping of liver iron overload: Comparison with SQUID-based biomagnetic liver susceptometry. Magn Reson Med. 2016;78(1):264-270.
Figures