0194
Age- and sex-related spatial patterns of variation in normal brain magnetic susceptibility (QSM) revealed by Blind Source Separation (BSS) and Supervised Machine Learning1Buffalo Neuroimaging Analysis Center, Department of Neurology, Jacobs School of Medicine and Biomedical Sciences, University at Buffalo, The State University of New York, Buffalo, NY, United States, 2Center for Biomedical Imaging, Clinical and Translational Science Institute, University at Buffalo, The State University of New York, Buffalo, NY, United States, 3MR Research Laboratory, IRCCS, Don Gnocchi Foundation ONLUS, Milan, Italy, 4BairdMS Center, Department of Neurology, Jacobs School of Medicine and Biomedical Sciences, University at Buffalo, The State University of New York, Buffalo, NY, United States
Synopsis
Previous studies using QSM have demonstrated a relatively high inter-subject variation of brain susceptibility. In the present work, we combined a blind source separation technique with a machine learning strategy to disentangle spatial networks of independent variation of brain susceptibility. As a first step toward a better understanding of the underlying causes of variation, we studied their associations with age and sex. The analysis revealed several networks with distinct anatomical features, although the applied analysis technique did not involve any information about anatomy, age, or sex.
Introduction
Quantitative susceptibility mapping (QSM) is increasingly being used to study brain iron due to its uniquely high sensitivity toward paramagnetic tissue components.1-5 However, previous studies using QSM6-9 have demonstrated a relatively high inter-subject variation of brain susceptibility, consistent with iron histochemistry.10 While a small fraction of this variability can be explained by chronological age, the majority of the variation remains hitherto unexplained.
In the present work, we combined a Blind Source Separation technique with a machine learning strategy to disentangle spatial networks of independent variation of brain susceptibility. As a first step toward a better understanding of the underlying causes of variation, we studied their associations with age and sex.
Methods
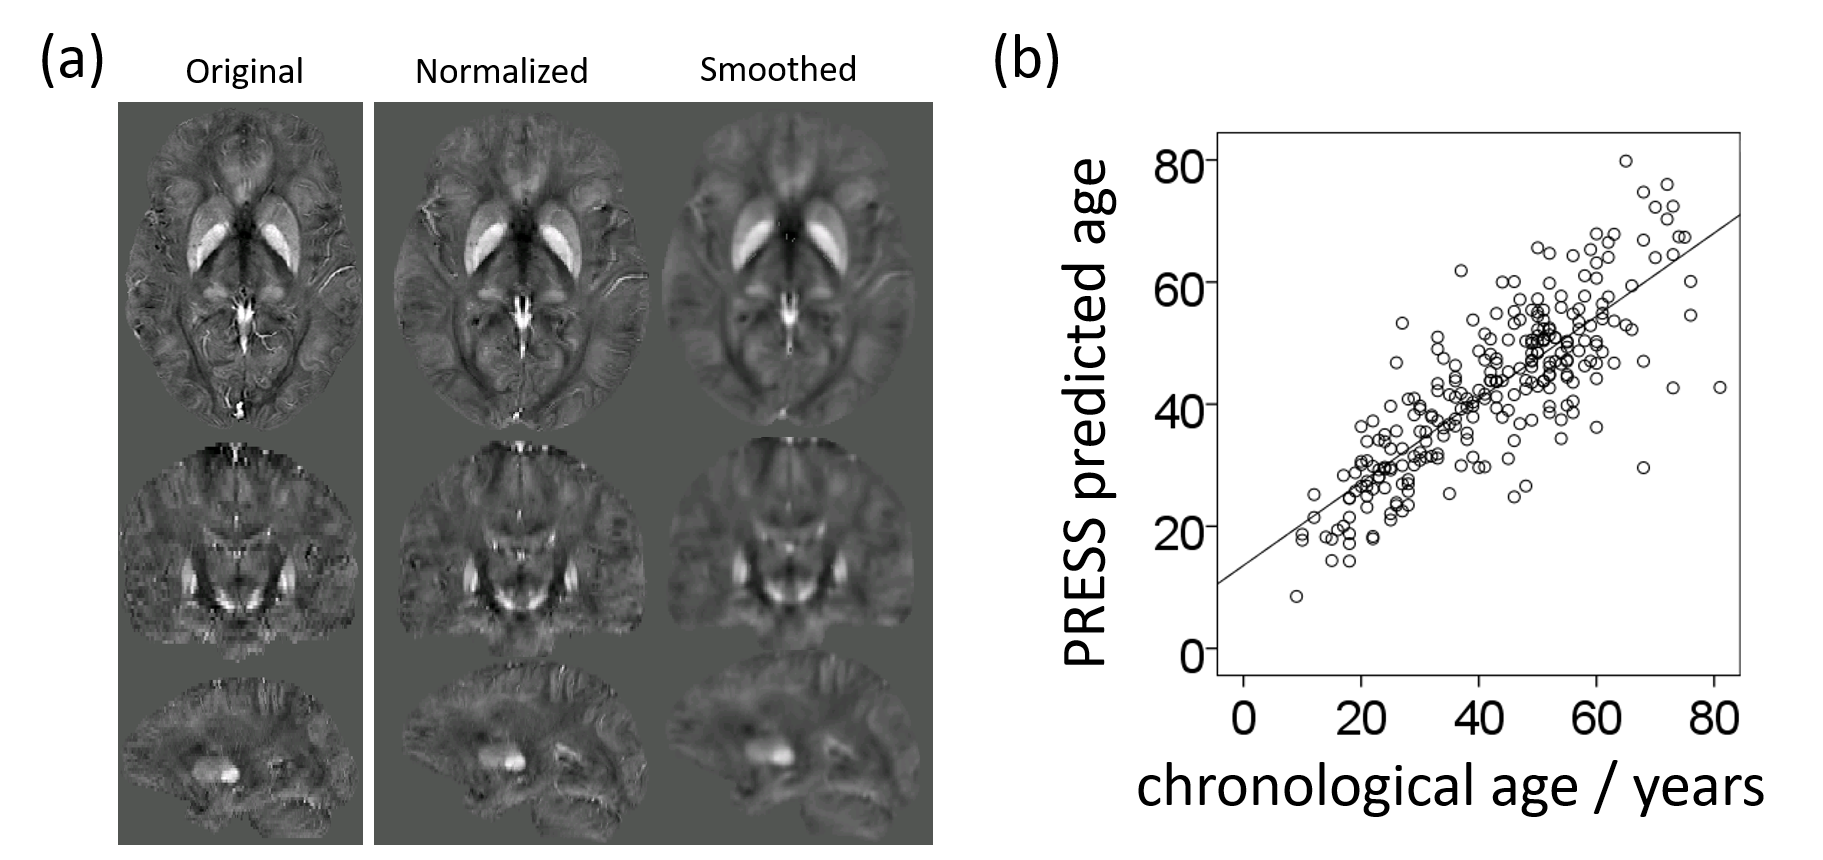
MRI and data reconstruction: This IRB-approved study involved 262 healthy subjects (170 female; 92 male). Ages spanned from 9 to 81 years (average±std 42.49±15.75years). Imaging was performed at 3T using single-echo gradient-echo (matrix 512x192x64; 0.5x1x2mm3; 12° flip, TE/TR=22ms/40ms, bandwidth=13.89kHz). Susceptibility maps were obtained by phase unwrapping,11 background-field correction,12,13 and HEIDI.14 All susceptibility maps were normalized (ANTs) to a custom isotropic 1mm3 susceptibility brain template15 and smoothed with a 1mm Gaussian kernel.
Source Separation: Applying a 3D Independent Component Analysis (ICA; FSL-MELODIC) to the entire cohort, we separated the inter-subject susceptibility variations into their underlying statistically independent source networks (Independent Components; ICs) and the corresponding subject-specific weights for each network (mixing coefficients; MCs). In a first pre-filtering step, we searched for significant outliers in mixing coefficients (MC) to identify and eliminate non-representative subjects from the cohort, e.g., subjects with potential subclinical pathology leading to extreme DGM iron. Visual screening of the ICs resulting from ICA applied to the cleaned cohort identified networks that showed typical QSM artifacts and vessels, which were excluded from subsequent analyses.
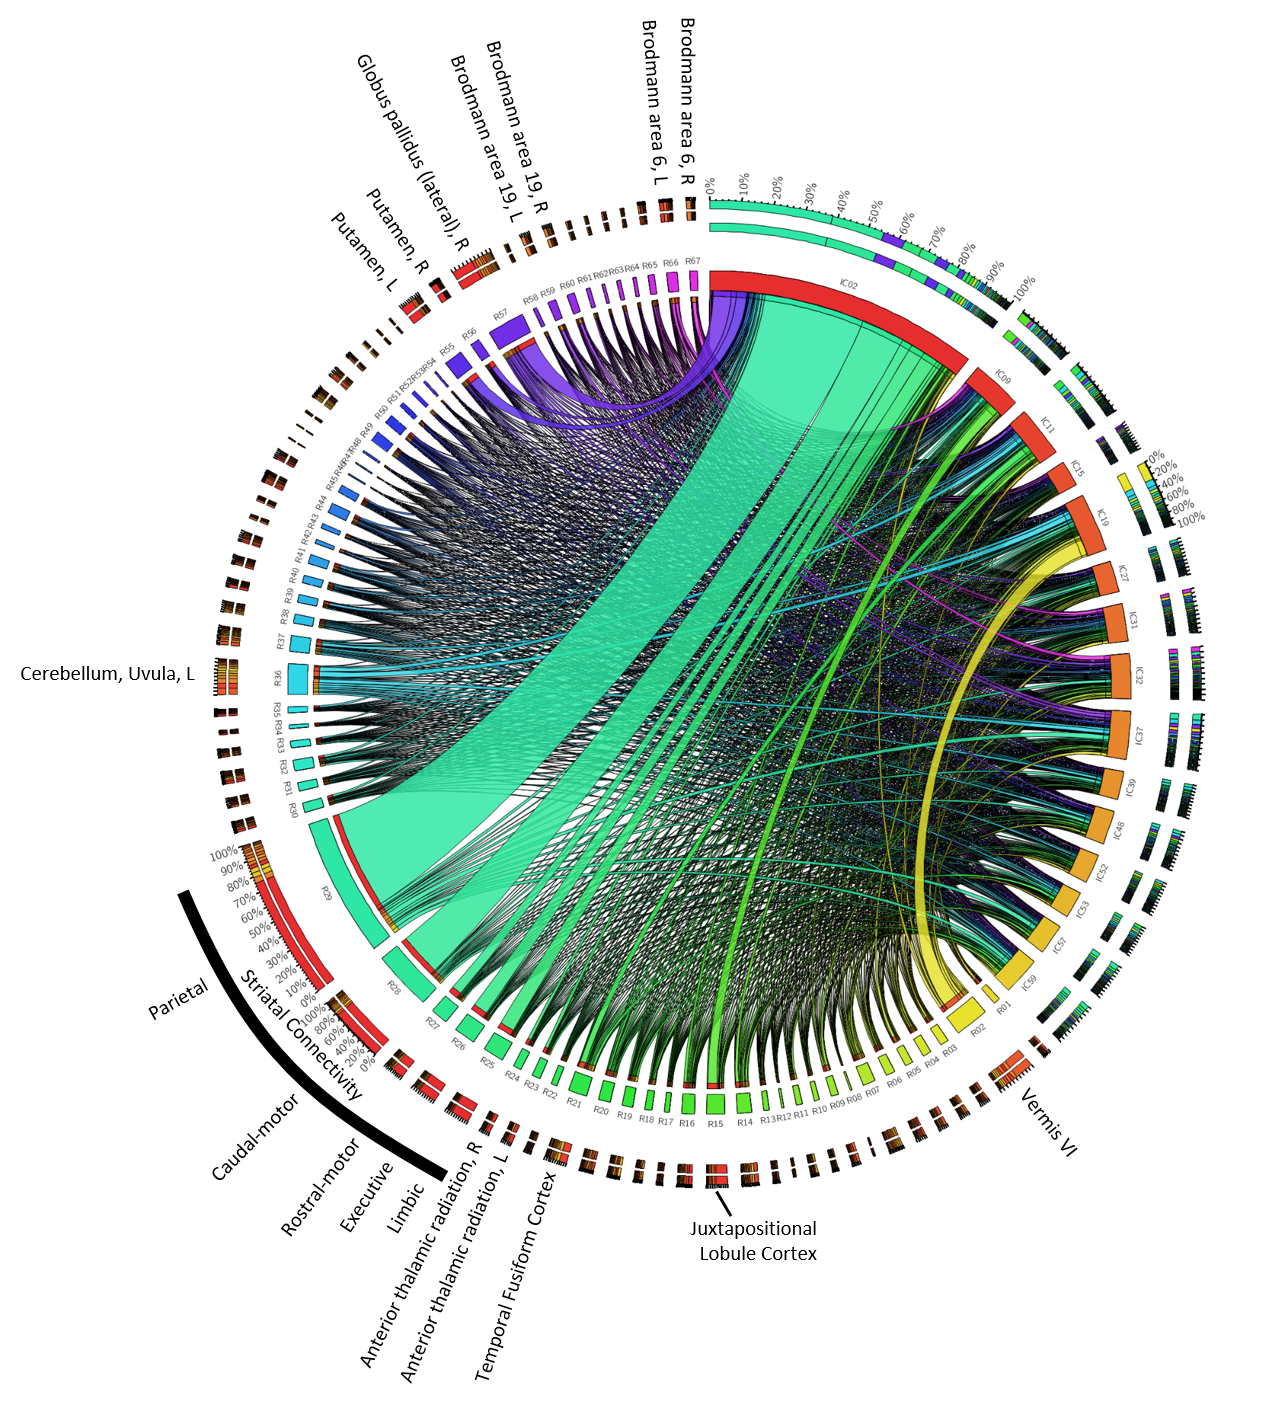
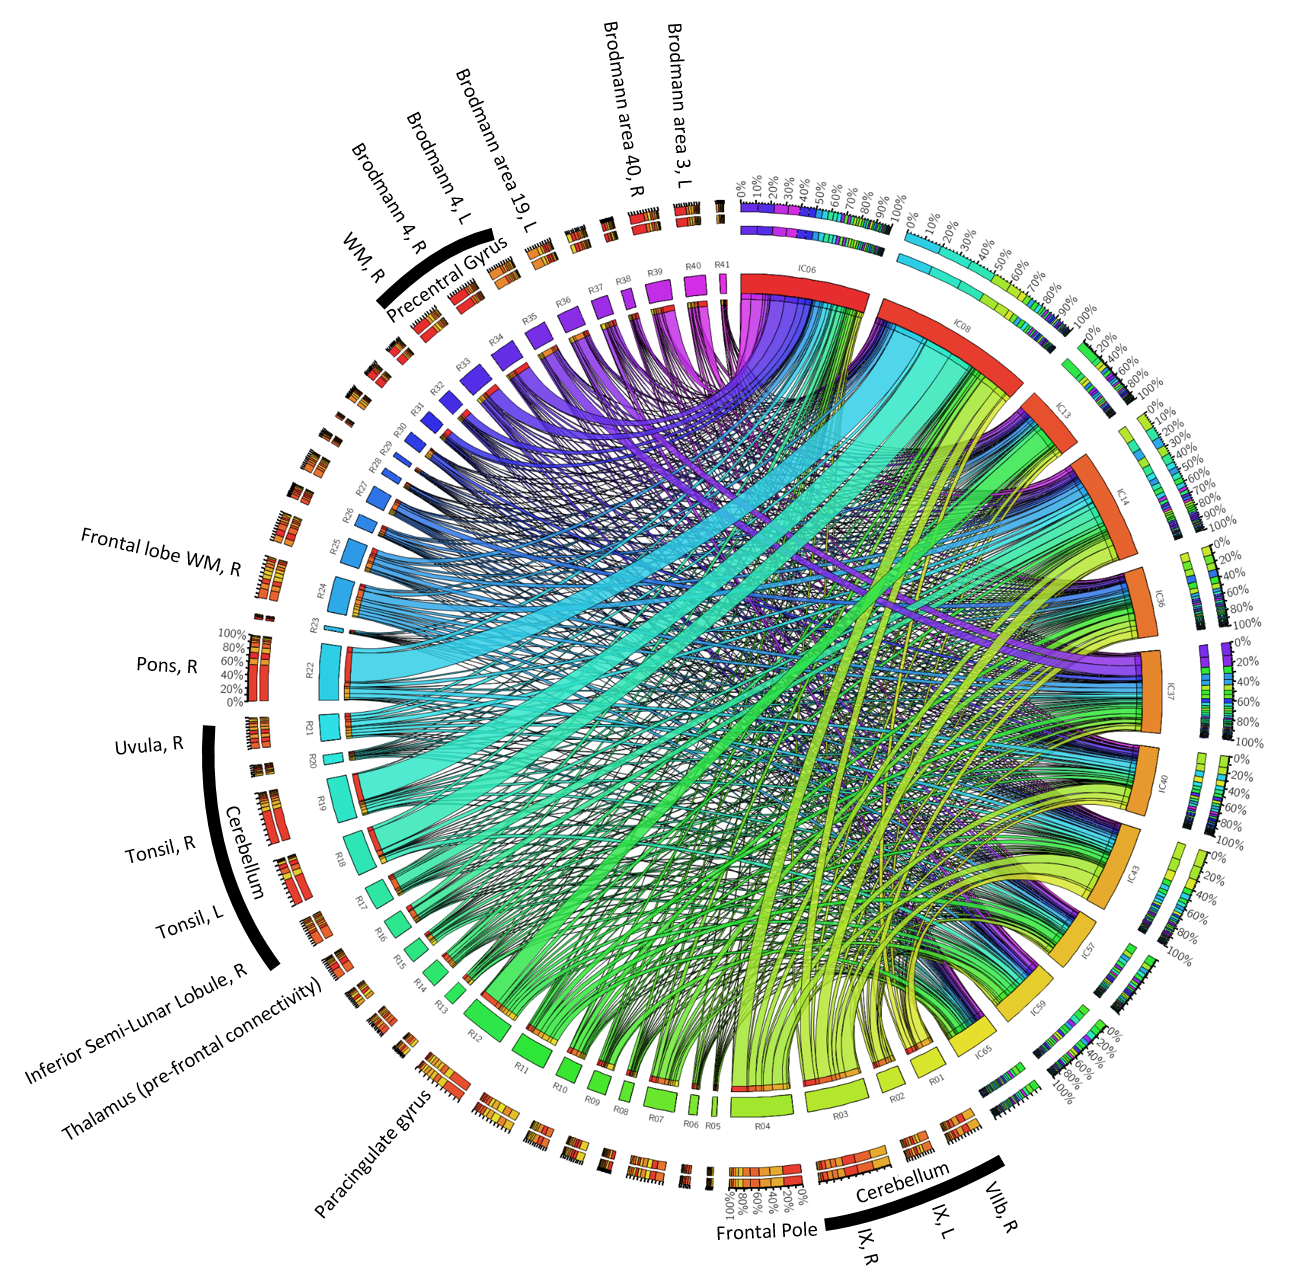
To assess the anatomical representation of the IC-networks, we calculated for each IC the intensity mean values in the anatomical regions defined by brain atlases of thalamic connectivity,16,17 striatal connectivity,18 tractography,19 cerebellum,20 and the Talairach atlas.21 Regions were considered for subsequent analyses if Spatial Mixture Modelling revealed more than 200 voxels with p<0.05 in the region. Associations of networks (ICs) with anatomical locations were visualized using Circos.22
Machine learning: To identify networks associated with age, we applied step-wise linear regression with network inclusion based on F-probability (entry: 0.05; removal: 0.10). To identify networks associated with sex, we applied a Linear Discriminant Analysis (LDA) classification algorithm to the MCs with stepwise inclusion (entry F=3.84; removal F=2.71). To confirm a statistically significant effect of sex on the included networks (avoiding the confounding effect of age), we applied univariate ANCOVA controlling for age. We determined predictive power in a leave-one-out cross-validation using predicted residual sum-of-squares (PRESS) statistics.
Results
Figure 1a shows an exemplary susceptibility map before and after the spatial normalization procedure. Six subjects and 13 ICs satisfied the exclusion criteria, resulting in 52 meaningful networks (ICs).
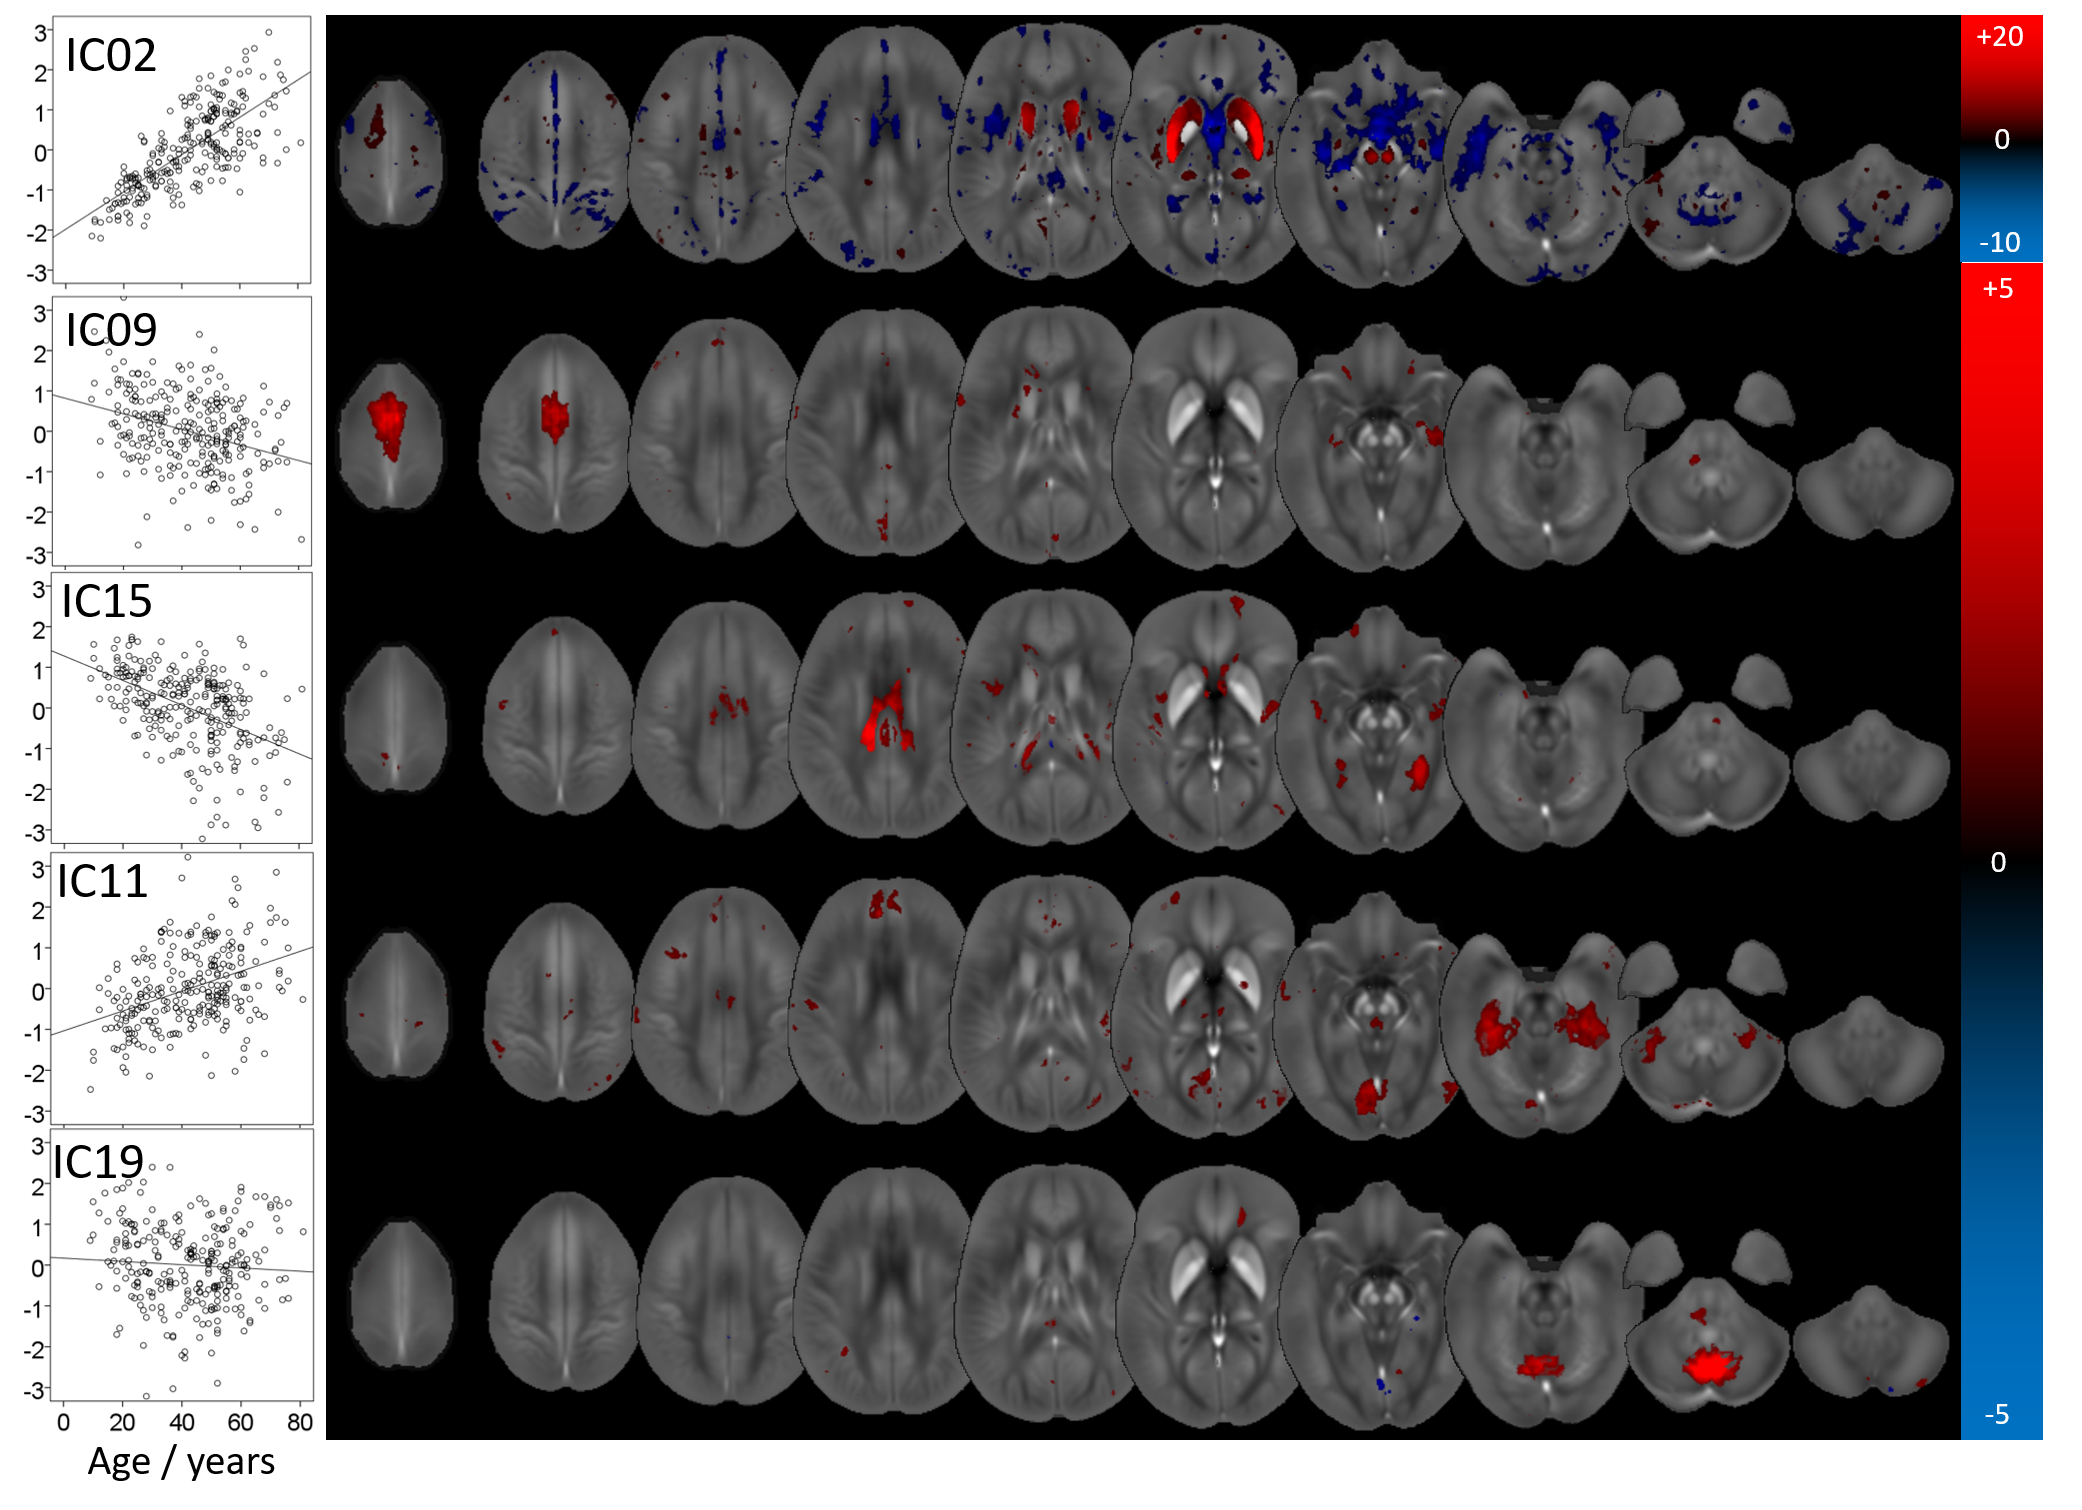
We identified fifteen distinct aging-networks which could explain the chronological age with R2=68.3% (Figure 1b): ICs 02,09,15,11,19,27,31,32,37,39,48,52,53,57, and IC59. Figures 2 and 3 visualize selected networks, their association with age, and the anatomical associations for all networks.
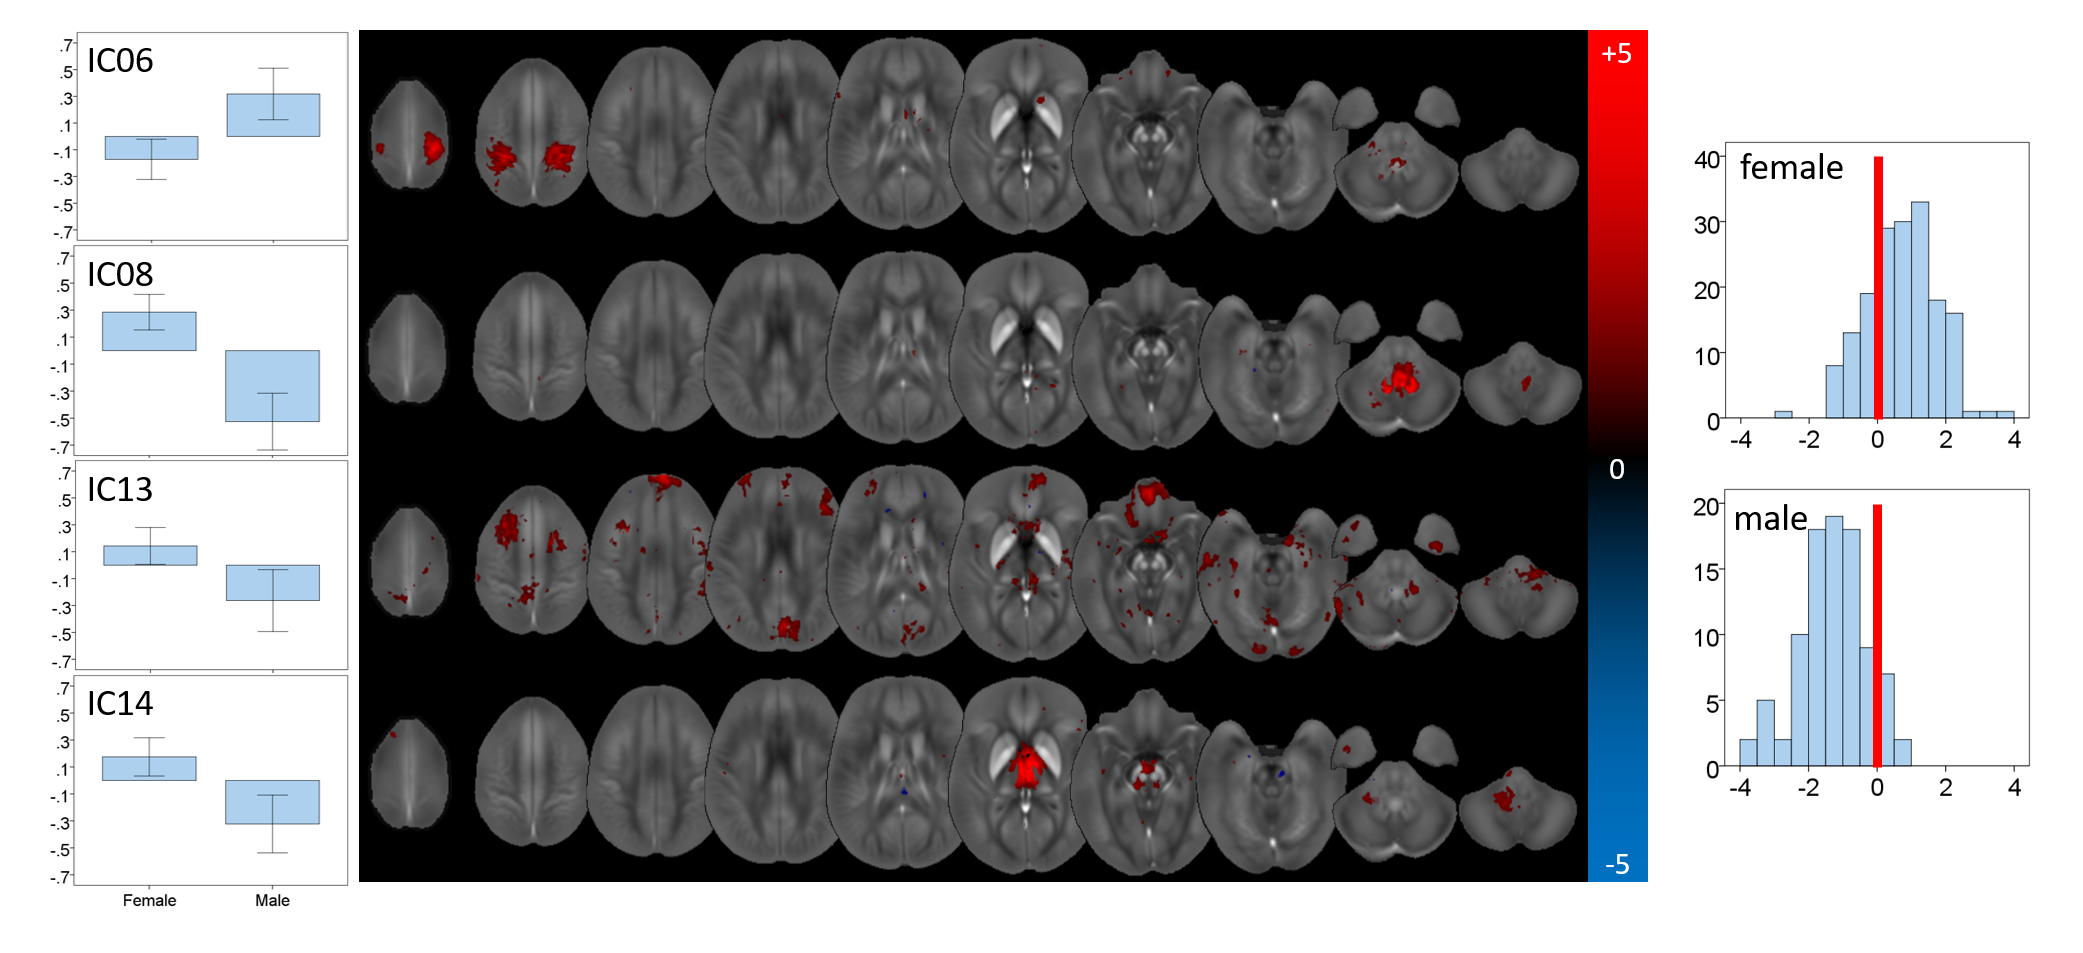
Fourteen networks were associated with sex: ICs 02,06,08,13,14,36,37,40,41,43,45,57,59, and 65 (see Figs. 4 and 5). Average values of MCs were significantly different (p<0.05) between the groups for most of these ICs (Fig. 4, left). ANCOVA revealed a significant interaction of MCs with age only in ICs 02,41, and 45. The elimination of these networks led to a cross-validated sensitivity and specificity for the prediction of the sex of 81.8% and 81.8%, respectively (Fig. 4, right).
Discussion
The application of Blind Source Separation and Machine Learning strategies to a large group of normal subjects revealed several networks with distinct anatomical features, although the applied analysis technique did not involve any information about anatomy, age, or sex.
The network with the most robust age-association (IC02) contained primarily the striatum, consistent with histochemical findings.10 Contributions were most substantial in regions with parietal and caudal-motor connections. Other networks contained vermis and uvula in the cerebellum as well as cortical regions. However, overall, chronological age could not explain a substantial fraction of variation in the MCs, confirming that other mechanisms influence inter-subject variation in brain susceptibility. Sex-networks featured anatomical regions distinct from those in aging networks, including primarily the cerebellum, pons, thalamus, and cortical areas (Fig. 5). The predictive power for sex was relatively high.
Conclusion
We presented an advanced analysis technique for revealing independent networks of brain susceptibility variations in the normal population. It will be the subject of future research to elucidate the association of identified networks with lifestyle and environmental factors or subclinical pathology, and further analyze the identified networks with respect to structural and functional connectivity.Acknowledgements
Research reported in this publication was funded by the National Center for Advancing Translational Sciences of the National Institutes of Health under Award Number UL1TR001412. The content is solely the responsibility of the authors and does not necessarily represent the official views of the NIH.
We thank Dr. David Wack (Department of Nuclear Medicine) for stimulating discussions about the employed analysis techniques.
References
[1] C. Liu, W. Li, K. A. Tong, K. W. Yeom, and S. Kuzminski, “Susceptibility-weighted imaging and quantitative susceptibility mapping in the brain,” J Magn Reson Imaging, 42(1):23-41; 2015.
[2] C. Liu, H. Wei, N.-j. Gong, M. J. Cronin, R. Dibb, and K. Decker, “Quantitative Susceptibility Mapping: Contrast Mechanisms and Clinical Applications,” Tomography, 1(1):3–17; 2015.
[3] C. Stüber, D. Pitt, and Y. Wang, “Iron in Multiple Sclerosis and Its Noninvasive Imaging with Quantitative Susceptibility Mapping,” Int J Mol Sci, 17(1):100; 2016.
[4] J. R. Reichenbach, F. Schweser, B. Serres, and A. Deistung, “Quantitative Susceptibility Mapping: Concepts and Applications,” Clin Neuroradiol, 25(S2):225–230; 2015.
[5] E. M. Haacke, S. Liu, S. Buch, W. Zheng, D. Wu, and Y. Ye, “Quantitative susceptibility mapping: current status and future directions,” Magn Reson Imaging, 33(1):1–25; 2015.
[6] W. Li, B. Wu, A. Batrachenko, V. Bancroft-Wu, R. A. Morey, V. Shashi, C. Langkammer, M. D. De Bellis, S. Ropele, A. W. Song, and C. Liu, “Differential developmental trajectories of magnetic susceptibility in human brain gray and white matter over the lifespan.” Hum Brain Mapp, 35(6):2698–713; 2014.
[7] J. Acosta-Cabronero, M. J. Betts, A. Cardenas-Blanco, S. Yang, and P. J. Nestor, “In Vivo MRI Mapping of Brain Iron Deposition across the Adult Lifespan,” Journal of Neuroscience, 36(2):364–374; 2016.
[8] M. C. Keuken, K. Backhouse, S. Beekuizen, L. Himmer, A. Kandola, J. J. Lafeber, L. Prochazkova, A. Trutti, A. Schäfer, R. Turner, and B. U. Forstmann, “Effects of aging on T1, T2*, and QSM MRI values in the subcortex.” NeuroImage.
[9] M. Liu, S. Liu, K. Ghassaban, W. Zheng, D. Dicicco, Y. Miao, C. Habib, T. Jazmati, and E. M. Haacke, “Assessing global and regional iron content in deep gray matter as a function of age using susceptibility mapping,” J Magn Reson Imaging, 2015.
[10] B. Hallgren and P. Sourander, “The effect of age on the non-haemin iron in the human brain,” J Neurochem, 3:41–51; 1958.
[11] H. S. Abdul-Rahman, M. A. Gdeisat, D. R. Burton, M. J. Lalor, F. Lilley, and C. J. Moore, “Fast and robust three-dimensional best path phase unwrapping algorithm.” Appl Opt, 46(26):6623–35; 2007.
[12] W. Li, B. Wu, and C. Liu, “Quantitative susceptibility mapping of human brain reflects spatial variation in tissue composition.” NeuroImage, 55(4):1645–56; 2011.
[13] F. Schweser, A. Deistung, B. W. Lehr, and J. R. Reichenbach, “Quantitative imaging of intrinsic magnetic tissue properties using MRI signal phase: An approach to in vivo brain iron metabolism?” NeuroImage, 54(4):2789–2807, 2011.
[14] F. Schweser, K. Sommer, A. Deistung, and J. R. Reichenbach, “Quantitative susceptibility mapping for investigating subtle susceptibility variations in the human brain.” NeuroImage, 62(3):2083–2100; 2012.
[15] J. Hanspach, M. G. Dwyer, N. P. Bergsland, X. Feng, J. Hagemeier, N. Bertolino, P. Polak, J. R. Reichenbach, R. Zivadinov, and F. Schweser, “Methods for the computation of templates from quantitative magnetic susceptibility maps (QSM): Toward improved atlas- and voxel-based analyses (VBA),” J Magn Reson Imaging (in press)
[16] T. E. J. Behrens, H. Johansen-Berg, M. W. Woolrich, S. M. Smith, C. A. M. Wheeler-Kingshott, P. A. Boulby, G. J. Barker, E. L. Sillery, K. Sheehan, O. Ciccarelli, A. J. Thompson, J. M. Brady, and P. M. Matthews, “Non-invasive mapping of connections between human thalamus and cortex using diffusion imaging.” Nature neuroscience, 6(7):750–7; 2003.
[17] T. E. J. Behrens, M. W. Woolrich, M. Jenkinson, H. Johansen-Berg, R. G. Nunes, S. Clare, P. M. Matthews, J. M. Brady, and S. M. Smith, “Characterization and Propagation of Uncertainty in Diffusion-Weighted MR Imaging,” Magn Reson Med, 50(5):1077–1088; 2003.
[18] A. C. Tziortzi, S. N. Haber, G. E. Searle, C. Tsoumpas, C. J. Long, P. Shotbolt, G. Douaud, S. Jbabdi, T. E. J. Behrens, E. A. Rabiner, M. Jenkinson, and R. N. Gunn, “Connectivity-based functional analysis of dopamine release in the striatum using diffusion-weighted MRI and positron emission tomography,” Cerebral Cortex, 24(5):1165–1177; 2014.
[19] K. Hua, J. Zhang, S. Wakana, H. Jiang, X. Li, D. S. Reich, P. A. Calabresi, J. J. Pekar, P. C. M. van Zijl, and S. Mori, “Tract probability maps in stereotaxic spaces: Analyses of white matter anatomy and tract-specific quantification,” NeuroImage, 39(1):336–347; 2008.
[20] J. Diedrichsen, J. H. Balsters, J. Flavell, E. Cussans, and N. Ramnani, “A probabilistic MR atlas of the human cerebellum,” NeuroImage, 46(1):39–46; 2009.
[21] J. L. Lancaster, M. G. Woldorff, L. M. Parsons, M. Liotti, C. S. Freitas, L. Rainey, P. V. Kochunov, D. Nickerson, S. A. Mikiten, and P. T. Fox, “Automated Talairach Atlas labels for functional brain mapping,” Human Brain Mapping, 10(3):120–131; 2000.
[22] M. et al Krzywinski, “Circos: an Information Aesthetic for Comparative Genomics,” Genome Res, 19(604:1639–1645; 2009.
Figures