0192
Microscopic susceptibility anisotropy imaging: A clinically viable gradient-echo MRI technique1Centre for Medical Image Computing, Department of Computer Science, University College London, London, United Kingdom, 2Cardiff University Brain Research Imaging Centre, School of Psychology, Cardiff University, Cardiff, United Kingdom, 3Institute of Imaging Science, Department of Biomedical Engineering, Vanderbilt University, Nashville, TN, United States
Synopsis
The orientation dependence of the gradient-echo MR signal in brain white matter conflates two principal effects, (i) the susceptibility properties of tissue microenvironments, especially the myelin microstructure, and (ii) the axon orientation distribution with respect to the external magnetic field. This work introduces a clinically feasible MRI method based on gradient-echo and diffusion measurements, which we refer to as microscopic susceptibility anisotropy imaging, that disentangles both effects, hence enabling us to estimate microscopic susceptibility anisotropy unconfounded by fibre crossings and orientation dispersion as well as magnetic field direction.
Introduction
It has been challenging to map microscopic susceptibility features in orientationally heterogeneous tissue such as brain white matter since the gradient-echo signal depends on the axon orientation relative to the magnetic field1–3. Last year, an ex-vivo study using monkey brain demonstrated that the Spherical Mean Technique (SMT)4 is capable of factoring out the orientation dependence. However, this requires a dense sampling of magnetic field directions and thus is not clinically viable. In this work, we use information about the directional tissue structure inferred from diffusion MRI to remove the confounding effect of the axon orientation distribution and show the first microscopic susceptibility anisotropy maps in humans.
Methods
Microdomain population model. The gradient-echo signal is produced by a large population of microdomains, e.g. (myelinated) axon segments, which may have a complex orientation distribution p. Here we adopt a phenomenological approach and describe, at echo time t, the effective frequency shift of a single microdomain as
$$$(1)\qquad\delta\omega(\theta;t)=\omega_\mathrm{A}(t)\sin^2(\theta)$$$
with respect to a typically short reference time5–7. θ denotes the angle between the microdomain orientation u and magnetic field direction B0, ωA(t) is a time-dependent index of microscopic susceptibility anisotropy quantifying the frequency shift when a small axon segment is oriented perpendicular to B0. The spherical convolution of p with the microscopic signal shift yields the macroscopic (i.e. voxel-scale) signal shift
$$$(2)\qquad\delta E(B_0;t)=\int_{S^2}\exp(i\omega_\mathrm{A}(t)(1-\langle B_0,u\rangle^2)\,t)p(u)\,du$$$
observed in gradient-echo MR measurements. The microscopic frequency anisotropy ωA(t) can then be estimated using Equation (2) once we have knowledge of the axon orientation distribution p, which may be obtained from diffusion imaging.
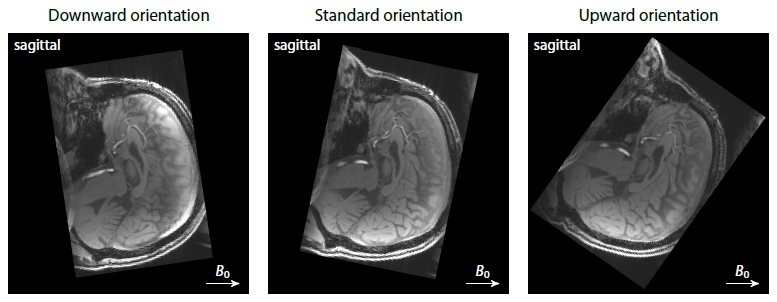
Protocol design. We conducted a human pilot study with a healthy male volunteer (aged 45 years) after written informed consent had been obtained. The multi-modal dataset was acquired on a 3T Siemens Prisma system equipped with a 32-channel head coil. A 3D flow-compensated gradient-echo scan (flip angle 22°, TR = 58 ms, 1.4 mm isotropic, GRAPPA/2) measured a train of 12 gradient echoes (TE1 = 5.8 ms, ESP = 4 ms) at three different head orientations (Figure 1). In addition, a diffusion EPI scan (TR = 4.9 s, TE = 79 ms, 1.5 mm isotropic, SMS/3, twice with signal readout reversed) was performed with two b-shells of 1000 and 3000 s/mm2 and 90 evenly distributed gradient directions each.
Data preprocessing. The three gradient-echo scans were first co-registered. After phase unwrapping8, we computed the frequency difference signal with respect to the first gradient echo5,6, which eliminated time-independent frequency shifts and non-local susceptibility effects, and subsequently subtracted the background field, which was recovered using second-order total generalised variation regularisation9. Following diffusion data preprocessing, we estimated the axon orientation distribution p through spherical deconvolution with a spatially varying impulse response function, which was obtained with the Spherical Mean Technique (SMT), a recently introduced method for microscopic diffusion anisotropy mapping10,11.
Results
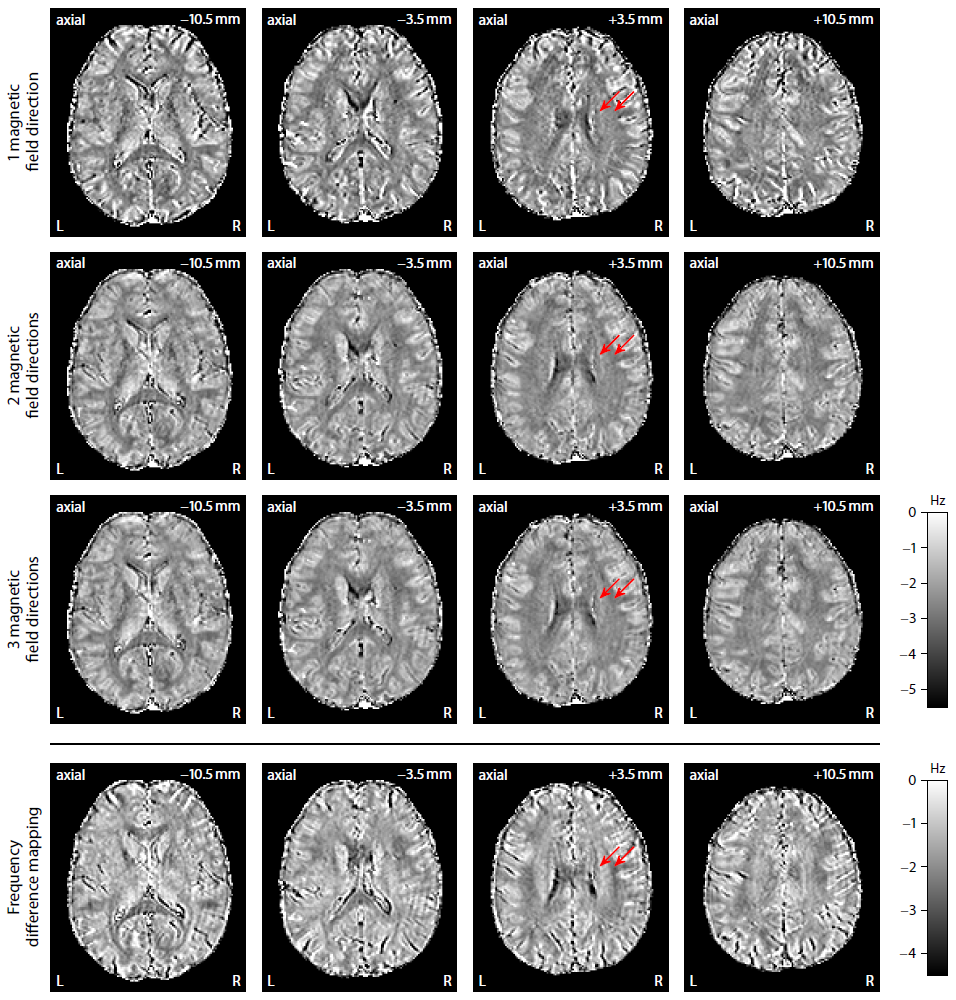
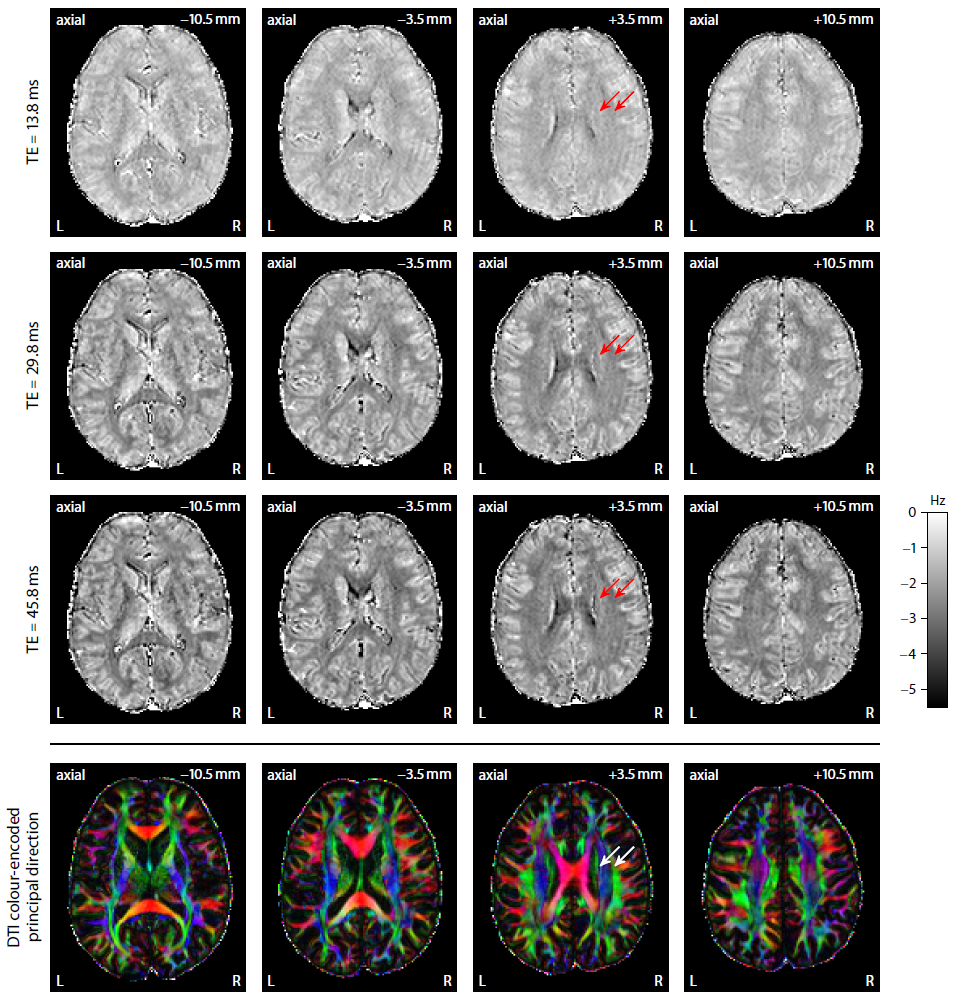
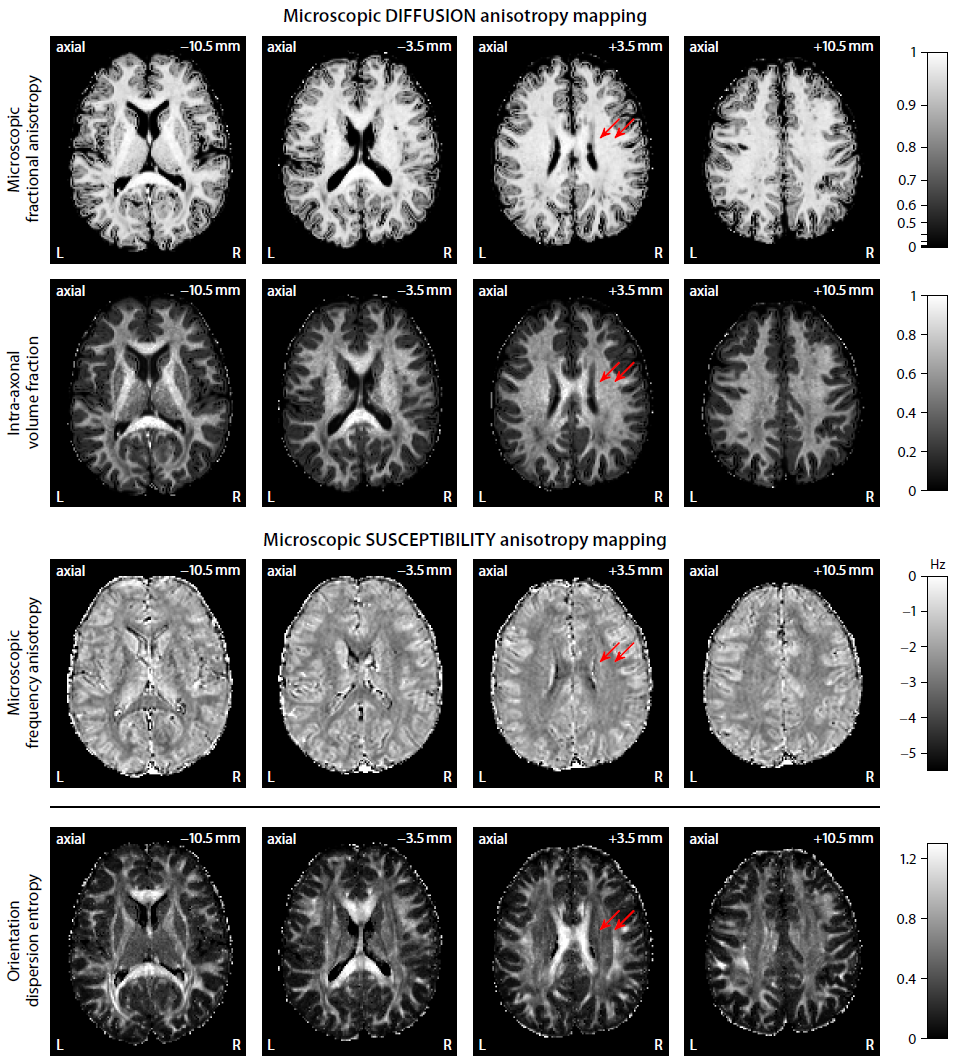
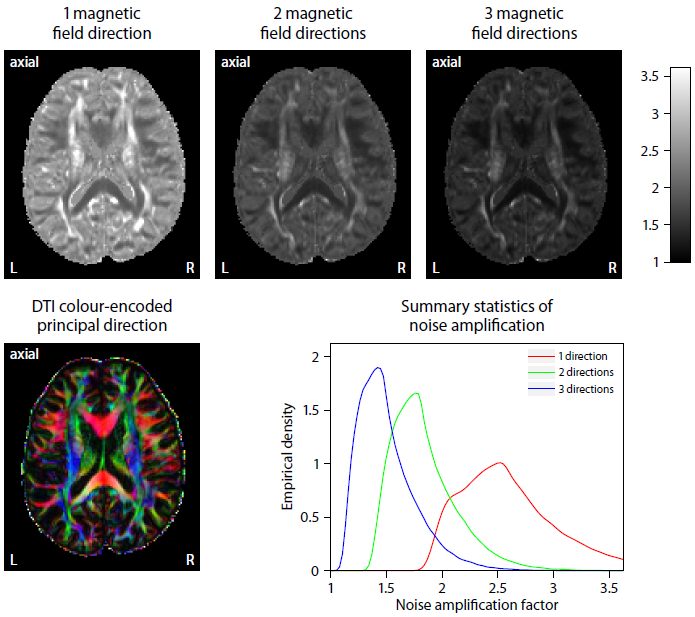
Figure 2 plots maps of microscopic susceptibility anisotropy unconfounded by fibre crossings and orientation dispersion as well as magnetic field direction, which are estimated from gradient-echo measurements with different numbers of B0-directions using diffusion-based knowledge of the axon orientation distribution. In Figure 3 we show that microscopic frequency anisotropy is time-dependent, thus potentially conveying rich information about the fine structure of myelin sheath. Figure 4 compares microscopic diffusion and susceptibility anisotropy imaging. The microscopic fractional anisotropy and intra-axonal volume fraction were recovered using SMT10,11. The orientation dependence has been integrated out in these microscopic parameter maps (first to third row), which are only functions of microscopic tissue features irrespective of the microdomain orientation distribution. It is evident that, even though the directional architecture of brain white matter is highly complex (fourth row11), the microscopic diffusion and susceptibility maps, hence the axon microanatomy, are rather homogeneous. In Figure 5 we quantify the noise amplification effect in microscopic susceptibility anisotropy imaging. Note that the estimation problem is ill-posed because the microscopic axon segments oriented parallel to the external magnetic field, i.e. sin2(θ) = 0 in Equation (1), do not contribute to the observable macroscopic frequency shift. Further subjects show similar results (not shown).Discussion
We have introduced a clinically feasible MRI method for the recovery of microscopic susceptibility anisotropy, which is a direct marker of myelin microstructure. Specifically, diffusion measurements are used to factor out the directional dependence of the gradient-echo signal on the external magnetic field. The general idea extends naturally to more complex models than the microscopic model implemented here. The novel technique provides reasonable results even for a single magnetic field direction, presumably due to the high prevalence of intra-voxel orientational heterogeneity, although a few more directions significantly reduce noise amplification effects. A clinical protocol using EPI throughout and lower spatial resolution is achievable within 10 min scan time.Acknowledgements
This work was supported by grants UK EPSRC EP/M020533/1, EPSRC EP/N018702/1 and EU H2020 634541-2. The software is available online at https://ekaden.github.io.References
1. He X and Yablonskiy DA. Biophysical mechanisms of phase contrast in gradient echo MRI. Proceedings of the National Academy of Sciences of the United States of America, 106:13558–13563, 2009.
2. Bender B and Klose U. The in vivo influence of white matter fiber orientation towards B0 on T2* in the human brain. NMR in Biomedicine, 23:1071–1076, 2010.
3. Lee J, Shmueli K, Fukunaga M, van Gelderen P, Merkle H, Silva AC and Duyn JH. Sensitivity of MRI resonance frequency to the orientation of brain tissue microstructure. Proceedings of the National Academy of Sciences of the United States of America, 107:5130–5135, 2010.
4. Kaden E, Barskaya IY, Kelm ND, West KL, Does MD and Alexander DC. Microscopic susceptibility anisotropy mapping. In Proceedings of the 25th Annual Meeting of the ISMRM, page 0466, 2017.
5. Schweser F, Deistung A, Güllmar D, Atterbury M, Lehr BW, Sommer K and Reichenbach JR. Non-linear evolution of GRE phase as a means to investigate tissue microstructure. In Proceedings of the 19th Annual Meeting of the ISMRM, page 4527, 2011.
6. Wharton S and Bowtell R. Fiber orientation-dependent white matter contrast in gradient echo MRI. Proceedings of the National Academy of Sciences of the United States of America, 109:18559–18564, 2012.
7. Wharton S and Bowtell R. Gradient echo based fiber orientation mapping using R2* and frequency difference measurements. NeuroImage, 83:1011–1023, 2013.
8. Bioucas-Dias JM and Valadão G. Phase unwrapping via graph cuts. IEEE Transactions on Image Processing, 16:698–709, 2007.
9. Bredies K, Kunisch K and Pock T. Total generalized variation. SIAM Journal of Imaging Sciences, 3:492–526, 2010.
10. Kaden E, Kruggel F and Alexander DC. Quantitative mapping of the per-axon diffusion coefficients in brain white matter. Magnetic Resonance in Medicine, 75:1752–1763, 2016.
Figures